Mohammad Muslimin* | Imaduddin Bahtiar Efendi | Achmad Rijanto
© 2026 The authors. This article is published by IIETA and is licensed under the CC BY 4.0 license (http://creativecommons.org/licenses/by/4.0/).
OPEN ACCESS
Uneven airflow distribution is a major challenge in maintaining temperature uniformity in air-cooled battery thermal management system (BTMS). To evaluate this issue, this study compares the thermal performance and airflow characteristics of U-Type and tapered Z-Type configurations in a 12-cell prismatic lithium-ion battery (LIB) pack. The evaluation was conducted using a three-dimensional computational fluid dynamics (CFD) transient model to analyze flow distribution, temperature characteristics, cooling performance, and power consumption at various airflow rates. The results show that the tapered Z-Type provides better thermal performance than the U-Type at all tested airflow rates (3–15 L/s). The tapered Z-Type configuration maintains a more uniform temperature distribution throughout the battery pack and consistently produces a greater temperature reduction than the U-Type. At 15 L/s, the temperature reduction in the tapered Z-Type reaches 5.26 ℃, while in the U-Type it is only 1.98 ℃. Under the investigated conditions, the tapered Z-Type shows promise as an air cooling configuration with superior thermal performance for prismatic LIB packs.
air cooling, battery thermal management systems, computational fluid dynamics, prismatic battery pack
Lithium-ion batterie (LIB) are one of the most widely used energy storage technologies in electric vehicles. The use of LIBs is supported by their high energy density, good charging and discharging efficiency, and long service life. These characteristics make LIBs well-suited for use as energy storage systems in electric vehicles [1, 2]. However, the charging and discharging processes generate heat, which causes the cell temperature to rise. Uneven heat distribution can lead to temperature differences between cells within a battery pack. These conditions can reduce performance, accelerate degradation, and shorten the battery’s service life [3-5]. Therefore, the battery thermal management system (BTMS) must be able to limit the maximum temperature while maintaining temperature uniformity among the cells in the battery pack.
Among the various BTMS methods, forced-air cooling has been widely developed because of its simple configuration and ease of implementation in battery packs. Its thermal performance is greatly influenced by the distribution of airflow in the intercell channels, as uneven airflow distribution causes varying heat dissipation in each cell and results in temperature inconsistencies. Consequently, various studies have been conducted involving flow path configurations and manifold geometry modifications to improve flow distribution and cooling performance. U-Type and Z-Type configurations are two flow arrangements that have been extensively studied in battery air cooling systems [6, 7]. Further research has shown that operating conditions, manifold geometry, and flow channel design affect the air distribution and thermal characteristics of the system [8]. However, controlling the maximum temperature and ensuring temperature uniformity while maintaining low flow resistance remains a challenge in the design of air-cooled BTMS systems.
Uneven airflow distribution remains a challenge in BTMS systems due to pressure variations along the distribution ducts. This condition causes differences in airflow rates between cell ducts, resulting in uneven heat dissipation. In addition to battery cooling strategies, BTMS design optimization has attracted attention due to its impact on thermal performance, energy efficiency, and battery lifetime [9]. One approach to addressing this issue is to modify the manifold geometry by gradually changing the cross-sectional area. These changes in cross-sectional area help regulate the distribution of pressure and flow along the manifold, allowing the cooling air to be distributed more evenly to each channel. A more uniform flow distribution results in a more balanced heat transfer intensity between cells, thereby reducing temperature differences within the battery pack [10, 11]. A recent study on inclined manifolds also reported that when the inlet manifold narrows toward the downstream end, the cooling air is distributed more evenly across the gaps between modules, thereby improving the temperature uniformity of the battery [12]. However, changes in the manifold geometry can also affect the pressure drop, so flow and thermal characteristics must be considered together. In addition, the transient thermo-fluid characteristics between the U-Type and tapered Z-Type configurations in prismatic battery packs still require further study.
Although previous studies have extensively examined U-Type and Z-Type airflow configurations, as well as manifold optimization to improve the thermal performance of air-cooled battery packs, the thermal benefits resulting from manifold modifications have generally received more attention than the associated cooling energy requirements. Consequently, the extent to which a better airflow configuration can simultaneously improve battery thermal performance while maintaining cooling power requirements at a reasonable level has not yet been adequately addressed. To address this research gap, this study employs three-dimensional transient computational fluid dynamics (CFD) simulations to compare the thermal performance and cooling energy requirements between U-Type and tapered Z-Type configurations in a prismatic LIB pack consisting of 12 cells. Thermal performance was evaluated based on the average cell temperature (Tave), the maximum cell temperature (Tmax), and the temperature reduction due to the cooling process (ΔTcooling), while energy requirements were quantified based on cooling power (Pcooling). The specific contribution of this study lies in the integrated evaluation of thermal and energy indicators to explain how modifications to the manifold geometry affect the trade-off between cooling effectiveness and the energy required to achieve it. Thus, this analysis provides a more comprehensive understanding of the ability of the tapered Z-Type configuration to achieve a better balance between thermal performance and cooling energy requirements compared to the conventional U-Type configuration, so that its performance evaluation is not based solely on temperature reduction.
2.1 Physical model
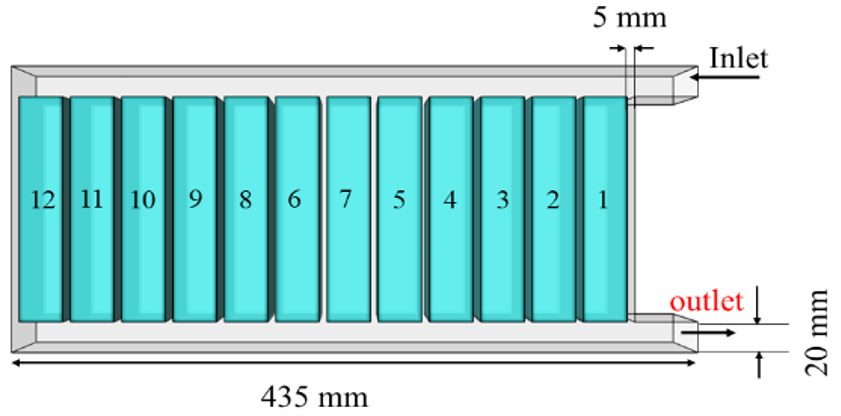
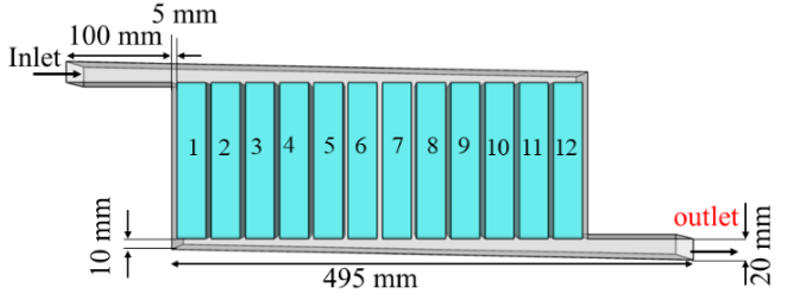
A three-dimensional battery pack comprising twelve prismatic lithium-ion cells was developed to investigate the thermal performance of two air cooling manifold configurations. Each cell has a nominal capacity of 43 Ah, a nominal voltage of 3.65 V, a maximum charge/discharge rate of 2C, and dimensions of 27.5 mm × 91 mm × 148 mm. As illustrated in Figure 1, two cooling arrangements were considered: a conventional U-Type manifold (Figure 1(a)) and a tapered Z-Type manifold (Figure 1(b)). In both designs, cooling airflows through the inter-cell channels and removes the heat generated by the battery pack via forced convection. The U-Type configuration uses inlet and outlet manifolds located on the same side of the pack, whereas the tapered Z-Type design employs opposite-side manifolds with a gradually decreasing cross-sectional area to improve flow distribution. All battery-cell characteristics and operating conditions were maintained unchanged, allowing the thermal behavior and cooling-energy requirement to be evaluated solely as a function of manifold configuration.
In the numerical model used in this study, each prismatic battery cell was modelled as a solid domain with internal volumetric heat generation. Heat generation was assumed to be uniformly distributed throughout the battery cell volume, with the same value in every cell. For the nickel manganese cobalt oxide (NMC) battery under study, the volumetric heat generation rate was set at 41850 W/m³, which represents discharge conditions at a 2C rate within the state of charge (SOC) range of 80-20% [13]. Under these conditions, the contribution of entropic heat to the total heat generation is neglected. This volumetric heat generation value was applied uniformly across the entire cell domain during transient simulations so that each cell experiences an equivalent thermal load. This approach allows for a comparison of the effects of U-Type and tapered Z-Type cooling configurations on the thermal response of the battery pack under identical heat generation conditions.
(a) U-Type
(b) Tapered Z-Type
Figure 1. Battery-pack cooling configurations
2.2 Numerical formulation
The transient airflow and heat transfer within the battery pack were simulated using the finite-volume method implemented in ANSYS Fluent. Air was assumed to be an incompressible Newtonian fluid, whereas the battery cells were modeled as homogeneous solid domains with internal heat generation. Thermal radiation was neglected because forced convection is the dominant heat-removal mechanism in the present air cooling system. The governing equations for mass, momentum, and energy conservation are expressed as follows:
$\frac{\partial \rho}{\partial t}+\nabla \cdot(\rho \mathrm{v})=0$ (1)
$\frac{\partial(\rho \mathrm{v})}{\partial t}+\nabla \cdot(\rho \mathrm{vv})=-\nabla p+\nabla \cdot\left[\left(\mu+\mu_t\right) \nabla \mathrm{v}\right]$ (2)
$\frac{\partial(\rho E)}{\partial t}+\nabla \cdot[\mathbf{v}(\rho E+p)]=\nabla \cdot(k \nabla T)+S_h$ (3)
where, $\rho$, $\mathrm{v}$, $p$, $\mu$, $\mu_t$, $E$, $k$ and $S_h$ denote the fluid density, velocity vector, pressure, dynamic viscosity, turbulent viscosity, total energy, thermal conductivity, and volumetric heat-generation source term, respectively.
The turbulent flow field was modeled using the standard k–ε turbulence model due to its proven capability and computational efficiency for internal forced-convection applications [14, 15]. The k–ε based modeling approach has also been widely applied to air-cooled BTMSs to characterize turbulent airflow and its associated heat transfer behavior in U-Type and Z-Type configurations [16]. Therefore, the standard k–ε model was consistently applied to all configurations in this study to evaluate the effect of geometric modifications on airflow redistribution and thermal characteristics. The transport equations for the turbulent kinetic energy $k$ and turbulence dissipation rate $\varepsilon$ are given by:
$\frac{\partial(\rho k)}{\partial t}+\nabla \cdot(\rho k \mathrm{v})=\nabla \cdot\left[\left(\mu+\frac{\mu_t}{\sigma_k}\right) \nabla k\right]+G_k-\rho \varepsilon$ (4)
$\begin{gathered}\frac{\partial(\rho \varepsilon)}{\partial t}+\nabla \cdot(\rho \varepsilon \mathbf{v})=\nabla \cdot\left[\left(\mu+\frac{\mu_t}{\sigma_{\varepsilon}}\right) \nabla \varepsilon\right] +C_{1 \varepsilon} \frac{\varepsilon}{k} G_k-C_{2 \varepsilon} \rho \frac{\varepsilon^2}{k}\end{gathered}$ (5)
with the turbulent viscosity evaluated as:
$\mu_t=\rho C_\mu \frac{k^2}{\varepsilon}$ (6)
where, $G_k$ is represents the production of turbulent kinetic energy due to mean velocity gradients. The standard model constants were adopted as $C_\mu=0.09$, $C_{1 \varepsilon}=1.44$, $C_{2 \varepsilon}=1.92$, $\sigma_k=1.0$, $\sigma_{\varepsilon}=1.3$.
2.3 Boundary conditions
Transient simulations were performed under identical operating conditions for both cooling configurations. A uniform volumetric heat-generation rate was imposed within all battery cells, while cooling air entered the inlet manifold at a prescribed temperature and velocity and exited through a pressure-outlet boundary. No-slip boundary conditions were applied at all solid-fluid interfaces. The simulations were conducted in ANSYS Fluent using the pressure-based solver with the SIMPLE algorithm for pressure-velocity coupling. The governing equations were discretized using the second-order upwind scheme, and convergence was achieved when the residuals of all equations decreased below $10^{-6}$. The simulation parameters are summarized in Table 1.
Table 1. Simulation parameters
|
Parameter |
Value |
|
Heat generation rate |
41850 W m⁻³ |
|
Inlet air temperature |
25 ℃ |
|
Airflow rates |
3 L/s–15 L/s |
|
Initial battery temperature |
25 ℃ |
|
Outlet condition |
Pressure outlet (0 Pa gauge) |
|
Turbulence model |
Standard k–ε |
|
Solver |
Pressure-based |
|
Pressure-velocity coupling |
SIMPLE |
|
Discretization scheme |
Second-order upwind |
|
Residual criterion |
10-6 |
|
Time step |
1 s |
|
Simulation time |
1080 s |
2.4 Grid independence and validation
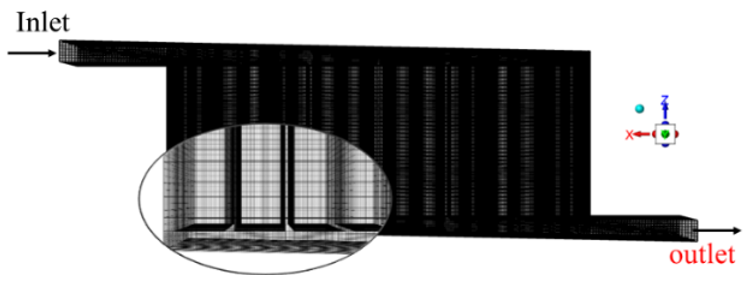
The computational domain was discretized using a hexahedral grid applied to the entire flow domain, including the inlet manifold, the cooling channels between the battery cells, and the outlet manifold. A finer grid resolution was applied to the narrow gaps between the battery cells to better represent the airflow characteristics and heat transfer in that region. A higher grid resolution was chosen for the cooling channels because this region serves as the main path for the cooling airflow and plays a direct role in heat transfer between the battery surface and the cooling air. The computational grid is shown in Figure 2 using the tapered Z-Type configuration as an example, with an enlarged section illustrating the hexahedral grid structure in the cooling channels between the battery cells. The same meshing strategy was applied to the U-Type configuration to ensure consistency in the numerical comparison between the two configurations.
Figure 2. Hexahedral grid of the tapered Z-Type configuration
(a) U-Type
(b) Tapered Z-Type
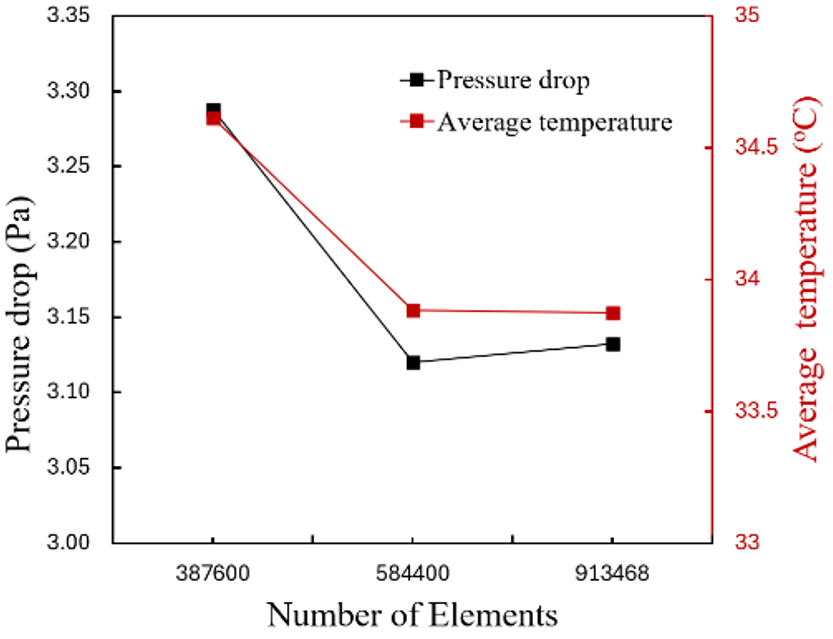
Figure 3. Grid independence test
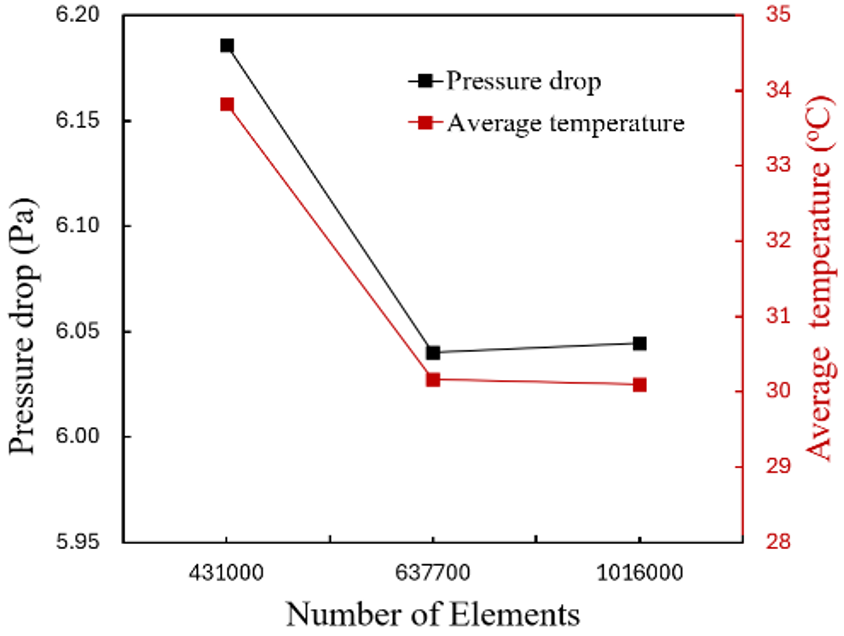
Mesh independence tests were conducted separately for the U-Type and tapered Z-Type configurations using three levels of mesh resolution that were progressively refined. Mesh convergence was evaluated based on two main parameters: pressure drop and average battery temperature, as shown in Figure 3(a) and 3(b). For the U-Type configuration, the tests were conducted using 387,600, 584,400, and 913,468 elements, while for the tapered Z-Type configuration, 431,000, 637,700, and 1,016,000 elements were used. In both configurations, relatively significant changes in the observed parameters occurred when the coarse mesh was refined to a medium mesh. Conversely, further mesh refinement from 584,400 to 913,468 elements in the U-Type configuration and from 637,700 to 1,016,000 elements in the tapered Z-Type configuration resulted in only very small changes in the average battery pressure and temperature drop values. This indicates that further mesh refinement does not significantly alter the numerical solution. Therefore, a mesh with 584,400 elements for the U-Type configuration and 637,700 elements for the tapered Z-Type configuration was selected and used for all subsequent transient simulations. This selection was based on achieving mesh independence while maintaining computational efficiency.
(a) Thermocouple locations
(b) Temperature comparison
Figure 4. Model validation
After the mesh independence test was conducted, a time-step independence test was performed to evaluate the sensitivity of the transient solution to temporal discretization. Temporal convergence was evaluated based on changes in the average battery temperature at the same physical simulation time. The test results showed that using a time step smaller than 1 s resulted in only very small changes in the average battery temperature. Therefore, a time step of 1 s was selected for all transient simulations because it provided adequate temporal resolution without significantly increasing the computational load. The simulation duration was set to 1080 s to evaluate the evolution of the battery pack’s thermal response during the analyzed cooling period. With a time step of 1 s, each simulation consisted of 1080 time steps. The same time step and simulation duration were applied to both the U-Type and tapered Z-Type configurations to ensure that the thermal responses of the two configurations were compared under equivalent temporal conditions.
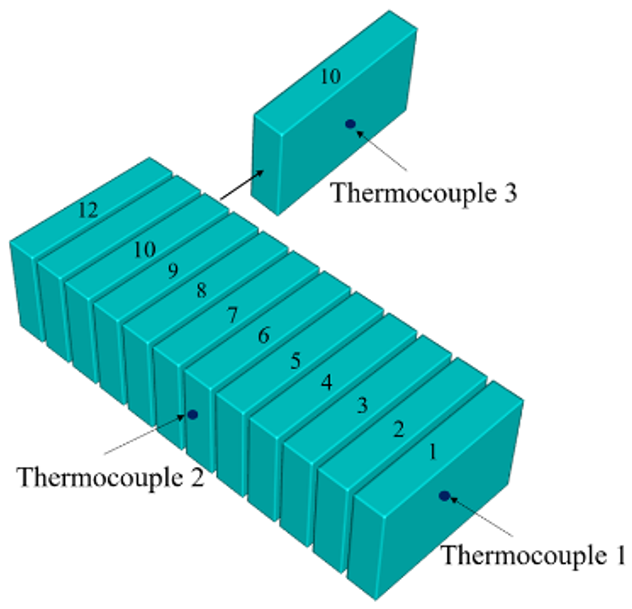
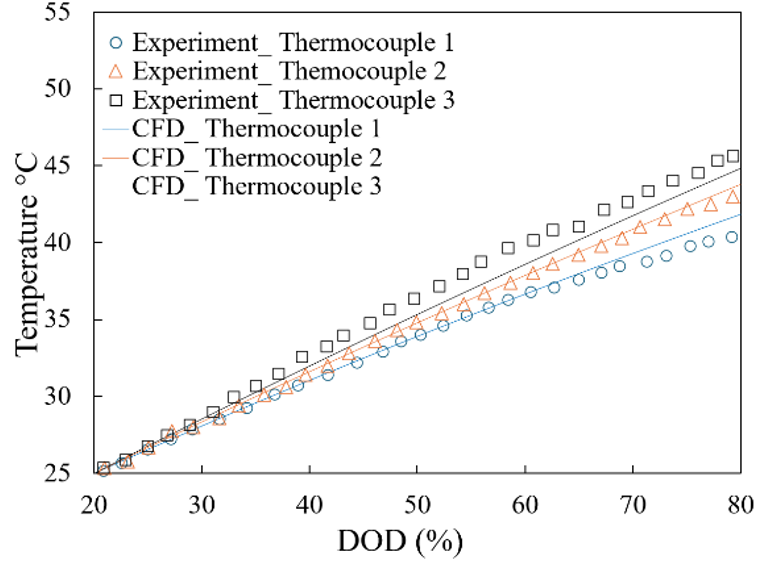
The present numerical model was validated against the experimental data reported by Akbarzadeh et al. [17]. The validation was conducted for a 12-cell prismatic battery module without an active cooling system under a 2C discharge condition from 80% to 20% SOC at an ambient temperature of 25 ℃. To ensure a consistent comparison, the numerical temperatures were evaluated at locations corresponding to the three thermocouples used in the experiment, as illustrated in Figure 4(a). Thermocouple 1 was positioned at the center of cell 1, Thermocouple 2 on the side surface of cell 6, and Thermocouple 3 at the center of cell 10. The predicted temperature profiles at these locations were then compared with the corresponding experimental measurements, as shown in Figure 4(b). The numerical predictions showed good agreement with the experimental measurements, with maximum temperature deviations of 1.45 ℃, 1.28 ℃, and 0.52 ℃ at Thermocouples 1, 2, and 3, respectively. These relatively small deviations indicate that the present numerical model can adequately reproduce the transient thermal behavior of the battery module.
3.1 Thermal performance
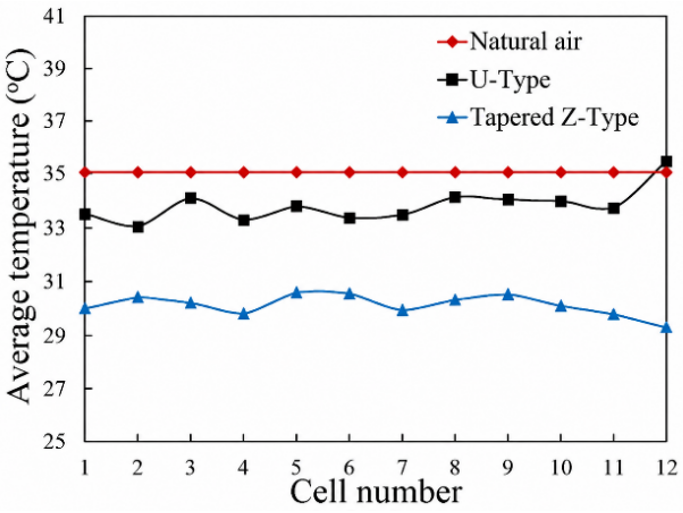
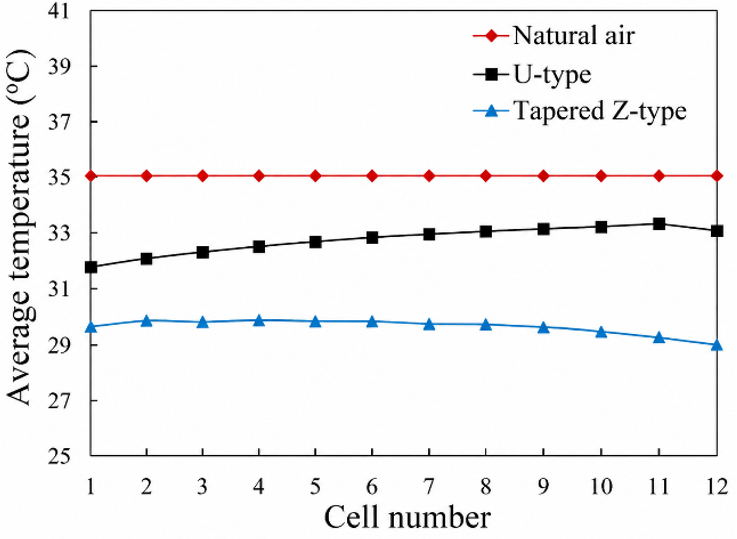
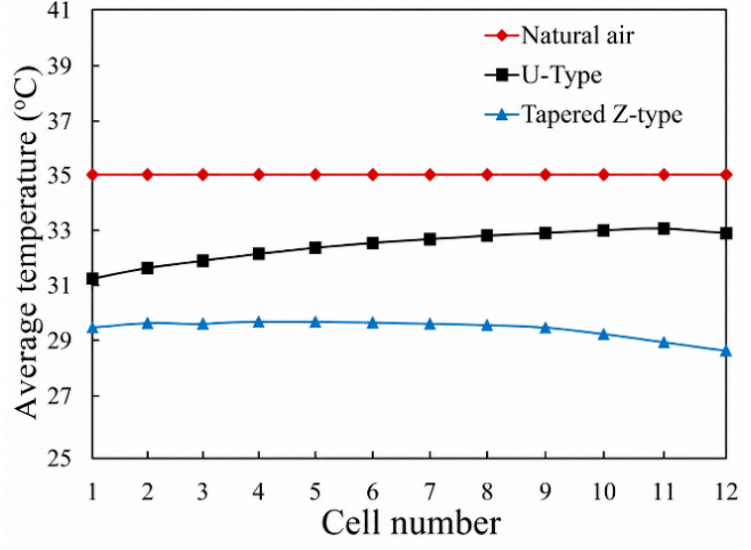
The average temperature distributions across the 12 battery cells were compared for the U-Type and tapered Z-Type configurations at airflow rates of 3, 9, and 15 L/s, with the natural-air condition serving as a reference, as shown in Figure 5. At 3 L/s, both forced-air configurations reduced the average cell temperatures relative to the natural-air condition (Figure 5(a)), with the tapered Z-Type configuration maintaining lower temperatures across all cells. Increasing the airflow rate to 9 L/s further reduced the average cell temperatures (Figure 5(b)). Under this condition, the U-Type configuration exhibited a gradual temperature increase toward the downstream cells, whereas the tapered Z-Type configuration maintained a comparatively stable temperature profile over most of the module. A similar trend was observed at 15 L/s (Figure 5(c)), with the tapered Z-Type configuration maintaining lower average cell temperatures throughout the module.
(a) 3 L/s
(b) 9 L/s
(c) 15 L/s
Figure 5. Average cell temperature distributions at different airflow rates
Overall, increasing the airflow rate enhanced the cooling performance of both configurations, while the tapered Z-Type configuration consistently provided lower average cell temperatures than the U-Type configuration over the investigated airflow-rate range.
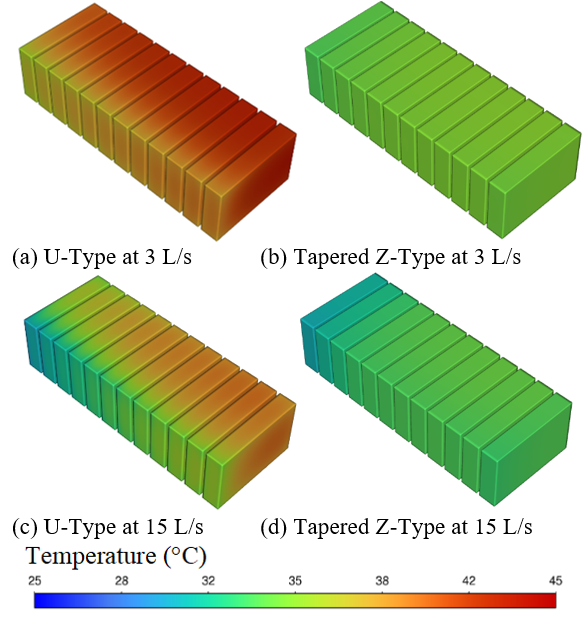
A distinct difference in the spatial temperature distribution is observed between the two cooling configurations. At an airflow rate of 3 L/s, the U-Type configuration exhibits a pronounced temperature gradient across the battery pack, whereas the tapered Z-Type configuration produces a more uniform temperature field, as shown in Figure 6(a) and (b). Increasing the airflow rate to 15 L/s reduces the overall cell temperatures in both configurations; however, a noticeable temperature gradient persists in the U-Type arrangement (Figure 6(c)). In contrast, the tapered Z-Type configuration maintains a more homogeneous temperature distribution with limited spatial variations, as shown in Figure 6(d). The improved thermal uniformity can be associated with the tapered flow passage, which promotes a more balanced airflow distribution and consequently reduces spatial variations in convective heat removal among the battery cells. Similar improvements have been reported for air-cooled battery packs employing tapered airflow passages, where enhanced downstream cooling reduced peak temperature and temperature non-uniformity, while optimization of a Z-Type battery cooling system using a tapered inlet manifold was also shown to improve airflow uniformity and thermal performance [12, 18]. These contour patterns are consistent with the thermal performance trends presented in Figure 5, further demonstrating the effectiveness of the tapered Z-Type configuration in enhancing temperature uniformity and suppressing localized high-temperature regions across the battery pack.
Figure 6. Temperature contours at different airflow rates
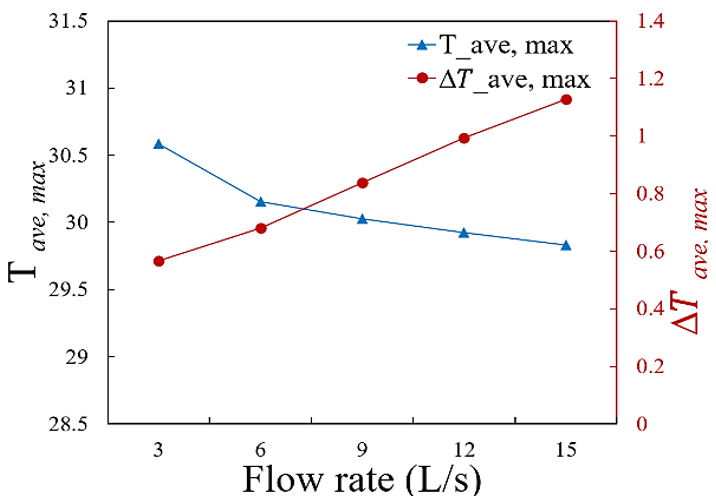
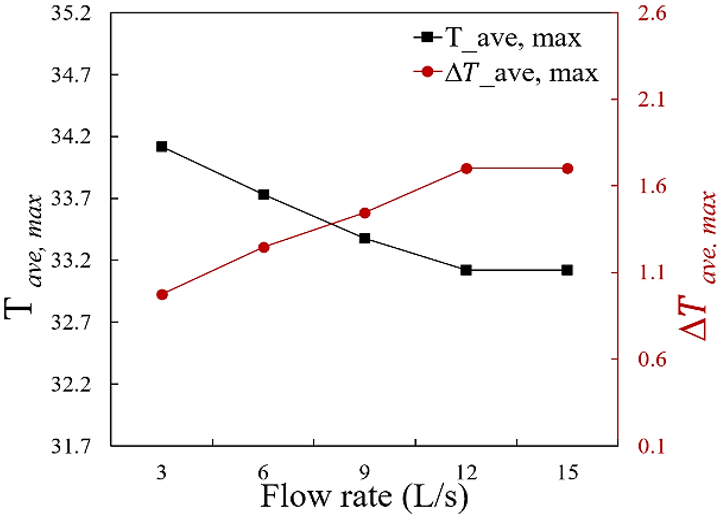
To distinguish various aspects of thermal performance, two temperature-based indicators are used. The maximum average cell temperature (Tave,max) is defined as the highest average temperature among the 12 battery cells and represents the most extreme thermal condition in the battery module. Meanwhile, the maximum difference in average cell temperature (ΔTave,max) is defined as the difference between the highest and lowest average cell temperatures and is used to characterize temperature non-uniformity among the battery cells. Thus, a lower Tave,max value indicates better cooling performance, while a lower (ΔTave,max) value indicates better temperature uniformity. Therefore, these two indicators represent two complementary aspects in evaluating the thermal performance of a battery module.
The influence of airflow rate on the maximum average cell temperature (Tave,max) and the maximum difference in average cell temperature (ΔTave,max) for the U-Type and tapered Z-Type configurations is presented in Figure 7. For both configurations, Tave,max decreases progressively as the airflow rate increases, demonstrating the beneficial effect of enhanced forced convection on heat removal from the battery module. For the U-Type configuration (Figure 7(a)), the reduction in Tave,max is most pronounced at lower airflow rates and becomes progressively smaller as the airflow rate increases. A similar trend is observed for the tapered Z-Type configuration (Figure 7(b)), where Tave,max decreases with increasing airflow rate and approaches a nearly constant value at the higher flow rates. In contrast, ΔTave,max generally increases with airflow rate in both configurations, indicating that the reduction in the maximum average cell temperature does not necessarily correspond to improved temperature uniformity. The increase in ΔTave,max becomes less pronounced at the higher airflow rates for the tapered Z-Type configuration. These results highlight a trade-off between reducing the maximum cell temperature and maintaining temperature uniformity, indicating that increasing airflow beyond a certain level provides progressively smaller thermal benefits while potentially increasing cell-to-cell temperature variation.
(a) U-Type
(b) Tapered Z-Type
Figure 7. Maximum cell temperature
Figure 7(a) demonstrates that the maximum temperature in the U-Type configuration decreases from 34.12 ℃ at 3 L/s to 33.12 ℃ at 15 L/s, whereas the tapered Z-Type shown in Figure 7(b) yields a consistently lower maximum temperature, ranging from 30.50 ℃ to 29.98 ℃. Across the entire flow rate range of 3–15 L/s, the maximum temperature of the tapered Z-Type was approximately 3.1-3.6 ℃ lower than that of the U-Type, indicating higher cooling efficiency. A similar trend was observed in the maximum difference in average cell temperature (ΔTave,max), with the tapered Z-Type yielding lower values across all tested flow rates. At 15 L/s, the ΔTave,max value for the tapered Z-Type was 1.25 ℃, compared to 1.70 ℃ for the U-Type. A lower ΔTave,max value indicates that improved airflow distribution contributes to more uniform heat dissipation among the battery cells. This trend is consistent with Gogoi et al. [19], who demonstrated that optimizing airflow distribution in air-based cooling systems can improve heat dissipation and temperature uniformity in battery modules. These quantitative results corroborate the temperature contour patterns shown in Figure 6 and indicate that the tapered Z-Type design is capable of producing lower maximum temperatures while maintaining better temperature uniformity compared to the U-Type design.
3.2 Airflow characteristics
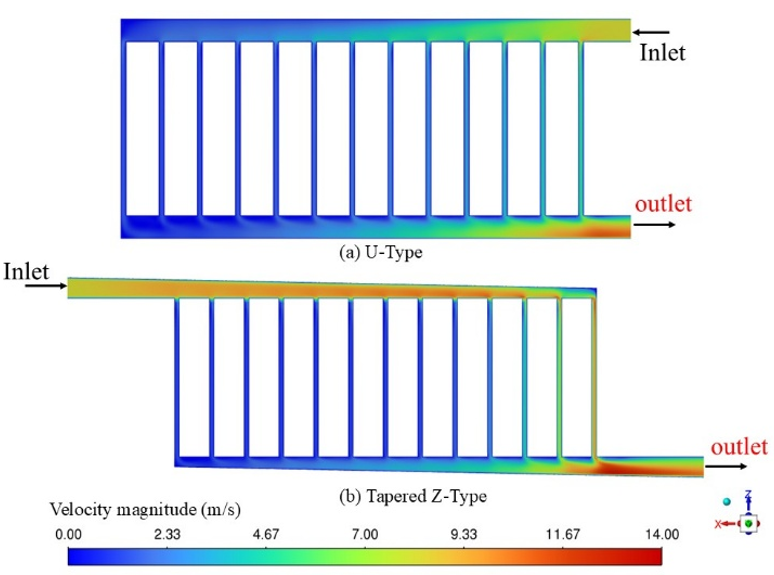
The differences in thermal performance between the two configurations are closely associated with the airflow distribution within the battery pack. To elucidate the underlying flow mechanism, the velocity magnitude distributions at an airflow rate of 15 L/s were examined for the U-Type and tapered Z-Type configurations. This comparison provides insight into how the manifold geometry influences the spatial distribution of cooling air and, consequently, the thermal behavior of the battery cells.
Figure 8. Velocity magnitude contours at 15 L/s
A pronounced dependence of the velocity field on the manifold configuration is observed at an airflow rate of 15 L/s. In the U-Type configuration, the velocity magnitude varies considerably along the inlet and outlet manifolds, with higher velocities concentrated near the inlet and outlet regions and substantially lower velocities toward the opposite end of the manifold, as shown in Figure 8(a). This pattern indicates a strongly non-uniform flow field and unequal airflow delivery among the cooling passages. In contrast, the tapered Z-Type configuration exhibits a more progressive redistribution of velocity along the manifold, with the tapered geometry maintaining relatively higher flow velocities over a larger portion of the inlet manifold, as shown in Figure 8(b). Although local velocity variations remain, particularly near the downstream turning and outlet regions, the modified manifold geometry alters the spatial distribution of the cooling airflow and reduces the extent of the low-velocity region observed in the U-Type configuration. This redistribution promotes more consistent convective cooling across the battery pack and is consistent with the more homogeneous temperature field observed for the tapered Z-Type configuration in Figure 6(d). Overall, the velocity contours demonstrate that the improved thermal uniformity is associated not merely with the imposed airflow rate, but also with the manner in which the manifold geometry redistributes the cooling air within the battery pack.
3.3 Cooling performance and power consumption
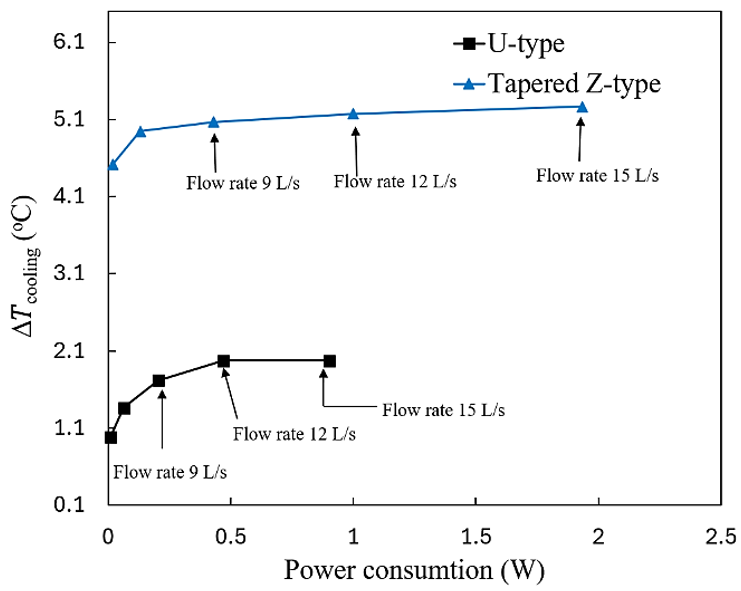
The practical effectiveness of an air-cooled BTMS depends not only on its ability to reduce battery temperature but also on the power required to sustain the cooling airflow. Accordingly, cooling performance and power consumption were evaluated simultaneously over the investigated flow-rate range to determine how the thermal benefit and energy requirement vary with operating condition. This combined assessment provides a comprehensive basis for comparing the overall performance of the U-Type and tapered Z-Type configurations.
Figure 9. Cooling performance as a function of power consumption
The relationship between cooling performance and airflow rate exhibits different characteristics in the two configurations. As the airflow rate increases, the ΔTcooling value increases in both configurations, but the tapered Z-Type consistently produces a greater temperature drop than the U-Type across the entire airflow rate range of 3–15 L/s, as shown in Figure 9. In the U-Type, ΔTcooling increases from 0.98 ℃ at 3 L/s to approximately 1.98 ℃ at 12 L/s, then remains relatively constant up to 15 L/s. In contrast, the tapered Z-Type showed a continuous increase in ΔTcooling from 4.51 ℃ at 3 L/s to 5.26 ℃ at 15 L/s. This difference in trends indicates that an increase in flow rate for the U-Type begins to provide only limited additional cooling at high flow rates, whereas the tapered Z-Type continues to show an increasing cooling response up to the highest tested flow rate. Thus, the tapered Z-Type still has the potential for improved cooling performance at higher flow rates, although conditions above 15 L/s require further testing. At 15 L/s, the temperature reduction for the tapered Z-Type reached 5.26 ℃, while that for the U-Type was only 1.98 ℃.
Overall, the research results show that the advantages of the tapered Z-Type are determined not only by its ability to reduce battery temperature, but also by the relationship between airflow distribution and thermal characteristics within the battery pack. The more even air distribution in the tapered configuration results in more uniform intercell cooling, as evidenced by lower maximum temperatures and temperature differences, as well as a higher ΔTcooling value compared to the U-Type. This relationship between airflow distribution and temperature uniformity is consistent with previous research showing that optimizing airflow paths in air-cooled BTMS systems can improve heat dissipation and battery temperature uniformity [20, 21]. The consistency among the flow characteristics, temperature distribution, and cooling performance in this study indicates that modifications to the manifold geometry play a crucial role in improving the utilization of cooling air. The overall results show that the tapered Z-Type provides more favorable thermo-fluid characteristics than the U-Type across the range of operating conditions analyzed. These findings underscore the potential of manifold geometry optimization as an approach to improving cooling effectiveness while maintaining temperature uniformity in air-cooled BTMSs.
This study numerically analyzed the thermal performance and airflow distribution in U-Type and tapered Z-Type configurations for a 12-cell prismatic LIB pack. Under the investigated operating conditions, the tapered Z-Type configuration yields better cooling performance and temperature uniformity compared to the U-Type. An increase in airflow rate enhances the temperature drop due to cooling (ΔTcooling) in both configurations. However, the tapered Z-Type consistently produces a greater temperature drop across the entire flow rate range of 3–15 L/s. For the U-Type, ΔTcooling increases from 0.98 ℃ at 3 L/s to 1.98 ℃ at 12 L/s, then remains relatively constant up to 15 L/s. In contrast, for the tapered Z-Type, ΔTcooling continued to increase from 4.51 ℃ at 3 L/s to 5.26 ℃ at 15 L/s. These results indicate that an increase in airflow rate in the U-Type provides a progressively smaller cooling benefit at higher flow rates, whereas the tapered Z-Type continues to show improved cooling performance up to 15 L/s. Overall, within the specific battery geometry and operating conditions investigated in this study, the tapered Z-Type exhibited improved thermal performance relative to the U-Type. However, the findings of this study are limited to the geometry of the 12-cell prismatic battery pack examined, the airflow rates range of 3–15 L/s, the specified heat generation conditions, and the numerical assumptions used in the CFD model. Therefore, the performance improvements observed should not be generalized to battery packs with significantly different geometries or operating conditions. Future research should include experimental verification of the numerical results obtained in this study.
The authors gratefully acknowledge the financial support provided by the Direktorat Penelitian dan Pengabdian kepada Masyarakat (DPPM), Direktorat Jenderal Riset dan Pengembangan, Kementerian Pendidikan Tinggi, Sains dan Teknologi (Grant No.: 134/C3/DT.05.00/PL-MULTITAHUNLANJUTAN/2026).
|
SOC |
state of charge |
|
BTMS |
battery thermal management system |
|
CFD |
computational fluid dynamics |
|
LIB |
lithium-ion battery |
|
Greek symbols |
|
|
ε |
turbulent kinetic energy dissipation rate, m2·s-3 |
|
μ |
dynamic viscosity, Pa s |
|
μt |
turbulent viscosity, Pa s |
|
ρ |
fluid density, kg m-3 |
|
v |
velocity vector, m/s |
|
T |
temperature, K |
|
Subscripts |
|
|
t |
turbulent |
[1] Moghadasi, M., Zarnoush, M., Esmaeilion, F., Radman, G., Soltani, M. (2025). Advancements and challenges in battery thermal management technologies for electric vehicles; A systematic navigation on the latest trends. Results Engineering, 27: 105830. https://doi.org/10.1016/j.rineng.2025.105830
[2] Zhang, H., Zhang, Y.F., Tian, Y., Xie, P., Tao, Z.Y. (2024). Research on temperature non-uniformity of large-capacity pouch lithium-ion batteries: Modeling, analysis, and optimization. Journal of Energy Storage, 101: 113768. https://doi.org/10.1016/j.est.2024.113768
[3] Peng, X.B., Cui, X.J., Liao, X.P., Garg, A. (2020). A thermal investigation and optimization of an air-cooled lithium-ion battery pack. Energies, 13(11): 2956. https://doi.org/10.3390/en13112956
[4] Wang, M.W., Hung, T.C., Xi, H. (2021). Numerical study on performance enhancement of the air-cooled battery thermal management system by adding parallel plates. Energies, 14(11): 3096. https://doi.org/10.3390/en14113096
[5] Zhao, G., Wang, X.L., Negnevitsky, M., Zhang, H.Y. (2021). A review of air-cooling battery thermal management systems for electric and hybrid electric vehicles. Journal of Power Sources, 501: 230001. https://doi.org/10.1016/j.jpowsour.2021.230001
[6] Shen, X.Y., Cai, T.N., He, C.M., Yang, Y., Chen, M. (2023). Thermal analysis of modified Z-shaped air-cooled battery thermal management system for electric vehicles. Journal of Energy Storage, 58: 106356. https://doi.org/10.1016/j.est.2022.106356
[7] Zhang, F.R., Liu, P.W., He, Y.X., Li, S.Y. (2022). Cooling performance optimization of air cooling lithium-ion battery thermal management system based on multiple secondary outlets and baffle. Journal of Energy Storage, 52: 104678. https://doi.org/10.1016/j.est.2022.104678
[8] Lazim, A.A., Ismael, M.A. (2024). Cooling of lithium-ion battery pack using different configurations of flexible baffled channels. Heat Transfer, 53(3): 1267-1291. https://doi.org/10.1002/htj.22991
[9] Huang, D., Huang, S. (2024). Optimization design and thermodynamic analysis of thermal management system for new energy vehicle power batteries. International Journal of Heat Technology, 42(1): 253-262. https://doi.org/10.18280/ijht.420126
[10] Yang, H.Z., Wang, Z.H., Li, M.X., Ren, F.S., Feng, Y. (2023). A manifold channel liquid cooling system with low-cost and high temperature uniformity for lithium-ion battery pack thermal management. Thermal Science and Engineering Progress, 41: 101857. https://doi.org/10.1016/j.tsep.2023.101857
[11] Ma, R.X., Ren, Y.M., Wu, Z., Xie, S.W., Chen, K., Wu, W.X. (2022). Optimization of an air-cooled battery module with novel cooling channels based on silica cooling plates. Applied Thermal Engineering, 213: 118650. https://doi.org/10.1016/j.applthermaleng.2022.118650
[12] Ko, J., Kim, J.H., Kang, C. (2026). Enhancement of the cooling performance for a U-type air-cooled lithium-ion battery pack through inclined manifolds. Heat and Mass Transfer, 62(4): 30. https://doi.org/10.1007/s00231-026-03649-w
[13] Akbarzadeh, M., Kalogiannis, T., Jaguemont, J., et al. (2020). Thermal modeling of a high-energy prismatic lithium-ion battery cell and module based on a new thermal characterization methodology. Journal of Energy Storage, 32: 101707. https://doi.org/10.1016/j.est.2020.101707
[14] Akbarzadeh, M., Kalogiannis, T., Jin, L., Karimi, D., Van Mierlo, J., Berecibar, M. (2022). Experimental and numerical thermal analysis of a lithium-ion battery module based on a novel liquid cooling plate embedded with phase change material. Journal of Energy Storage, 50: 104673. https://doi.org/10.1016/j.est.2022.104673
[15] Panchal, S., Gudlanarva, K., Tran, M.K., et al. (2022). Numerical simulation of cooling plate using k-epsilon turbulence model to cool down large-sized graphite/LiFePO4 battery at high C-rates. World Electric Vehicle Journal, 13(8): 138. https://doi.org/10.3390/wevj13080138
[16] Kaushik, P., Sharma, M., Sharma, S., Daniels, R.K. (2026). Numerical investigation of flow routing arrangements and vent geometry effects on thermal runaway propagation in air-cooled lithium-ion battery modules. Journal of Energy Storage, 180: 124188. https://doi.org/10.1016/j.est.2026.124188
[17] Akbarzadeh, M., Kalogiannis, T., Jaguemont, J., et al. (2021). A comparative study between air cooling and liquid cooling thermal management systems for a high-energy lithium-ion battery module. Applied Thermal Engineering, 198: 117503. https://doi.org/10.1016/j.applthermaleng.2021.117503
[18] Kwon, H.J., Son, Y.W., Yun, S.T., Kim, J. (2026). Topology optimization of air-cooled battery thermal management systems for uniform temperature distribution in lithium-ion battery modules. Journal of Energy Storage, 152: 120756. https://doi.org/10.1016/j.est.2026.120756
[19] Gogoi, B., Deka, H., Sharma, P., et al. (2025). Maximizing efficiency: Exploring the crucial role of ducts in air-cooled lithium-ion battery thermal management. Journal of Thermal Analysis and Calorimetry, 150(5): 3121-3138. https://doi.org/10.1007/s10973-024-13883-1
[20] Lee, G.H., Yeom, D.Y., Kim, G.H., Jang, S. (2025). Study on the cooling performance by cooling air channel design for air-cooled HEV battery pack. International Journal of Automotive Technology, 26(2): 415-435. https://doi.org/10.1007/s12239-024-00180-x
[21] Ye, J.G., Zhang, C.T., Zheng, W.G., Chen, J.F., Qin, J.R., Peng, Z.H. (2025). Numerical simulation of airflow distribution in battery pack cooling systems with optimized channel design. Heat and Mass Transfer, 61(7): 60. https://doi.org/10.1007/s00231-025-03578-0