Zhazira Zhumatayeva | Turganaliev Saken | Zhandos Mukaliyev* | Roslan Ismail
© 2026 The authors. This article is published by IIETA and is licensed under the CC BY 4.0 license (http://creativecommons.org/licenses/by/4.0/).
OPEN ACCESS
This study assesses the spatial patterns of modeled environmental sensitivity in Eastern Kazakhstan using the Mediterranean Desertification and Land Use (MEDALUS) framework integrated with satellite remote sensing and cloud-based geospatial analysis. Four composite indices were calculated: the Soil Quality Index (SQI), Vegetation Quality Index (VQI), Climate Quality Index (CQI), and Management Quality Index (MQI). Twenty indicators derived from remote sensing products, climate datasets, soil databases, and socio-economic spatial data were integrated to generate the Environmental Sensitivity Area (ESA) index. The results demonstrate clear spatial differentiation of modeled environmental sensitivity across Eastern Kazakhstan. Mountainous and forested landscapes of the Altai region show relatively lower sensitivity levels, whereas intermontane depressions and steppe lowlands exhibit higher sensitivity classes associated with differences in climate conditions, vegetation characteristics, soil properties, and landscape structure. Correlation analysis indicates strong statistical associations of VQI and CQI with ESA spatial variability, while SQI contributes substantially to sensitivity patterns in mountainous and foothill areas. MQI demonstrates more localized associations in areas affected by mining, urban development, and transport infrastructure. The findings demonstrate the applicability of integrated geospatial approaches for regional-scale environmental sensitivity assessment and provide spatial information to support sustainable land management planning in Eastern Kazakhstan.
Climate Quality Index, ecological vulnerability, Environmental Sensitivity Area, land degradation, Mediterranean Desertification and Land Use, remote sensing, sustainable land management
Land degradation is one of the major environmental challenges affecting the stability and productivity of terrestrial ecosystems. Its impacts are particularly pronounced in arid, semi-arid, and dry sub-humid regions, where limited water availability, climatic variability, and increasing human pressure can substantially reduce the capacity of landscapes to recover from disturbance. These dryland environments occupy approximately 41% of the Earth’s terrestrial surface [1]. Desertification, generally understood as land degradation resulting from the interaction between climatic variations and human activities, remains an important concern for environmental management and sustainable development [2]. Global estimates of degraded land vary considerably, ranging from about 1 billion to more than 6 billion hectares depending on the assessment approach and criteria used [3]. Continued degradation may also lead to socio-economic consequences, including reduced agricultural productivity, increasing pressure on food systems, and higher costs of land restoration [4].
The problem is especially important because approximately 2.5 billion people live in arid and semi-arid regions [5]. Many of these populations depend directly on land resources for agriculture, livestock production, and ecosystem services. When natural environmental constraints are combined with intensive land use, the sensitivity of soils and vegetation to disturbance may increase considerably [6]. Therefore, reliable identification of environmentally sensitive areas is essential for prioritizing monitoring activities, restoration measures, sustainable grazing strategies, and ecosystem conservation planning.
Central Asia is particularly exposed to these challenges. The region is characterized by a sharply continental climate, strong seasonal and interannual temperature variations, uneven precipitation distribution, and diverse landscapes ranging from deserts and dry steppes to forested mountain systems [7]. These environmental contrasts create substantial spatial differences in the sensitivity of land systems to degradation processes. In the eastern part of Central Asia, including the East Kazakhstan Region, this heterogeneity is further reinforced by pronounced altitudinal gradients, complex relief structures, and the coexistence of steppe, forest-steppe, foothill, and mountain ecosystems [8].
Land degradation sensitivity in the East Kazakhstan Region is influenced by a combination of natural and anthropogenic factors rather than by a single environmental component. Steppe and intermontane landscapes are affected by limited precipitation, drought conditions, and vegetation stress, whereas mountainous and foothill territories are characterized by the influence of relief, soil properties, erosion susceptibility, and vegetation variability. Agricultural lands and pastures are particularly important because their environmental condition is shaped by both climatic variability and land-use intensity [9]. At the same time, mining activities, settlement expansion, transport infrastructure, and other forms of economic development create localized anthropogenic pressures. The coexistence of strong natural gradients and multiple human impacts makes East Kazakhstan Region a representative case study for testing integrated environmental sensitivity assessment approaches.
At the national level, Kazakhstan experiences various forms of land degradation associated with both natural processes and anthropogenic transformation. According to data reported by the Committee on Land Resources Management under the Ministry of Agriculture of the Republic of Kazakhstan, extensive territories are affected by wind and water erosion, mining-related disturbance, and industrial pollution [10]. Approximately 29.3 million hectares are reported to be affected by wind and water erosion, while about 24.5 million hectares have been disturbed by mining, mineral processing, and exploration activities. In addition, nearly 9.6 million hectares are influenced by pollution associated with industrial, energy, and defense-related activities [11]. These challenges are particularly relevant for East Kazakhstan, where agricultural land use and long-term industrial development occur within environmentally heterogeneous mountain, foothill, and steppe landscapes.
Climate variability represents another important component influencing environmental sensitivity. Kazakhstan has experienced recurrent drought events and significant fluctuations in temperature and precipitation. Between 2000 and 2016, six major drought events were recorded across the country, affecting more than half of its territory [12]. In East Kazakhstan Region, climatic effects vary considerably across elevation zones. Steppe and intermontane areas may experience moisture deficits and vegetation stress, while mountainous territories are influenced by changes in precipitation patterns, snowmelt processes, and erosion-related factors. These differences demonstrate the importance of integrated approaches that consider multiple environmental components rather than relying on a single indicator.
A wide range of approaches has been developed for assessing land degradation and ecological sensitivity, including vegetation-based indicators [13], climate and drought indices [14], soil-related assessments, and remote sensing techniques. Although these approaches provide valuable information, assessments based on individual indicators may not adequately represent the combined effects of soil conditions, vegetation characteristics, climate variability, and human management pressures. This limitation is especially important in environmentally heterogeneous regions such as East Kazakhstan, where different factors may contribute to spatial variations in environmental sensitivity.
The Mediterranean Desertification and Land Use (MEDALUS) framework provides an integrated approach for identifying Environmentally Sensitive Areas (ESAs). The method combines environmental and management indicators into composite quality indices, allowing territories to be differentiated according to their relative sensitivity to degradation processes. MEDALUS has been applied in various climatic and geographical settings and at different spatial scales [15]. However, most applications have been developed for Mediterranean, arid, and semi-arid environments, while its adaptation to complex mountain-steppe landscapes with strong altitudinal gradients, heterogeneous soils, and combined natural-anthropogenic pressures remains insufficiently explored.
Despite the increasing use of integrated geospatial approaches for land-sensitivity assessment, MEDALUS-based studies in Kazakhstan remain limited, particularly for mountain and forest-steppe environments. Previous studies have often focused on individual indicators or specific degradation processes, whereas comprehensive assessments combining soil conditions, vegetation dynamics, climate variability, and management-related pressures within a unified framework are still uncommon. Therefore, the main methodological contribution of this study is the adaptation of the MEDALUS framework for Eastern Kazakhstan through the integration of multi-source remote sensing products, climate datasets, soil information, and socio-economic spatial indicators within a reproducible geospatial workflow. The use of Google Earth Engine (GEE) provides an efficient cloud-based environment for processing large and heterogeneous datasets and improving the reproducibility of regional-scale assessments [16].
To address this gap, the present study applies the MEDALUS framework to the Eastern Kazakhstan Region using multi-source remote sensing, climatic, soil, and socio-economic spatial data. Four composite indices are evaluated: the Soil Quality Index (SQI), Vegetation Quality Index (VQI), Climate Quality Index (CQI), and Management Quality Index (MQI). These components are integrated into the ESA index to characterize spatial patterns of modeled environmental sensitivity.
The main objective of this study is to assess the spatial distribution of modeled environmental sensitivity in Eastern Kazakhstan through the integrated analysis of soil, vegetation, climate, and management conditions. The ESA assessment aims to identify areas with different levels of relative environmental sensitivity and provide geospatial information to support environmental monitoring and help identify areas requiring further investigation or management attention, grazing management, and conservation decision-making.
2.1 Study area
The study area is located in Eastern Kazakhstan and covers approximately 283,300 km², corresponding to about 10.4% of the territory of the Republic of Kazakhstan. It extends approximately from 47°30′ to 51°55′ N and from 79°00′ to 87°20′ E (Figure 1). The area borders the Russian Federation to the north and northeast and the People’s Republic of China to the east, while its southern and southwestern boundaries adjoin Abai and Almaty regions.
Figure 1. Map of the study area
The territory is characterized by pronounced geomorphological and altitudinal contrasts. Lowland plains and intermontane depressions coexist with the mountain systems of the Kazakh Altai, Southern Altai, Kalba Range, and Saur-Tarbagatai. Elevation ranges from approximately 54 m above sea level in the Zaysan Depression to 4,448 m at Mount Belukha. This vertical differentiation strongly influences local climatic conditions, soil-forming processes, vegetation patterns, and hydrological regimes.
The climate is sharply continental, with marked seasonal and altitudinal variability. Mean January temperatures generally range from -25 ℃ to -18 ℃, whereas mean July temperatures vary from approximately 18 ℃ to 25 ℃. Annual precipitation ranges from about 250–300 mm in steppe and semi-arid lowlands to 600–1,000 mm on windward mountain slopes. Orographic precipitation, seasonal snow accumulation, and snowmelt are therefore important controls on hydrological and erosion processes, particularly in mountainous areas.
The regional hydrographic network is dominated by the Irtysh River and its major tributaries, including the Bukhtarma, Ulba, Uba, Kurchum, and Narym rivers [17]. Lake Zaysan and the Bukhtarma and Ust-Kamenogorsk reservoirs are major components of the regional water system and influence water regulation, hydropower generation, and land-use patterns.
Soil and vegetation conditions vary considerably with altitude and landscape position. Chernozems and dark chestnut soils are widespread in steppe and lowland areas, whereas foothill and mountain landscapes contain mountain chernozems, meadow-steppe soils, mountain forest soils, mountain meadow soils, and shallow skeletal soils. Vegetation changes from steppe and forest-steppe communities at lower elevations to coniferous forests, subalpine and alpine meadows, and sparsely vegetated high-mountain areas. These natural gradients overlap with agricultural land, pastures, mining areas, settlements, and transport infrastructure, producing a spatially heterogeneous combination of natural and anthropogenic pressures. Such environmental heterogeneity makes Eastern Kazakhstan a representative region for evaluating environmental sensitivity using the MEDALUS framework, as the territory combines contrasting climatic conditions, diverse landscape units, and multiple forms of anthropogenic influence within a single assessment area.
2.2 Data sources and preprocessing
The assessment was based on multi-source spatial datasets representing soil properties, vegetation condition, climatic variability, land use and land cover (LULC), terrain characteristics, and anthropogenic pressure. The datasets were selected according to their ecological relevance within the MEDALUS framework and were grouped into four MEDALUS components: SQI, VQI, CQI, and MQI.
Because the original datasets differed in spatial resolution, acquisition methods, temporal coverage, and data structure, all input layers were transformed to a common coordinate reference system, spatially aligned, and harmonized to a final grid resolution of 500 m before integration. This spatial harmonization ensured consistency among heterogeneous datasets and enabled regional-scale comparison of environmental sensitivity patterns.
However, resampling all datasets to a common resolution introduces a certain degree of uncertainty. While the 500 m spatial scale reduces inconsistencies between datasets and is suitable for regional assessment, it may smooth local variations, particularly in mountainous areas with complex terrain, fragmented land cover, and heterogeneous land-use patterns. Therefore, the resulting ESA assessment should be interpreted as a regional-scale representation of modeled environmental sensitivity rather than a direct measurement of observed degradation conditions.
The 20 indicators were selected based on three criteria: their ecological relevance to land sensitivity in Eastern Kazakhstan, their compatibility with the four MEDALUS components, and the availability of spatially continuous datasets suitable for regional-scale analysis. Indicators commonly used in other MEDALUS applications were excluded when reliable region-wide data were unavailable, when their ecological information substantially overlapped with variables already included, or when their spatial resolution was incompatible with the regional assessment scale. The indicators were not assumed to be equally important in an ecological sense; rather, equal weighting was retained within the geometric-mean structure of MEDALUS to avoid introducing additional subjective weighting coefficients.
Multicollinearity among the 20 selected indicators was evaluated using the variance inflation factor (VIF), based on a spatially distributed sample of 15,000 raster cells (Linear Infrastructure Density (LI) was excluded from this diagnostic only, owing to complete linear dependency with other management indicators, but was retained in the MEDALUS framework). All retained indicators had VIF < 10, with the highest values observed for erosion resistance (ER; 8.60), drought resistance (DR; 6.98), and vegetation cover (VC; 5.18), indicating no severe multicollinearity (see Supplementary Table A1).
Data preprocessing, time-series aggregation, and part of the indicator calculation were performed in GEE, while final spatial analysis and cartographic visualization were carried out in ArcGIS Pro 3.4. The selected indicators collectively represent the principal environmental dimensions considered in the assessment: soil capacity and resistance, vegetation condition and stability, climatic stress, and anthropogenic pressure.
2.2.1 Soil data
Five soil-related variables were used to characterize soil-related environmental sensitivity within the MEDALUS framework: Soil Salinity (SS), Soil Texture (ST), Soil Depth (SD), Soil Water Capacity (SWC), and Soil Rainfall Erosivity (SRE).
ST, SD, and SWC were obtained from the International Soil Reference and Information Centre (ISRIC) soil information resources used in the original dataset preparation [18]. These variables were selected because they represent key soil properties affecting infiltration capacity, water retention, root development conditions, and the potential resistance of soils to erosion and moisture stress.
SS was represented by the Normalized Difference Salinity Index (NDSI), derived from multi-year (2003–2023) MODIS Terra surface reflectance imagery to characterize persistent, long-term salinity patterns [19].
Rainfall erosivity was represented by the R-factor, derived from a 32-year Kazhydromet precipitation record following the approach of Renard and Freimund [20], and included in SQI as an indicator of erosion-related sensitivity to rainfall intensity.
2.2.2 Vegetation data
Vegetation-related environmental sensitivity was characterized using four indicators: VC, DR, ER, and Fire Risk (FR). These indicators were selected because vegetation conditions influence ecosystem stability, surface protection, drought response, and the capacity of landscapes to recover from environmental disturbances.
VC was derived from MODIS Terra MOD13A1.061 16-day Normalized Difference Vegetation Index (NDVI) composites for 2003-2023. NDVI observations were aggregated for the growing season, and multi-year mean values were calculated to represent the long-term spatial distribution of VC and productivity conditions [21].
DR was assessed using the long-term Vegetation Health Index (VHI), which combines vegetation condition and thermal stress [22]; higher values indicate greater vegetation stability and lower sensitivity within the vegetation quality component.
ER was estimated from the combined spatial pattern of VC and terrain slope derived from the Shuttle Radar Topography Mission (SRTM) digital elevation model. Areas characterized by sparse VC and steep slopes were considered more sensitive because reduced surface protection may increase the potential for soil erosion processes [23].
FR was derived from vegetation condition, thermal characteristics, and historical fire occurrence. MODIS NDVI observations were combined with land-surface thermal information and the MCD64A1 burned-area dataset covering approximately two decades [24]. This indicator was included because fire disturbances can reduce vegetation stability, affect ecosystem recovery capacity, and increase environmental sensitivity, particularly in dry continental landscapes. The resulting layer represents spatial differences in long-term vegetation susceptibility to fire-related disturbance rather than observed degradation intensity.
2.2.3 Climate data
Long-term average values of key climatic variables, including precipitation (P), air temperature (T), potential evapotranspiration (PET), climatic water deficit (CWD), and solar radiation (SR), were derived from the global TerraClimate dataset for the most recent 20-year period using the GEE platform [25]. These variables were selected because they represent major climatic conditions affecting moisture availability, surface energy balance, and vegetation response within continental ecosystems.
Precipitation and CWD were included to characterize spatial differences in water availability and potential moisture stress. Air temperature and PET represent thermal conditions and atmospheric water demand, which influence ecosystem productivity and vegetation stability. SR was incorporated as an indicator of energy availability because it affects surface energy balance, evapotranspiration processes, and the potential intensity of vegetation water stress, particularly in dry and semi-arid landscapes.
The Aridity Index (AI) was calculated as the ratio of mean annual precipitation to mean annual P/PET [13]. All climatic variables were spatially classified according to MEDALUS sensitivity thresholds and used to generate thematic layers for the calculation of the CQI.
2.2.4 Land-use and land-cover data
LULC information was obtained from the GLAD Global Land Cover dataset based on multi-temporal Landsat observations [26]. The dataset covering the period 2000-2024 was generalized into major land-cover categories representing natural ecosystems, agricultural areas, and anthropogenically transformed surfaces.
LULC information was incorporated into the MQI because land-use patterns reflect differences in human influence and ecosystem management intensity. Natural land-cover types, including forests and relatively undisturbed ecosystems, generally represent areas with lower anthropogenic pressure, whereas intensively managed agricultural lands and transformed surfaces may demonstrate higher sensitivity due to increased human influence.
The LULC classes were assigned sensitivity scores according to their relative degree of disturbance and ecological resistance. The resulting LULC sensitivity layer was integrated into MQI to represent spatial differences associated with land-use characteristics and management conditions.
2.2.5 Anthropogenic pressure data
Four additional indicators were used to represent anthropogenic pressure: population density (PD), industrial density (ID), grazing pressure (GP), and LI. Together with LULC information, these indicators formed the MQI component. They were selected because human activities can modify landscape structure, influence ecosystem stability, and contribute to spatial differences in modeled environmental sensitivity.
PD was derived from the 2021 national population census of the Bureau of National Statistics of the Republic of Kazakhstan [27]. Settlement-level population records were spatially referenced, and a continuous PD surface was produced using kernel density estimation. This indicator represents the spatial distribution of human concentration and associated management pressure.
ID was included to characterize the spatial distribution of mining and industrial activities that may contribute to landscape transformation and localized anthropogenic disturbance. Information on mineral deposits and industrial facilities was compiled from archival geological materials, national mining information sources, OpenStreetMap, Google Maps, and Bing Maps [28]. Mining enterprises, ore-processing facilities, tailings areas, metallurgical facilities, and other industrial objects were identified through attribute analysis and visual interpretation and converted into an industrial-density surface.
LI was calculated from primary and secondary roads, railway lines, power transmission corridors, and related infrastructure. Vector datasets were compiled from archived topographic materials and publicly available spatial sources, including OpenStreetMap [29]. The indicator was incorporated into MQI because transportation and utility networks may influence landscape fragmentation, accessibility, and spatial patterns of human disturbance.
GP was estimated from the spatial distribution of livestock farms and pasture-use facilities. Farm locations were identified through visual interpretation of high-resolution satellite imagery available through Google Maps and Bing Maps [30]. Identification criteria included residential or operational farm buildings, livestock enclosures, water-supply facilities, and other infrastructure indicating potential livestock activity. The resulting locations were converted into a continuous spatial indicator representing relative GP.
2.3 Mediterranean Desertification and Land Use-based assessment
The MEDALUS framework was adapted to integrate the selected 20 indicators into a hierarchical environmental sensitivity assessment approach [31]. The indicators represent four main environmental components: soil conditions, vegetation characteristics, climatic constraints, and anthropogenic management pressures.
In accordance with the original MEDALUS concept, no additional expert-based weighting coefficients were introduced among the indicators. All variables within each quality component were considered as contributing factors rather than independent priority parameters. The geometric mean approach was applied because it allows the combined effect of multiple environmental constraints to be represented while reducing the influence of extreme values and avoiding subjective weighting assumptions.
All indicators were standardized into sensitivity scores and integrated into four composite quality indices: SQI, VQI, CQI, and MQI. The four indices were subsequently combined to calculate the ESA index, which represents the spatial distribution of modeled environmental sensitivity across Eastern Kazakhstan.
The methodological workflow included data acquisition, preprocessing, spatial harmonization, indicator standardization, sensitivity classification, calculation of composite quality indices, ESA integration, and statistical analysis (Figure 2).
Figure 2. Methodological framework of the Mediterranean Desertification and Land Use (MEDALUS)-based environmental sensitivity assessment
2.3.1 Indicator thresholds and sensitivity scores
Continuous indicators were classified into six sensitivity levels: very low, low, moderately low, moderately high, high, and very high. These classes corresponded to standardized sensitivity scores of 1.0, 1.2, 1.4, 1.6, 1.8, and 2.0, respectively. Thresholds were derived from the statistical distribution of each indicator within Eastern Kazakhstan and applied consistently to the harmonized raster layers.
The use of region-specific thresholds allows improved differentiation of spatial patterns within the study area by considering the environmental characteristics of Eastern Kazakhstan. However, such an approach also limits direct transferability to other geographical regions where climatic conditions, soil properties, and land-use structures may differ. Therefore, the obtained ESA classes should be interpreted as relative environmental sensitivity levels rather than universal degradation thresholds.
The direction of scoring depended on the ecological meaning of each variable. For indicators representing environmental resistance, including SD, SWC, VC, DR, ER, precipitation, and the P/PET AI, higher values were assigned lower sensitivity scores [32]. Conversely, increasing values of SS, rainfall erosivity, FR, air temperature, PET, CWD, SR, PD, ID, GP, and infrastructure density were associated with higher sensitivity scores. ST and LULC were treated as categorical indicators and were classified according to their relative ecological resistance and degree of anthropogenic transformation.
Threshold values and the corresponding standardized sensitivity scores used to classify all MEDALUS indicators for Eastern Kazakhstan are provided in Supplementary Table A2.
PD, ID, GP, and LI were normalized to a common 0-1 range before sensitivity classification. Applying the same normalized intervals to these anthropogenic indicators ensured comparability among variables and prevented differences in measurement units from influencing the sensitivity scores.
LULC was treated separately as a categorical variable. Sensitivity scores were assigned according to the relative ecological resistance and degree of anthropogenic transformation of each land-cover type (Supplementary Figure A1).
2.3.2 Soil Quality Index
The SQI integrates five indicators describing soil-related sensitivity: SS, ST, SD, SWC, and SRE. After converting the individual layers to standardized sensitivity scores, SQI was calculated using their geometric mean:
SQI = (SSs × STs × SDs × SWCs × SREs)1/5 (1)
where, SSs, STs, SDs, SWCs, and SREs denote the sensitivity scores for SS, ST, SD, SWC, and SRE, respectively.
This approach, applied consistently across all MEDALUS components (Section 2.3), ensures that each soil indicator contributes proportionally to the composite sensitivity value without additional weighting.
Higher SQI values indicate greater soil-related environmental sensitivity within the study region, reflecting less favorable combinations of soil properties and erosion-related conditions. The resulting SQI represents relative spatial differences in soil sensitivity rather than direct measurements of soil degradation status.
2.3.3 Vegetation Quality Index
The VQI integrates four vegetation-related indicators: VC, DR, ER, and FR. The index represents spatial differences in vegetation-related environmental sensitivity associated with VC conditions, drought response, surface protection capacity, and fire-related disturbance potential.
After conversion of the individual layers into standardized sensitivity scores, VQI was calculated using the geometric mean:
VQI = (VCs × DRs × ERs × FRs)1/4 (2)
where, VCs, DRs, ERs, and FRs are the standardized sensitivity scores of VC, DR, ER, and FR, respectively.
Lower VQI values indicate relatively lower vegetation-related environmental sensitivity, whereas higher values represent areas where vegetation conditions are more sensitive to climatic stress, erosion pressure, or disturbance factors.
The resulting VQI reflects modeled spatial sensitivity patterns of vegetation conditions rather than direct measurements of vegetation degradation.
2.3.4 Climate Quality Index
The CQI integrates six climatic variables representing moisture availability, atmospheric demand, and surface energy conditions: precipitation (P), air temperature (T), PET, AI, CWD, and SR. These variables were selected because they characterize the climatic constraints that influence vegetation stability and ecosystem sensitivity under continental environmental conditions.
After conversion of individual climatic layers into standardized sensitivity scores, CQI was calculated using the geometric mean:
CQI = (Ps × Ts × PETs × AIs× CWDs × SRs)1/6 (3)
where, Ps, Ts, PETs, AIs, CWDs, and SRs denote the sensitivity scores of precipitation, air temperature, PET, AI, CWD, and SR, respectively.
Lower CQI values indicate relatively lower climate-related environmental sensitivity, whereas higher values represent areas with stronger climatic constraints, including moisture limitation, increased atmospheric water demand, or higher energy stress.
The resulting CQI reflects modeled spatial patterns of climatic sensitivity within Eastern Kazakhstan and does not represent direct evidence of climate-induced land degradation.
2.3.5 Management Quality Index
The MQI represents the spatial distribution of anthropogenic pressure and land-use-related environmental sensitivity. Five indicators were included: LULC, PD, ID, GP, and LI. The index was calculated as:
MQI = (LULCs × PDs × IDs × GPs × LIs)1/5 (4)
where, LULCs is the land-use and land-cover sensitivity score, PDs is the population density sensitivity, IDs is the industrial density sensitivity score, GPs is the grazing pressure sensitivity score, and LIs is the linear-infrastructure sensitivity score.
The MQI reflects spatial differences associated with land-use transformation, settlement concentration, industrial activity, livestock-related pressure, and infrastructure development.
Lower MQI values indicate relatively lower anthropogenic sensitivity, whereas higher values represent areas with greater intensity of human influence within the study region. The resulting MQI should be interpreted as a modeled representation of management-related environmental sensitivity rather than a direct measurement of anthropogenic degradation.
2.3.6 Environmental Sensitivity Area index
The final ESA index was calculated by combining the four MEDALUS quality indices. SQI, VQI, and CQI represent the main environmental components related to soil, vegetation, and climatic conditions, whereas MQI represents anthropogenic and management-related factors. The four components were integrated using the geometric mean:
ESA = (SQI × VQI × CQI × MQI)1/4 (5)
where, ESA represents the integrated modeled environmental sensitivity of the landscape to land degradation and desertification.
The resulting raster provides a spatially explicit measure of environmental sensitivity across the study area. Lower ESA values indicate comparatively favorable and resilient environmental conditions, whereas higher values identify locations where adverse soil, vegetation, climatic, and/or management conditions coincide.
The ESA index should be interpreted as a regional-scale indicator of relative environmental sensitivity and not as a direct measurement or prediction of actual land degradation status. The assessment highlights spatial patterns and priority areas for further monitoring, validation, and sustainable land-management planning.
2.3.7 Correlation analysis
To assess the contribution of individual MEDALUS components to the integrated environmental sensitivity pattern, Pearson correlation analysis was performed between the ESA index and its four component indices: SQI, VQI, CQI, and MQI. Correlation coefficients were calculated using harmonized spatial layers and summarized in a correlation matrix.
The analysis was applied to evaluate the strength and direction of statistical associations between the final ESA index and the component indices and to identify which components showed the strongest contribution to the spatial variability of modeled environmental sensitivity.
Because the ESA index is mathematically derived from SQI, VQI, CQI, and MQI, these correlations do not represent independent evidence of causal relationships. Therefore, the correlation results were interpreted as a component contribution assessment and evaluation of spatial association rather than as identification of independent degradation drivers.
2.3.8 Complementary consistency assessment using long-term NDVI trends
To provide a complementary consistency assessment of the ESA results, long-term vegetation dynamics were evaluated using NDVI trend analysis. Unlike the ESA index, which integrates soil, vegetation, climate, and management components within the MEDALUS framework, NDVI trend provides an additional satellite-based indicator of vegetation dynamics. However, NDVI is partially related to vegetation-related components included in VQI, particularly VC and DR, and therefore cannot be considered a fully independent validation dataset.
MODIS NDVI data (MOD13Q1, 250 m spatial resolution) were used for the period 2003-2023. Annual NDVI composites were generated, and a linear trend analysis was applied to identify areas with decreasing, stable, or increasing vegetation dynamics. The resulting NDVI trend layer was not included in the ESA calculation and was used only for evaluating the spatial consistency between modeled environmental sensitivity patterns and long-term vegetation changes.
The comparison between ESA classes and NDVI trends was interpreted as an assessment of spatial agreement between modeled sensitivity and vegetation dynamics. It was not considered direct validation of land degradation status, because NDVI represents vegetation responses only and does not include all soil, climatic, and anthropogenic factors incorporated into the ESA model. Therefore, the comparison was interpreted only as a consistency assessment between modeled sensitivity patterns and observed vegetation dynamics. It does not represent direct validation of the complete ESA model, particularly for soil, climate, and management components that are not directly captured by NDVI observations.
3.1 Spatial distribution of Mediterranean Desertification and Land Use component sensitivity indices
The MEDALUS-based assessment revealed pronounced spatial differences in soil, vegetation, climate, and management-related sensitivity across Eastern Kazakhstan. The resulting SQI, VQI, CQI, and MQI layers were grouped into five sensitivity classes to facilitate spatial interpretation. Although the conventional MEDALUS terminology retains the term “Quality Index” for these components, the standardized scores applied in this study are interpreted in terms of environmental sensitivity. Higher index values represent greater modeled environmental sensitivity, whereas lower values indicate lower modeled sensitivity.
3.1.1 Soil Quality Index
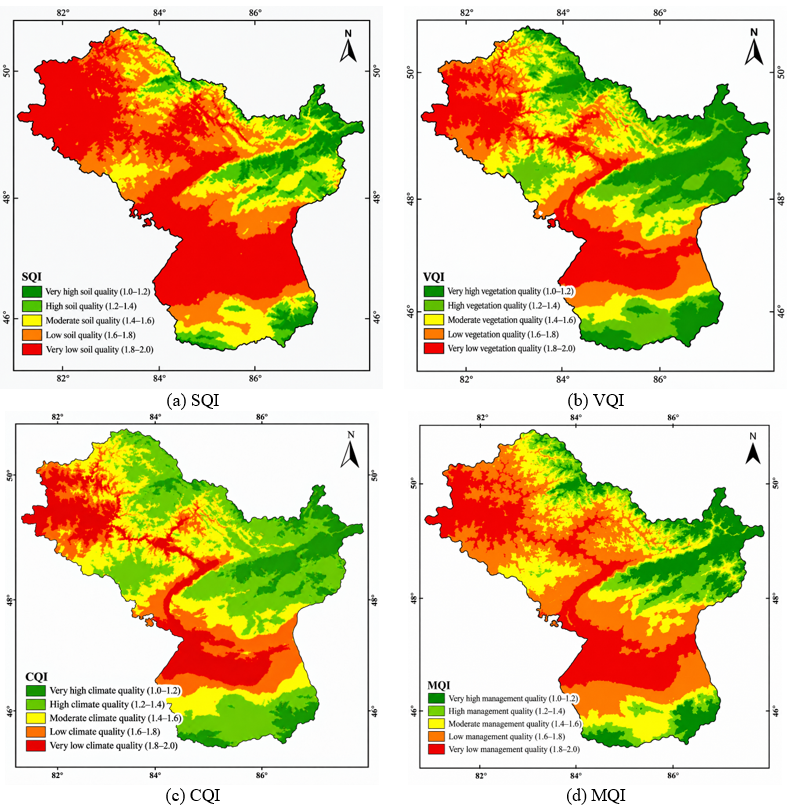
The spatial distribution of the SQI shows a clear contrast between mountainous and foothill landscapes and the lowland and intermontane parts of the study area (Figure 3(a)). The lowest soil sensitivity values are concentrated mainly in the Altai and Kalba mountain systems, where SQI values are generally within the range of approximately 1.0–1.3. These areas are characterized by comparatively deeper soils, lower salinity, greater water-holding capacity, and generally lower soil-related sensitivity according to the integrated MEDALUS indicators [33].
Moderate to higher soil sensitivity is more common in intermontane depressions, river valleys, and southern and western lowlands. In these areas, SQI values commonly increase to approximately 1.4–1.7. The spatial pattern reflects the combined effects of shallower soils, reduced water-holding capacity, unfavorable ST in some locations, salinity-related sensitivity, and rainfall erosivity.
Higher soil sensitivity classes occupy a more limited spatial extent and are concentrated in areas where several unfavorable soil characteristics coincide. Overall, the SQI map demonstrates a strong spatial association between soil sensitivity patterns and the geomorphological structure of the region.
Figure 3. Spatial distribution of the Mediterranean Desertification and Land Use (MEDALUS) component sensitivity indices across Eastern Kazakhstan: (a) Soil Quality Index (SQI); (b) Vegetation Quality Index (VQI); (c) Climate Quality Index (CQI); (d) Management Quality Index (MQI)
3.1.2 Vegetation Quality Index
The VQI demonstrates a pronounced spatial gradient associated with elevation, moisture availability, and vegetation type (Figure 3(b)). Lower VQI values are mainly observed in mountain forest ecosystems and relatively humid foothill areas. In these landscapes, VQI values generally range from 1.0 to 1.3, reflecting higher VC, greater DR, and lower modeled vegetation sensitivity.
Moderate vegetation sensitivity is widespread across transitional forest-steppe and steppe landscapes. These areas maintain relatively continuous VC but demonstrate increased sensitivity associated with limited moisture availability and seasonal climatic variability [34].
Higher VQI values, commonly ranging from approximately 1.4 to 1.7, occur mainly in steppe and semi-arid landscapes in the southern and western parts of the study area. These zones are characterized by lower VC, reduced DR, and increased fire-related sensitivity according to the applied MEDALUS classification scheme. Locally disturbed areas also demonstrate higher modeled vegetation sensitivity, resulting in a fragmented spatial pattern where anthropogenic influence overlaps with naturally sensitive vegetation conditions.
The obtained VQI distribution should therefore be interpreted as a spatial representation of modeled vegetation sensitivity rather than a direct measurement of vegetation degradation status.
3.1.3 Climate Quality Index
The CQI shows one of the clearest spatial gradients among the four MEDALUS components (Figure 3(c)). Lower CQI values are mainly observed in high-altitude mountain areas, where precipitation is relatively higher, and CWD is comparatively lower. In these areas, CQI values are generally below 1.3, indicating lower modeled climatic sensitivity.
In contrast, climatic sensitivity increases toward intermontane depressions and lowland steppe areas. These territories are characterized by lower precipitation, higher PET, and increased CWD, resulting in CQI values commonly ranging from approximately 1.4 to 1.6.
The highest climatic sensitivity is mainly concentrated in the driest lowland sectors. The overall CQI pattern demonstrates clear altitudinal differentiation, indicating that moisture availability and atmospheric water demand are strongly associated with the spatial distribution of modeled climatic sensitivity patterns across Eastern Kazakhstan.
3.1.4 Management Quality Index
The spatial pattern of the MQI differs noticeably from those of SQI, VQI, and CQI (Figure 3(d)). In contrast to the relatively continuous gradients observed for the natural components, MQI demonstrates a more localized and fragmented spatial distribution associated with variations in anthropogenic influence.
Large mountainous and sparsely populated territories are characterized by comparatively lower MQI values, reflecting lower modeled anthropogenic sensitivity. In contrast, higher MQI values are concentrated around urban and industrial centers, mining districts, transport corridors, intensively used agricultural areas, and locations with increased GP.
Areas with elevated MQI values generally range from approximately 1.4 to 1.8 and represent locations where multiple management-related sensitivity factors coincide, including higher PD, industrial activity, grazing intensity, and infrastructure concentration. Unlike the broader spatial patterns observed for climatic and vegetation components, management-related sensitivity is more spatially concentrated around specific human activity centers and transportation corridors.
The MQI results therefore highlight the spatial distribution of modeled anthropogenic sensitivity patterns rather than providing a direct assessment of human-induced land degradation.
3.2 Environmental Sensitivity Area assessment
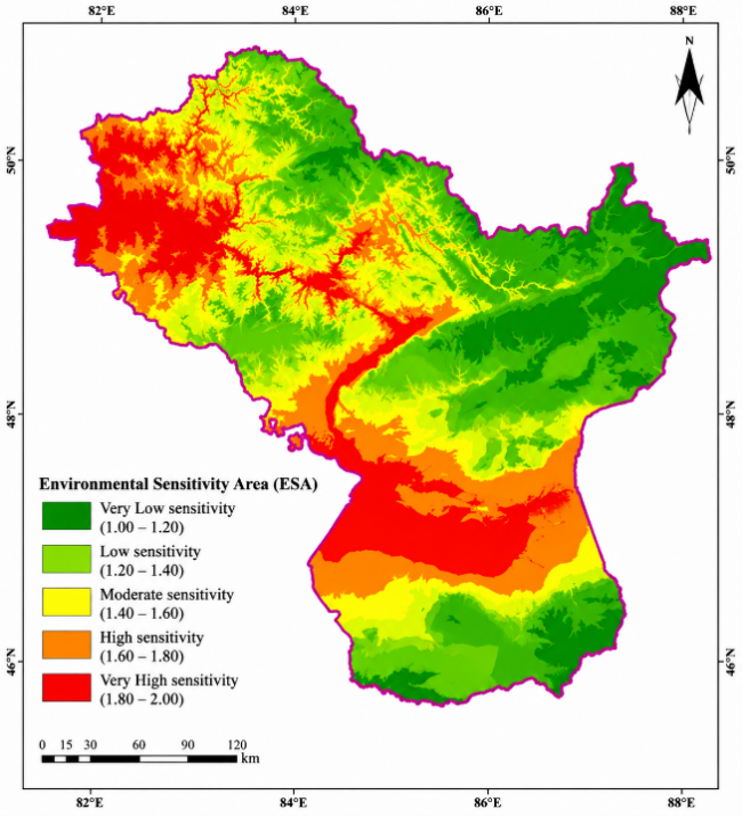
The ESA index integrates the four component indices and summarizes the combined influence of soil, vegetation, climate, and management conditions across the study area (Figure 4). The resulting ESA map represents modeled environmental sensitivity patterns rather than direct measurements of actual land degradation status.
Figure 4. Spatial distribution of the Environmental Sensitivity Area (ESA) index
The ESA map reveals a distinct spatial differentiation between lower and higher sensitivity landscapes across Eastern Kazakhstan. Very Low and Low environmental sensitivity classes dominate much of the mountainous and forested territory. These areas coincide with comparatively favorable soil conditions, stable vegetation characteristics, higher moisture availability, and generally limited anthropogenic pressure.
Moderate environmental sensitivity is widespread in foothill and steppe transition zones. These landscapes represent intermediate conditions where ecosystem resilience remains relatively higher, but sensitivity associated with climatic variability and land-use pressure becomes more pronounced.
High and Very High environmental sensitivity classes are mainly distributed in lowland areas, intermontane and arid basins, and locations where multiple unfavorable conditions coincide. These spatial patterns are associated with combinations of climatic constraints, reduced vegetation stability, soil limitations, and localized anthropogenic pressure.
The spatial distribution of ESA classes demonstrates that environmental sensitivity is not uniform across the region but forms distinct clusters related to differences in landscape structure, climate conditions, and human activity intensity.
The spatial distribution of ESA classes indicates that Very Low, Low, Moderate, High, and Very High sensitivity areas occupy approximately 20.8%, 24.6%, 22.5%, 18.8%, and 13.3% of the study area, respectively. These results provide a quantitative overview of the relative distribution of modeled environmental sensitivity within Eastern Kazakhstan.
The integrated ESA pattern indicates that natural environmental gradients are strongly associated with the regional distribution of environmental sensitivity, whereas anthropogenic factors contribute to increased sensitivity in localized areas.
3.3 Relationships between Environmental Sensitivity Area and component indices
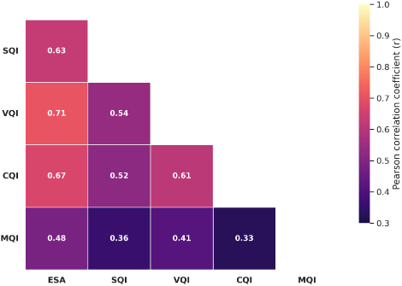
Pearson correlation analysis was used to quantify the relationships between the integrated ESA index and its four component indices (Figure 5). All four indices showed positive relationships with ESA, although the strength of these relationships differed substantially.
The strongest correlation was observed between ESA and VQI (r = 0.71), indicating a close statistical association between vegetation-related sensitivity and the overall pattern of environmental sensitivity. CQI showed the second strongest relationship with ESA (r = 0.67), demonstrating the important contribution of climatic conditions to the spatial variability of modeled environmental sensitivity.
SQI was also positively related to ESA (r = 0.63), indicating that soil-related sensitivity contributes substantially to the integrated ESA pattern. In comparison, MQI showed the weakest correlation with ESA (r = 0.48). This lower regional correlation is consistent with the more localized spatial distribution of anthropogenic sensitivity observed in the MQI map.
Taken together, the correlation results indicate that vegetation, climate, and soil components show stronger statistical associations with the broad regional pattern of ESA than the management component. However, these correlations should be interpreted as a contribution assessment of MEDALUS components rather than independent evidence of causal drivers, because ESA is mathematically derived from SQI, VQI, CQI, and MQI. The lower correlation of MQI does not imply that anthropogenic effects are negligible. Areas with elevated MQI values frequently coincide with locally sensitive landscapes, particularly around industrial and mining zones, settlements, transport corridors, and intensively used agricultural and pasture areas.
3.4 Comparison of Environmental Sensitivity Area with long-term Normalized Difference Vegetation Index trends
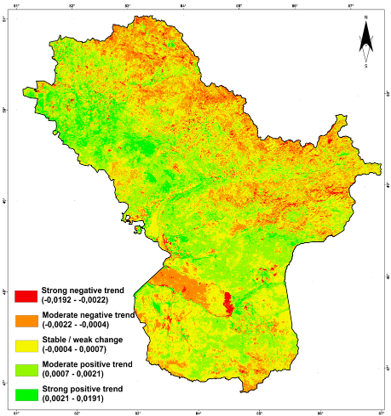
To provide an independent consistency assessment of the ESA results, the spatial distribution of modeled environmental sensitivity was compared with long-term NDVI trends (Figure 6).
Figure 6. Long-term Normalized Difference Vegetation Index (NDVI) trend in Eastern Kazakhstan during 2003-2023
The comparison between ESA classes and long-term NDVI trends demonstrated that areas with higher modeled environmental sensitivity generally coincided with regions characterized by weaker vegetation stability and declining NDVI trends. The strongest correspondence was observed in steppe lowlands, intermontane depressions, and areas affected by intensive land use. In contrast, mountainous forest ecosystems with lower ESA sensitivity generally showed stable or increasing vegetation dynamics.
The correspondence between higher ESA sensitivity classes and negative NDVI trends indicates consistency between the modeled environmental sensitivity pattern and long-term vegetation dynamics. However, this comparison does not represent direct validation of degradation processes, since NDVI reflects vegetation changes only and does not capture the complete set of soil, climate, and management factors included in the MEDALUS framework.
The obtained spatial patterns indicate that environmental sensitivity in Eastern Kazakhstan reflects the combined influence of a combination of pronounced natural gradients and spatially concentrated anthropogenic pressures. The clear contrast between relatively stable mountainous landscapes and more sensitive lowland and intermontane areas reflects the strong environmental heterogeneity of the region. This pattern is particularly important because the study area differs from the predominantly arid environments for which the MEDALUS framework was originally developed. Here, steppe, forest-steppe, mountain forest, alpine, agricultural, and industrial landscapes occur within the same regional system, creating substantial differences in the relative importance of soil, vegetation, climate, and management factors. The interpretation of these results should consider that the assessment represents a regional-scale model-based evaluation of environmental sensitivity and does not constitute direct field validation of degradation status.
The spatial pattern of SQI indicates that soil sensitivity is closely related to terrain and moisture conditions. Mountainous and foothill areas generally showed lower SQI values, whereas intermontane depressions and lowlands were more frequently associated with higher soil sensitivity. The combination of SD, water-holding capacity, texture, salinity, and rainfall erosivity therefore captures two contrasting degradation mechanisms. In relatively dry lowlands, reduced moisture availability and locally elevated salinity increase sensitivity, whereas in mountain environments the potential for rainfall-induced erosion becomes more important. The integrated index consequently provides a more balanced representation of soil-related environmental sensitivity than any individual soil indicator considered separately. This supports the use of multi-indicator approaches adopted in previous MEDALUS-based assessments.
Vegetation showed the strongest statistical association with the integrated ESA index. The correlation between VQI and ESA reached r = 0.71, while mountain forest and humid foothill landscapes generally exhibited lower VQI values than steppe and semi-arid areas. This spatial pattern is consistent with the role of vegetation as an important component associated with environmental conditions and landscape stability. Dense and persistent vegetation is generally associated with lower soil exposure and higher ER within landscapes where water availability is more favorable. In contrast, lower VC, reduced DR, and greater fire susceptibility increase the sensitivity of steppe and semi-arid landscapes. Previous remote-sensing research in eastern Kazakhstan has also demonstrated the usefulness of vegetation indices for detecting spatial differences in land condition and degradation. The present study extends this type of assessment by embedding vegetation information within a broader framework that also includes soil, climate, and anthropogenic pressure.
Climate represented another major component of regional environmental sensitivity. The relationship between CQI and ESA (r = 0.67) reflects the strong climatic gradient across the study area. Mountainous territories receive greater precipitation and generally experience lower CWD, whereas lowland and intermontane areas are characterized by stronger atmospheric moisture demand and increasing aridity. The correspondence between CQI and VQI patterns further suggests that vegetation stability is closely connected to regional moisture conditions. In this respect, the results agree with the basic premise of MEDALUS-based assessments, in which climatic constraints interact with soil and vegetation characteristics rather than acting as isolated drivers [35].
An important outcome of the analysis is the different spatial behavior of MQI. Its correlation with ESA (r = 0.48) was lower than those of VQI, CQI, and SQI, but this should not be interpreted as evidence of negligible anthropogenic influence. Unlike climate or topography, human pressure is not distributed continuously across the study area. Industrial activity, mining, settlement development, intensive grazing, and infrastructure are concentrated around particular locations and corridors. Consequently, MQI produces localized sensitivity clusters rather than a broad regional gradient. These areas become especially important where concentrated human pressure coincides with naturally sensitive lowland, steppe, or foothill environments. From a land-management perspective, such intersections between natural vulnerability and anthropogenic pressure are likely to be more relevant for targeted intervention than the regional mean level of MQI.
The integrated ESA map therefore highlights two complementary dimensions of environmental vulnerability. At the regional scale, sensitivity is primarily structured by topography, moisture availability, soil conditions, and vegetation stability. At the local scale, anthropogenic activities can increase modeled environmental sensitivity within this natural environmental framework. This distinction is useful for practical environmental management. Broad climatic and geomorphological gradients cannot be modified directly, but they can be used to identify landscapes in which land-use pressure should be managed more cautiously. In contrast, localized sources of pressure, including grazing intensity, mining activity, infrastructure expansion, and land-cover transformation, represent factors for which management measures can be spatially targeted.
The application of MEDALUS in eastern Kazakhstan also demonstrates the flexibility of the framework beyond its original Mediterranean context. Previous studies have applied MEDALUS and related ESA approaches in a range of arid, semi-arid, and environmentally sensitive regions [36]. The present study adapts the framework to a mountain-steppe environment characterized by strong altitudinal gradients and substantial landscape heterogeneity. The integration of 20 indicators enables the analysis to account for environmental processes that operate at different spatial scales, while the use of GEE facilitates the processing of long-term satellite and climatic datasets. This combination provides a reproducible basis for regional assessment and makes it possible to update individual indicators as new observations become available.
Nevertheless, several methodological limitations should be considered when interpreting the results. First, all input datasets were harmonized to a common spatial resolution of 500 m. This resolution is appropriate for regional analysis but may smooth small areas of degradation, narrow river valleys, localized industrial disturbances, and fragmented land-cover features. Second, the input datasets differ in their original spatial resolution, temporal coverage, and method of acquisition. Although harmonization improves comparability, it does not eliminate uncertainty inherited from the original sources. Third, the sensitivity thresholds used in the classification were adapted to the statistical distribution of indicator values within the study area. This improves regional differentiation but means that the resulting classes should be interpreted primarily in a regional rather than universal context.
Another limitation is that the present ESA assessment represents a static spatial characterization of environmental sensitivity based on the integrated conditions represented by the selected datasets. Although long-term NDVI trends were used to evaluate consistency with vegetation dynamics, the current study does not reconstruct temporal changes in ESA classes or quantify the expansion or contraction of sensitivity zones over time. In addition, climate-related temporal trends, such as changes in temperature, precipitation, or drought conditions, were not directly integrated into a time-series ESA framework. Developing such a dynamic assessment would require temporally consistent datasets for all MEDALUS components, including soil, vegetation, climate, and management indicators. Future research should therefore focus on multi-temporal ESA modelling combined with climate trend analysis to better characterize environmental sensitivity trajectories in Eastern Kazakhstan.
A further consideration concerns the interpretation of the correlation analysis. Because ESA is mathematically calculated from SQI, VQI, CQI, and MQI, the correlations between ESA and its component indices are not an independent validation of the model. Rather, they indicate the relative degree to which the spatial variability of each component corresponds to the final integrated pattern. Accordingly, the stronger correlations of VQI and CQI should be interpreted as evidence of their closer spatial association with ESA within the present model structure, rather than as proof of a causal effect. Independent validation using field observations, long-term records of documented degradation, or external land-condition datasets would provide a stronger test of model performance in future studies [37].
Despite these limitations, the combined spatial patterns of SQI, VQI, CQI, MQI, and ESA provide a coherent picture of environmental sensitivity across the study area. The results show that the most vulnerable landscapes are not determined by a single degradation factor but occur where several unfavorable conditions overlap. This is the principal advantage of the integrated MEDALUS approach for eastern Kazakhstan: it enables natural constraints and human pressures to be evaluated within the same spatial framework and provides a practical basis for prioritizing environmental monitoring, soil and vegetation conservation, pasture management, and more detailed assessment of areas exposed to concentrated industrial and infrastructure pressure.
This study demonstrates that the MEDALUS framework, combined with multi-source remote sensing and geospatial data, can effectively support the spatial differentiation of modeled environmental sensitivity in the heterogeneous mountain-steppe landscapes of eastern Kazakhstan. The integration of 20 indicators into the SQI, VQI, CQI, and MQI revealed clear spatial contrasts between relatively stable mountain environments and more sensitive lowland, intermontane, and locally disturbed landscapes.
The integrated assessment indicates that environmental sensitivity at the regional scale is strongly associated with vegetation condition, climatic constraints, and soil properties. Vegetation showed the closest spatial association with the ESA index (r = 0.71), followed by climate (r = 0.67) and soil conditions (r = 0.63). The weaker relationship between MQI and ESA (r = 0.48) reflects the spatially concentrated nature of anthropogenic pressure rather than its absence. Mining and industrial areas, transport corridors, intensively used agricultural land, and areas of increased GP form localized zones where human activity contributes to increased modeled environmental sensitivity.
The resulting ESA map provides a spatial basis for differentiating areas according to their relative environmental sensitivity levels. Mountainous and forested landscapes generally show lower modeled sensitivity, whereas steppe lowlands, intermontane basins, and areas where unfavorable natural factors coincide with intensive land use demonstrate higher modeled sensitivity. The assessment can therefore support the prioritization of environmental monitoring, soil and vegetation conservation, pasture management, and more detailed investigation of areas affected by industrial and infrastructure development [38].
Several limitations should be considered when applying the results. Harmonization of heterogeneous datasets to a 500 m spatial resolution may obscure small or spatially fragmented degradation features, while differences in the original spatial and temporal characteristics of the input datasets introduce additional uncertainty. Furthermore, the sensitivity thresholds were adapted to the statistical distribution of indicators within the study area and should therefore be interpreted primarily in a regional context [39]. The correlation analysis describes the spatial association of the component indices with ESA but does not constitute an independent validation because ESA is mathematically derived from SQI, VQI, CQI, and MQI.
Future research should focus on independent validation using field observations and documented land-degradation data, assessment of temporal changes in ESA, and evaluation of the sensitivity of the final results to alternative classification thresholds and spatial resolutions. Future studies should also extend the proposed framework toward multi-temporal ESA assessment by integrating historical MEDALUS components. Such an approach would allow the identification of expanding or decreasing sensitivity zones and provide a more dynamic understanding of environmental change in Eastern Kazakhstan. The integration of higher-resolution satellite data, longer environmental time series, and predictive modelling could further improve the identification of areas with elevated environmental sensitivity and strengthen the application of the MEDALUS framework for sustainable land management in Kazakhstan and other environmentally heterogeneous regions of Central Asia.
The authors express their gratitude to Dr. Roslan Bin Ismail of Universiti Putra Malaysia, Malaysia, an international scientific consultant for the doctoral research of Zhazira Zhumatayeva, for his valuable scientific consultations and constructive comments that contributed to the improvement of this study.
|
AI |
Aridity Index (P/PET), dimensionless |
|
CQI |
Climate Quality Index, dimensionless |
|
CWD |
Climatic water deficit, mm |
|
DR |
Drought resistance, dimensionless |
|
ER |
Erosion resistance, dimensionless |
|
ESA |
Environmental Sensitivity Area index, dimensionless |
|
FR |
Fire Risk, dimensionless |
|
GEE |
Google Earth Engine |
|
GP |
Grazing pressure, dimensionless after normalization |
|
ID |
Industrial density, dimensionless after normalization |
|
LI |
Linear infrastructure density, dimensionless after normalization |
|
LULC |
Land use and land cover |
|
MQI |
Management Quality Index, dimensionless |
|
NDSI |
Normalized Difference Salinity Index, dimensionless |
|
NDVI |
Normalized Difference Vegetation Index, dimensionless |
|
P |
Mean annual precipitation, mm y⁻¹ |
|
PD |
Population density, dimensionless after normalization |
|
PET |
Potential evapotranspiration, mm y⁻¹ |
|
r |
Pearson correlation coefficient, dimensionless |
|
SD |
Soil depth, mm |
|
SQI |
Soil Quality Index, dimensionless |
|
SRE |
Soil rainfall erosivity |
|
SR |
Solar radiation, W m⁻² |
|
SS |
Soil salinity indicator, dimensionless |
|
ST |
Soil texture |
|
SWC |
Soil water capacity, % |
|
T |
Air temperature, ℃ |
|
VC |
Vegetation cover, dimensionless |
|
VHI |
Vegetation Health Index, dimensionless |
|
VQI |
Vegetation Quality Index, dimensionless |
Table A1. VIF values of MEDALUS indicators included in the multicollinearity assessment
|
Indicator |
Component |
VIF |
|
ER |
VQI |
8.60 |
|
DR |
VQI |
6.98 |
|
VC |
VQI |
5.18 |
|
FR |
VQI |
3.20 |
|
SS |
SQI |
3.20 |
|
CWD |
CQI |
3.06 |
|
T |
CQI |
3.04 |
|
ID |
MQI |
2.96 |
|
AI |
CQI |
2.82 |
|
GP |
MQI |
2.77 |
|
LULC |
MQI |
2.76 |
|
SD |
SQI |
2.31 |
|
SRE |
SQI |
2.25 |
|
P |
CQI |
1.80 |
|
SWC |
SQI |
1.76 |
|
PET |
CQI |
1.36 |
|
ST |
SQI |
1.35 |
|
LI* |
MQI |
Not calculated |
Table A2. Threshold values and standardized sensitivity scores assigned to Mediterranean Desertification and Land Use (MEDALUS) indicators for Eastern Kazakhstan
|
Indicator |
Very Low (1.0) |
Low (1.2) |
Moderate Low (1.4) |
Moderate High (1.6) |
High (1.8) |
Very High (2.0) |
|
Soil Salinity (SS) |
-0.70 to -0.50 |
-0.50 to -0.30 |
-0.30 to -0.10 |
-0.10 to 0.10 |
0.10 to 0.30 |
0.30 to 0.60 |
|
Soil Texture (ST) |
Clay |
Clay loam |
Loam |
Sandy loam |
Loamy sand |
Sand |
|
Soil Depth (mm) |
>2000 |
1500–2000 |
1000–1500 |
700–1000 |
400–700 |
<400 |
|
Soil Water Capacity (%) |
>35 |
30–35 |
26–30 |
22–26 |
18–22 |
<18 |
|
Rainfall Erosivity (R) |
<200 |
200–300 |
300–400 |
400–500 |
500–600 |
>600 |
|
Vegetation Cover (VC) |
>0.60 |
0.48–0.60 |
0.40–0.48 |
0.30–0.40 |
0.20–0.30 |
<0.20 |
|
Drought Resistance (DR) |
>0.85 |
0.78–0.85 |
0.70–0.78 |
0.62–0.70 |
0.55–0.62 |
<0.55 |
|
Erosion Resistance (ER) |
>0.50 |
0.30–0.50 |
0.15–0.30 |
0.07–0.15 |
0.03–0.07 |
<0.03 |
|
Fire Risk (FR) |
<0.35 |
0.35–0.45 |
0.45–0.55 |
0.55–0.65 |
0.65–0.75 |
>0.75 |
|
Aridity Index (AI) |
>0.40 |
0.30–0.40 |
0.20–0.30 |
0.15–0.20 |
0.10–0.15 |
<0.10 |
|
Precipitation (mm/yr) |
>600 |
450–600 |
350–450 |
250–350 |
150–250 |
<150 |
|
Temperature (℃) |
<3 |
3–6 |
6–9 |
9–12 |
12–15 |
>15 |
|
PET (mm/yr) |
<850 |
850–950 |
950–1050 |
1050–1150 |
1150–1250 |
>1250 |
|
CWD (mm) |
<400 |
400–600 |
600–800 |
800–1000 |
1000–1200 |
>1200 |
|
Solar Radiation (W/m²) |
<145 |
145–155 |
155–165 |
165–175 |
175–185 |
>185 |
|
PD / ID / GP / LI |
0.00–0.20 |
0.20–0.35 |
0.35–0.50 |
0.50–0.65 |
0.65–0.80 |
0.80–1.00 |
Figure A1. Sensitivity scores assigned to land-use and land-cover classes
[1] Zhumatayeva, Z., Kuzairova, Z., Maulen, Z., Zhildikbayeva, A., Ismail, R.B. (2026). Development of a digital spatial framework for information-analytical mapping of the East Kazakhstan region. Izdenister Natigeler, 28(1(109)): 145-154. https://doi.org/10.37884/1-2026/15
[2] Kosmas, C., Kirkby, M.J., Geeson, N. (1999). The MEDALUS project: Mediterranean desertification and land use. Manual on Key Indicators of Desertification and Mapping Environmentally Sensitive Areas to Desertification. European Commission.
[3] Kosmas, C., Tsara, M., Moustakas, N., Karavitis, C. (2003). Identification of indicators for desertification. Annals of Arid Zone, 42(3-4): 393-416.
[4] Basso, F., Bove, E., Dumontet, S., et al. (2000). Evaluating environmental sensitivity at the basin scale through the use of geographic information systems and remotely sensed data: An example covering the Agri basin (Southern Italy). CATENA, 40(1): 19-35. https://doi.org/10.1016/S0341-8162(99)00062-4
[5] Jafari, R., Bakhshandehmehr, L. (2016). Quantitative mapping and assessment of environmentally sensitive areas to desertification in Central Iran. Land Degradation & Development, 27(2): 108-119. https://doi.org/10.1002/ldr.2227
[6] Rafikov, T., Zhumatayeva, Z., Mukaliyev, Z., Zhildikbayeva, A. (2024). Evaluating land degradation in East Kazakhstan using NDVI and Landsat data. International Journal of Design & Nature and Ecodynamics, 19(5): 1677-1686. https://doi.org/10.18280/ijdne.190521
[7] Ait Lamqadem, A., Pradhan, B., Saber, H., Rahimi, A. (2018). Desertification sensitivity analysis using MEDALUS model and GIS: A case study of the oases of Middle Draa Valley, Morocco. Sensors, 18(7): 2230. https://doi.org/10.3390/s18072230
[8] Ogbue, C., Igboeli, E., Ajaero, C., et al. (2024). Remote sensing analysis of desert sensitive areas using MEDALUS model and GIS in the Niger River Basin. Ecological Indicators, 158: 111404. https://doi.org/10.1016/j.ecolind.2023.111404
[9] Bakr, N., Weindorf, D.C., Bahnassy, M.H., El-Badawi, M.M. (2012). Multi-temporal assessment of land sensitivity to desertification in a fragile agro-ecosystem: Environmental indicators. Ecological Indicators, 15(1): 271-280. https://doi.org/10.1016/j.ecolind.2011.09.034
[10] Ladisa, G., Todorovic, M., Trisorio Liuzzi, G. (2012). A GIS-based approach for desertification risk assessment in Apulia region, SE Italy. Physics and Chemistry of the Earth, 49: 103-113. https://doi.org/10.1016/j.pce.2011.05.007
[11] Karamesouti, M., Panagos, P., Kosmas, C. (2018). Model-based spatio-temporal analysis of land desertification risk in Greece. CATENA, 167: 266-275. https://doi.org/10.1016/j.catena.2018.04.042
[12] Symeonakis, E., Karathanasis, N., Koukoulas, S., Panagopoulos, G. (2016). Monitoring sensitivity to land degradation and desertification with the environmentally sensitive area index: The case of Lesvos Island. Land Degradation & Development, 27(6): 1562-1573. https://doi.org/10.1002/ldr.2285
[13] Boudjemline, F., Semar, A. (2018). Assessment and mapping of desertification sensitivity with MEDALUS model and GIS-case study: Basin of Hodna, Algeria. Journal of Water and Land Development, 36: 17-26. https://doi.org/10.2478/jwld-2018-0002
[14] Bouabid, R., Rouchdi, M., Badraoui, M., Diab, A., Louafi, S. (2010). Assessment of land desertification based on the MEDALUS approach and elaboration of an action plan: The case study of the Souss River Basin, Morocco. In Land Degradation and Desertification: Assessment, Mitigation and Remediation. Springer, Dordrecht, pp. 131-145. https://doi.org/10.1007/978-90-481-8657-0_10
[15] Jiang, L.L., Bao, A.M., Jiapaer, G., et al. (2019). Monitoring land sensitivity to desertification in Central Asia: Convergence or divergence? Science of the Total Environment, 658: 669-683. https://doi.org/10.1016/j.scitotenv.2018.12.152
[16] Jiang, L.L., Jiapaer, G., Bao, A.M., et al. (2019). Monitoring the long-term desertification process and assessing the relative roles of its drivers in Central Asia. Ecological Indicators, 104: 195-208. https://doi.org/10.1016/j.ecolind.2019.04.067
[17] Lioubimtseva, E., Henebry, G.M. (2009). Climate and environmental change in arid Central Asia: Impacts, vulnerability, and adaptations. Journal of Arid Environments, 73(11): 963-977. https://doi.org/10.1016/j.jaridenv.2009.04.022
[18] Dubovyk, O., Ghazaryan, G., González, J., Graw, V., Löw, F., Schreier, J. (2019). Drought hazard in Kazakhstan in 2000-2016: A remote sensing perspective. Environmental Monitoring and Assessment, 191(8): 510. https://doi.org/10.1007/s10661-019-7620-z
[19] Loboda, T.V., Giglio, L., Boschetti, L., Justice, C.O. (2012). Regional fire monitoring and characterization using global NASA MODIS fire products in dry lands of Central Asia. Frontiers of Earth Science, 6(2): 196-205. https://doi.org/10.1007/s11707-012-0313-3
[20] Xu, D.Y., Kang, X.W., Qiu, D.S., Zhuang, D.F., Pan, J.J. (2009). Quantitative assessment of desertification using Landsat data on a regional scale-a case study in the Ordos Plateau, China. Sensors, 9(3): 1738-1753. https://doi.org/10.3390/s90301738
[21] Gao, J., Liu, Y.S. (2008). Mapping of land degradation from space: A comparative study of Landsat ETM+ and ASTER data. International Journal of Remote Sensing, 29(14): 4029-4043. https://doi.org/10.1080/01431160801891887
[22] Higginbottom, T.P., Symeonakis, E. (2014). Assessing land degradation and desertification using vegetation index data: Current frameworks and future directions. Remote Sensing, 6(10): 9552-9575. https://doi.org/10.3390/rs6109552
[23] Mukaliyev, Z., Zhumatayeva, Z., Janaliyeva, N. (2026). GIS-based assessment of soil erosion risk in a post-nuclear landscape: A morphometric approach using ALOS PALSAR DEM. E3S Web of Conferences, 727: 03002. https://doi.org/10.1051/e3sconf/202672703002
[24] Liu, J.P., Li, M.Z., Shalamzari, M.J., et al. (2026). A remote sensing-based early warning system for desertification: Monitoring spatiotemporal dynamics and identifying risk zones. Land Degradation & Development, 37(11): 6496-6515. https://doi.org/10.1002/ldr.70529
[25] Omodu, U.S., Wang, Y.D., Ogbue, C., et al. (2026). Quantifying land cover sensitivity to desertification in northern Nigeria's ecotones using an AHP-weighted MEDALUS model. Ecological Indicators, 188: 114880. https://doi.org/10.1016/j.ecolind.2026.114880
[26] Tounf, O., Ait Lamqadem, A., Saber, H., Bradhan, B. (2026). Assessing desertification sensitivity using a geospatial MEDALUS model in the Ziz Valley, southeastern Morocco. Spatial Information Research, 34: 29. https://doi.org/10.1007/s41324-026-00682-z
[27] Wu, Y.F., Xia, N., Zhao, J.J., Li, A.L., Tang, Y.Q. (2026). Fine-scale assessment of desertification risk in Tarim Populus euphratica national nature reserve based on RWEQ and MEDALUS models. Transactions of the Chinese Society of Agricultural Engineering, 42(9): 361-370. https://doi.org/10.11975/j.issn.1002-6819.202601025
[28] Zaidan, M., Al-Hadithi, M., Hatem, W.A., Abas, R.H.A., Massarwa, F.A. (2026). Application of MEDALUS model to assess the environmental sensitivity to desertification in Iraq: A review. AIP Conference Proceedings, 3379(1): 050065. https://doi.org/10.1063/5.0306433
[29] Abdelkarim, B., Dhaouadi, L., Msaddek, M.H., et al. (2026). Mapping desertification sensitivity in arid regions using MEDALUS-GIS-SVM. Earth Systems and Environment, 10(9): 11461-11478. https://doi.org/10.1007/s41748-026-01173-9
[30] Yousif, I.A.H., Sayed, A.S.A., Shokr, M.S., Rebouh, N.Y., Abd El-Hameed, H.H. (2026). Sustainable land management for food security: A geospatial analysis of desertification sensitivity and agricultural productivity in arid regions. Frontiers in Sustainable Food Systems, 9: 1722616. https://doi.org/10.3389/fsufs.2025.1722616
[31] Al-Tameemi, N., Zhang, X.X., Shahzad, F., Mehmood, K., Zhou, J. (2025). Enhancing desertification risk mapping with entropy-based weighting and machine learning: Insights from Iraq. Journal of Environmental Management, 396: 127976. https://doi.org/10.1016/j.jenvman.2025.127976
[32] Benabderrahmane, M.C., Chenchouni, H. (2010). Assessing environmental sensitivity areas to desertification in Eastern Algeria using Mediterranean Desertification and Land Use "MEDALUS" model. International Journal of Sustainable Water and Environmental Systems, 1: 5-10. https://doi.org/10.5383/swes.01.01.002
[33] Badiee, S.H., Masoudi, M., Abtahi, S.A., Pradhan, B. (2024). Assessment of desertification hazard using RS and GIS to compare the efficiency of FAO-UNEP and MEDALUS models. Spatial Information Research, 32(5): 641-650. https://doi.org/10.1007/s41324-024-00583-z
[34] Dwivedi, C.S., Dishant, Parida, B.R., Pandey, A.C., Kumar, R., Kumar, N. (2024). Geoinformatics-based mapping of environmental sensitive areas for desertification over Satara and Sangli districts of Maharashtra, India. GeoHazards, 5(2): 415-440. https://doi.org/10.3390/geohazards5020022
[35] Boali, A., Asgari, H.R., Mohammadian Behbahani, A., Salmanmahiny, A., Naimi, B. (2024). Remotely sensed desertification modeling using ensemble of machine learning algorithms. Remote Sensing Applications: Society and Environment, 34: 101149. https://doi.org/10.1016/j.rsase.2024.101149
[36] Nour-Eldin, H., Shalaby, A., Mohamed, R.M., Youssef, E., Rostom, N.G., Khedr, H.S. (2023). Assessment of the desertification sensitivity of Northwestern El Minya Governorate, Egypt using MEDALUS model. The Egyptian Journal of Remote Sensing and Space Sciences, 26(3): 758-767. https://doi.org/10.1016/j.ejrs.2023.07.013
[37] Miletić, S., Beloica, J., Perović, V., et al. (2023). Environmental sensitivity assessment and land degradation in southeastern Serbia: Application of modified MEDALUS model. Environmental Monitoring and Assessment, 195: 1241. https://doi.org/10.1007/s10661-023-11761-1
[38] Ren, Y., Liu, X.J., Zhang, B., Chen, X.D. (2023). Sensitivity assessment of land desertification in China based on multi-source remote sensing. Remote Sensing, 15(10): 2674. https://doi.org/10.3390/rs15102674
[39] Mukaliyev, Z., Zhumatayeva, Z. (2026). Ecological quality assessment of the Semipalatinsk Nuclear Test Site using RSEI based on Sentinel-2 data: A comparison of 2020 and 2024 summer conditions. International Journal of Design & Nature and Ecodynamics, 21(5): 1261-1269. https://doi.org/10.18280/ijdne.210504