Altitude-Associated Variation in Chicoric Acid Content and ISSR Profiles of Gamma-Irradiated Echinacea purpurea M1 Plants Grown at Two Sites in Central Java, Indonesia

Zainal Arifin | Yuli Widiyastuti | Edi Purwanto | Ahmad Yunus*
© 2026 The authors. This article is published by IIETA and is licensed under the CC BY 4.0 license (http://creativecommons.org/licenses/by/4.0/).
OPEN ACCESS
The pharmacological value of Echinacea purpurea (L.) Moench rests largely on cichoric acid, yet Indonesian breeding is limited by a narrow genetic base and scant insight into how mutagenesis and environment shape its within-plant distribution. We analysed the BH1 accession across five gamma-irradiation doses (0, 5, 10, 15, 20 Gy), at two altitudes, 293 vs 1200 metres above sea level (m a.s.l.). Cichoric acid was quantified in shoot and root tissues using reversed-phase high-performance liquid chromatography (HPLC), and genetic variation was assessed using eight inter-simple sequence repeat (ISSR) primers, which generated 63 genetic loci with 85.7% polymorphic loci. Chemical values are single unreplicated determinations and therefore exploratory. Cichoric acid partitioning switched between the two sites in an altitude-associated manner: lowland plants accumulated it mainly in the shoot (2.78% vs 0.49% w/w; index +0.62), peaking at 10 Gy (5.42%), whereas highland plants accumulated more in the root (1.05% vs 0.21% w/w; index −0.44), maximal at 10 Gy (3.06%). Lowland flowers more often showed ray-floret fading and capitulum distortion at higher doses, whereas highland flowers remained more stable — illustrative, non-quantified observations. Grouping the ten genotyped individuals by altitude accounted for 79.8% of ISSR variance (ΦST = 0.798, P = 0.013; n = 5 per altitude), an exploratory partition rather than a demonstrated altitude effect; non-negative matrix factorization (NMF) decomposition at K = 3 isolated the 10 Gy lowland individual. These findings frame lowland sites as shoot-targeted and highland sites as root-targeted systems, flagging the 10 Gy lowland individual as a preliminary candidate for M2–M3 screening. Because the two sites differ in factors other than elevation, the patterns reported here are described as altitude-associated rather than altitude-driven.
medicinal plant breeding, gamma irradiation, ISSR markers, cichoric acid, tissue-specific accumulation, Echinacea purpurea, tropical altitude, phytochemical partitioning
Echinacea purpurea (L.) Moench is one of the most commercially significant medicinal plants globally, with annual sales exceeding USD 300 million in the USA alone [1]. The well-established therapeutic profile of this plant is primarily derived from immunomodulatory, antioxidant, and anti-inflammatory activities, which are mainly ascribed to cichoric acid, the dominant hydroxycinnamic acid derivative in this species [2, 3]. Indonesia possesses agroclimatic conditions suitable for growing Echinacea, yet the country remains a net importer of raw material, and domestication of the local accession BH1 suffers from exceptionally low genetic variation. This genetic base can be effectively expanded using gamma-ray mutagenesis combined with cultivation across a spectrum of elevations, while also assessing where best to grow the crop to maximise pharmacologically active metabolite yield [4-6].
The synthesis of cichoric acid in Echinacea occurs through the phenylpropanoid pathway, and its allocation between shoot and root tissues is far from uniform, depending on growth stage, environmental conditions, and genotype [3, 7]. The existing literature is conflicted here, with some studies reporting shoot- and flower-dominant accumulation, while others, particularly those conducted in cooler, high-altitude environments, have noted the opposite trend toward root dominance [8, 9]. A similar divergence in the allocation of above- and below-ground secondary metabolites along environmental gradients has recently been observed across unrelated taxa [10], raising the possibility that such reversals may reflect a general physiological response rather than an isolated peculiarity. What has not yet been tested is whether a single Echinacea accession of consistent genetic background can exhibit an unequivocal, direction-reversing change in tissue partitioning with altitude, and, if so, whether such reversals correlate at detectable genomic scales with mutagenic dose versus the climate experienced during growth.
Inter-Simple Sequence Repeat (ISSR) markers are well suited to addressing this question: they are dominant, anonymous, and reproducible, making them effective for detecting induced genomic variability in medicinal plants with a narrow genetic base [11, 12]. Combined with informativeness indices such as Polymorphism Information Content (PIC), Effective Multiplex Ratio (EMR), Resolving Power (RP), and Marker Index (MI = PIC × EMR), and analysed through Analysis of Molecular Variance (AMOVA) and non-negative matrix factorization (NMF) component decomposition inference, ISSR datasets can partition the variance among mutants into components attributable to radiation dose versus planting environment [13, 14].
To our knowledge, no previous study has combined gamma-ray mutagenesis with a contrasting-altitude field design to test for a within-accession reversal of tissue-specific cichoric acid partitioning, nor linked such a reversal to ISSR-based estimates of molecular differentiation. This study therefore examines three specific questions. First, whether the accumulation of cichoric acid in E. purpurea BH1 tissues consistently reverses with altitude, higher in the canopy in lowlands, more dominant in roots in highlands. Second, whether grouping by altitude explained more of the variance in molecular differentiation than mutagenic dose. Third, whether phenotypically distinct mutants can be identified as outliers in the resulting NMF component decomposition landscape.
To provide additional phenotypic context, floral and vegetative morphology were documented across all treatments. Seeds irradiated with gamma rays (0–20 Gy) were planted at two locations of contrasting elevation: lowlands (Jumantono, 293 metres above sea level (m a.s.l.)) and highlands (Tawangmangu, 1200 m a.s.l.). Cichoric acid was measured by high-performance liquid chromatography (HPLC) separately in shoot and root tissues, and molecular structure was analysed using eight ISSR primers, AMOVA with permutation testing, and NMF component decomposition at K = 2 and K = 3. The results are expected to provide an evidence base for tissue- and site-targeted Echinacea breeding in the tropical Asian region.
2.1 Plant material and gamma irradiation
Seeds of E. purpurea accession BH1 were obtained from the Research Center for Pharmaceutical Ingredients and Traditional Medicine, National Research and Innovation Agency (BRIN), Tawangmangu, Indonesia. Seed lots (~100 seeds per dose) were irradiated with gamma rays from a 60Co source at the Center for Isotope and Radiation Application, BRIN-Jakarta, on 12 January 2023. Five doses (0, 5, 10, 15, and 20 Gy) were delivered at 1 Gy min⁻¹ using a Gamma Chamber 4000A. Irradiated and non-irradiated control seeds were sown in a nursery, transferred to polybags containing a 1:1 (v/v) mixture of topsoil and composted manure, and acclimatised for 30 d before transplanting.
Seeds of the BH1 accession were obtained from the living Echinacea purpurea collection maintained by the Center for Research and Development of Medicinal Plants and Traditional Medicine (B2P2TOOT/BPTO), Tawangmangu, Indonesia, where this species has been cultivated since 2002. Ten morphologically characterised accessions are held within this collection, of which three (BH2, BHU3, BHU5) were previously selected as promising lines and subjected to ISSR-based diversity assessment; using ten ISSR primers on these accessions and eight first-year mass-selection variants, that assessment reported a genetic similarity index of 68.96–81.25% among accessions, indicating measurable, if low, intraspecific genetic diversity within this germplasm pool [15]. No accession-specific baseline ISSR profiling of BH1 itself was performed prior to irradiation in the present study. BH1 is therefore treated here as a single seed-propagated accession from this collection rather than as a genetically verified uniform genotype.
2.2 Field experimental sites
Plants were established at two contrasting altitudinal sites: (i) the experimental garden of Universitas Sebelas Maret in Jumantono, Karanganyar (7°37′ S, 110°57′ E, 293 m a.s.l., lowland tropical climate, mean annual temperature ≈ 27.8 ℃), and (ii) the BRIN field station in Tawangmangu (7°40′ S, 111°08′ E, 1200 m a.s.l., upland tropical climate, mean annual temperature ≈ 19.6 ℃). At each site, plants of all five doses were grown side-by-side under identical field management (50 × 60 cm spacing; manure 5 t ha⁻¹; nitrogen–phosphorus–potassium (NPK) 200 kg ha⁻¹; supplementary irrigation maintaining 70–80% field capacity). The study used a simple random design through an experimental method, in which a population of 20 plants per treatment was cultivated in successive experimental swaths.
2.3 Morphological characterisation
At full bloom, floral and vegetative morphology were documented photographically for each dose × altitude combination under standardised conditions. Qualitative traits assessed comparatively across treatments included ray-floret (ligule) colour and pigmentation intensity and capitulum (flower-head) form and symmetry, based on a single representative photograph per dose × altitude combination. Leaf orientation was not photographically documented in this study and is therefore not reported. Observations were used to provide phenotypic context for the biochemical and molecular analyses rather than for formal quantitative scoring.
2.4 High-performance liquid chromatography quantification of cichoric acid
Samples were harvested at full physiological maturity, 240 days after transplanting. For each dose × altitude combination, shoot tissue (leaves, stems, and flowers) and roots were prepared as separate composite samples, each pooled from 3 individual plants harvested from the same plot. Plant material was air-dried, then 1 g of sample was extracted in 30 mL of ethanol (96%, analytical grade) by maceration for 24 h with periodic stirring. The extract was filtered through Whatman No. 1 paper, evaporated, and the residue was reconstituted in 0.1 N HCl prior to HPLC analysis. Cichoric acid was quantified by reversed-phase HPLC using a Waters chromatographic system equipped with a 2998 photodiode-array (PDA) detector, controlled by Empower 3 software (Waters Corp., Milford, MA, USA), on a Symmetry Shield RP-18 column (5 µm, 250 × 4.6 mm) maintained at 40 ℃. The isocratic mobile phase was acetonitrile–methanol–0.15% phosphoric acid (10:25:65, v/v/v) delivered at 1.5 mL min⁻¹, with UV detection at 330 nm. Quantification was performed by single-point comparison against a secondary reference standard of cichoric acid, prepared by dissolving 100 mg in 25 mL of 0.1 N HCl, sonicating for 10 min, and filtering through a 0.45 µm membrane prior to injection; the standard was analysed in triplicate. Under these conditions, the secondary standard eluted at a retention time of 8.02 ± 0.01 min (Relative Standard Deviation (RSD) = 0.1%, n = 3) with a mean peak area of 2,354,811 ± 169,339 (RSD = 7.2%, n = 3), confirming stable chromatographic behaviour and acceptable system precision. Sample extracts were analysed under the same chromatographic conditions as the cichoric acid standard. Each composite sample extract was injected once, resulting in one chromatographic measurement per composite sample. Analytical conditions and standard precision were verified against an official laboratory certificate of analysis (PT Konimex Quality Control Department, Certificate No. SX-00198-00, issued 8 March 2025). A multi-point calibration curve, together with formal determination of linearity (R²), limit of detection (LOD), limit of quantification (LOQ), and recovery, was not performed for this analytical batch; values for which no cichoric acid peak was observed above baseline noise at the expected retention time were recorded as " below visual detection threshold " (n.d.) rather than assigned a statistically validated sub-LOD value. Quantification was performed against a single-point calibration using a chicoric acid reference standard at 100 µg mL⁻¹. A multi-point calibration curve, assessment of linearity (R²), LOD/LOQ, and recovery testing were not performed in this study. Samples in which no chromatographic peak was discernible at the retention time of the chicoric acid standard were recorded as "below visual detection threshold"; this criterion is operator-dependent and was not defined by a signal-to-noise ratio.
2.5 Tissue partitioning index
The relative accumulation of cichoric acid in the two tissues was quantified as a partitioning index (PI = (S − R) / (S + R + ε)), where S and R are the shoot and root cichoric acid concentrations, respectively, and ε = 0.01 avoids division by zero when both tissues report n.d. The index ranges from -1 (pure root accumulation) through 0 (equal partitioning) to +1 (pure shoot accumulation).
2.6 Inter-simple sequence repeat genotyping
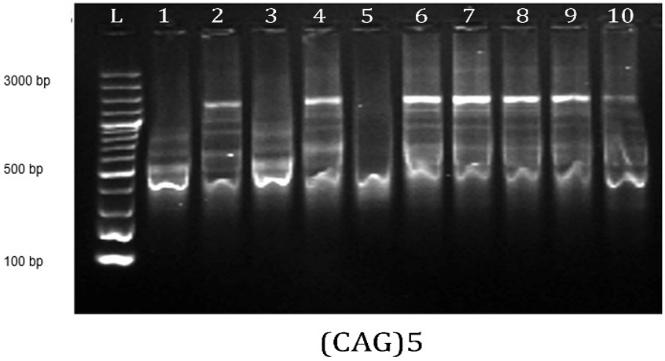
Genomic DNA was extracted from young leaves (100 mg) of one plant per dose × altitude combination using the GenElute Plant Genomic DNA Miniprep Kit (Sigma-Aldrich). DNA integrity and purity were verified by agarose-gel electrophoresis; absorbance ratios (A260/A280) ranged between 1.75 and 1.95, and gel profiles showed clear, distinct bands without smearing. After screening 20 ISSR primers for amplification specificity and polymorphism, eight (Table 1) were selected [16, 17]. Polymerase chain reaction (PCR) reactions (25 µL) contained 30 ng template DNA, 1 µL (10 µM) primer, and 12.6 µL GoTaq Green Master Mix (Promega). Cycling on a Bio-Rad C-1000 thermal cycler was: 94 ℃ / 3 min; 39 cycles of (94 ℃ / 1 min, primer-specific annealing (46–52 ℃) / 1 min, 72 ℃ / 2 min); 72 ℃ / 8 min; 4 ℃ hold. Amplicons were resolved on 1.8% agarose stained with SYBR Safe (90 min, 70 V) and visualised in a Bio-Rad Imaging System XR+. Bands were scored as presence (1) / absence (0). Band scoring was performed by a single evaluator based on a fixed intensity threshold under UV visualisation; only bands within the ~100–2000 bp range were scored, and faint bands below this threshold were excluded. PCR amplification was not independently repeated for all primers; consequently, the possibility that some scored bands reflect amplification variability rather than genuine polymorphism cannot be fully excluded.
Table 1. Sequences and primer-specific annealing temperatures of the eight inter-simple sequence repeat (ISSR) primers used for genotyping BH1 mutants
|
Primer Code |
Sequence (5′→3′) |
Annealing T (℃) |
|
(AC)9G |
ACACACACACACACACACG |
52 |
|
(AG)8G |
AGAGAGAGAGAGAGAGG |
50 |
|
(CA)8A |
CACACACACACACACAA |
46 |
|
(CAG)5 |
CAGCAGCAGCAGCAG |
50 |
|
(CTC)6 |
CTCCTCCTCCTCCTCCTC |
52 |
|
(GA)8YT |
GAGAGAGAGAGAGAGAYT |
48 |
|
(GT)8YC |
GTGTGTGTGTGTGTGTYC |
48 |
|
(TC)8G |
TCTCTCTCTCTCTCTCG |
50 |
Note: Annealing temperatures were optimised by gradient polymerase chain reaction (PCR). Y denotes C or T.
2.7 Statistical and computational framework
Analyses were executed in Python 3.12 (NumPy 2.0, SciPy 1.17, scikit-learn 1.8, pandas 2.2, matplotlib 3.9, seaborn 0.13) with random seed = 42. We calculated PIC, EMR, RP, and MI per primer; Nei’s gene diversity (h), Shannon’s information index (I), and effective number of alleles (Ne) per population; Dice similarity coefficients with UPGMA clustering; AMOVA (999 permutations); and NMF-based component decomposition at K = 2 and K = 3. Descriptive summaries (mean, range, below visual detection threshold count) of the cichoric-acid data were computed per tissue × altitude; owing to the absence of biological replicates and the prevalence of n.d. values, no inferential significance testing was attempted on the chemical data.
3.1 Tissue-specific cichoric acid: Altitude-associated reversal
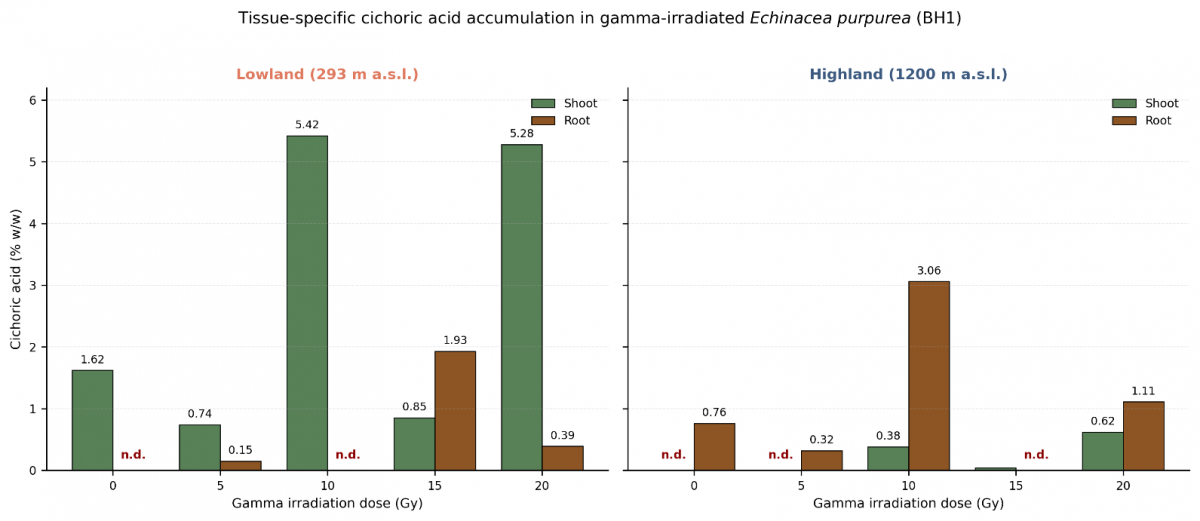
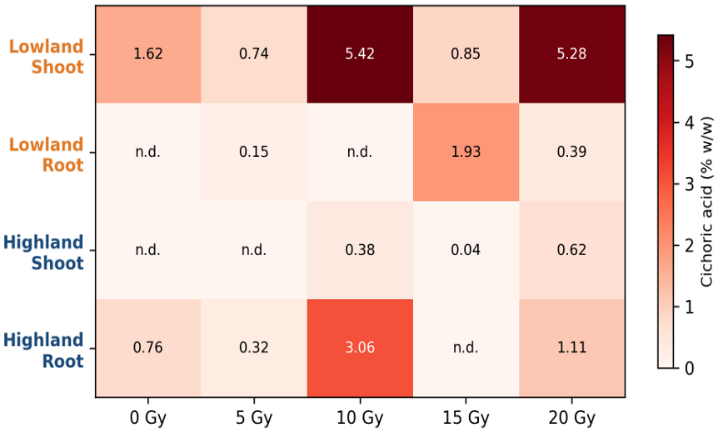
HPLC quantification revealed a clear, consistent reversal of cichoric acid partitioning between altitudes (Figure 1; Table 2). In the lowland environment, cichoric acid accumulated mainly in the shoot (mean 2.78% w/w; range 0.74–5.42%) and peaked at 10 Gy (5.42% w/w), with an essentially equal peak at 20 Gy (5.28% w/w). Concentrations in lowland roots were substantially lower (mean 0.49% w/w; range 0.00–1.93%; two of five samples below the detection limit). In highland plants, the pattern was reversed: cichoric acid accumulated predominantly in root tissue (mean 1.05% w/w; range 0.32–3.06%, highest at 10 Gy: 3.06% w/w) and reached very low levels in shoots (mean 0.21% w/w; two of five samples below detection, including the non-irradiated control). The two lowest highland shoot samples fell below the chromatographic detection limit, indicating concentrations too low to be quantified reliably under the assay conditions.
Table 2. Cichoric acid concentration (% w/w) in shoot and root tissues of E. purpurea BH1 across five gamma-irradiation doses and two altitudes
|
Dose (Gy) |
Lowland Shoot |
Lowland Root |
Highland Shoot |
Highland Root |
|
0 |
1.62 |
n.d. |
n.d. |
0.76 |
|
5 |
0.74 |
0.15 |
n.d. |
0.32 |
|
10 |
5.42 |
n.d. |
0.38 |
3.06 |
|
15 |
0.85 |
1.93 |
0.04 |
n.d. |
|
20 |
5.28 |
0.39 |
0.62 |
1.11 |
|
Mean |
2.78 |
0.49 |
0.21 |
1.05 |
Note: n.d. = below the chromatographic detection limit.
3.2 Quantitative partitioning index confirms the reversal
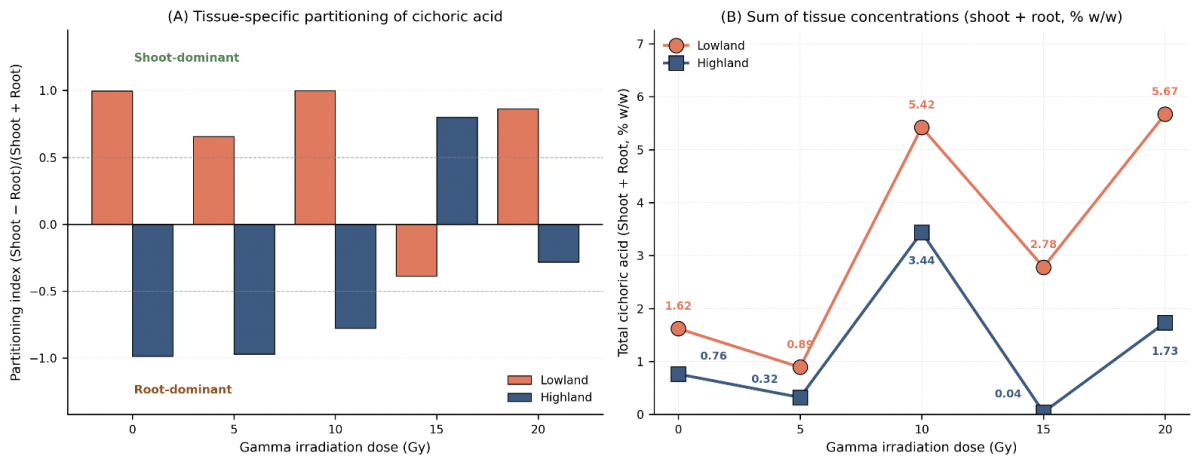
PI summarises tissue allocation as a single number (Figures 2 and 3). PI was strongly positive for four of five doses across the lowland treatments (0 Gy = +0.99; 5 Gy = +0.66; 10 Gy = +1.00; 20 Gy = +0.86), corresponding to shoot-dominant accumulation, with only the 15 Gy lowland treatment deviating (PI = -0.39). The highland series exhibited a mirror-image pattern, with strongly negative PI in four of five doses, indicating root-dominant accumulation. The mean partitioning indices for lowland and highland were therefore +0.62 and -0.44 PI units, respectively, a difference of 1.06 PI units.
3.3 Sum of tissue concentrations (shoot + root, % w/w)
When shoot and root concentrations are summed (Figure 2(B)), the lowland environment delivered a substantially higher sum of tissue concentrations (shoot + root, % w/w) than the highland environment at every dose except 5 Gy. The highest whole-plant yield was recorded at 20 Gy lowland (5.67% w/w), closely followed by 10 Gy lowland (5.42% w/w) and 10 Gy highland (3.44% w/w; the highest highland value). The 15 Gy treatment produced unusually low whole-plant yields at both altitudes (lowland 2.78%, highland 0.04%), suggesting that this dose may represent a non-monotonic dose-associated pattern for cichoric acid biosynthesis, although the absence of replication precludes a formal test of this hypothesis.
3.4 Floral and vegetative morphology across dose and altitude
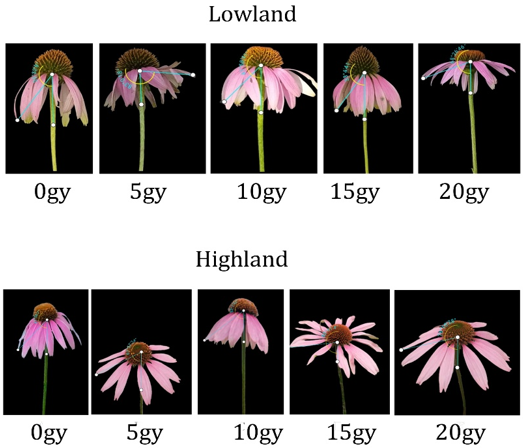
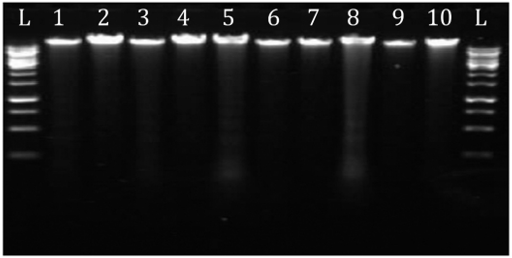
Photographic documentation of capitulum morphology in E. purpurea under increasing gamma-irradiation doses at the two sites is presented in Figure 4. As these images represent a single illustrative flower per dose × altitude combination rather than a replicated, quantitatively scored sample, the description below is qualitative and should be read as illustrative phenotypic context rather than a statistically confirmed trend. In the lowland series, ray florets appeared reflexed (bent downward and outward from the disc) at 0, 15, and 20 Gy, whereas capitula at 5 and 10 Gy retained a comparatively flatter, more outstretched arrangement; ray-floret colouration ranged from vivid pink at 0, 10, and 20 Gy to a paler hue with localised pale streaking at 5 Gy. In the highland series, ray florets were similarly reflexed at 0, 10, and 20 Gy, while the 5 Gy flower showed markedly fewer, more upright florets, and the 15 Gy capitulum displayed a broader, flatter disc with paler ray-floret colouration and an apparently asymmetric outline relative to the other highland doses. Overall, the highland flowers examined here retained comparatively vivid pink pigmentation across most doses, whereas the lowland series included more instances of paler or unevenly coloured petals, particularly at 5 Gy, a pattern broadly consistent with reports of dose- and environment-associated pigment changes in gamma-irradiated ornamental and medicinal species [2, 4, 18, 19].
3.5 Genomic DNA quality and inter-simple sequence repeat-based molecular structure
Genomic DNA isolated from the ten E. purpurea samples was of sufficient quantity and quality for amplification, showing clear, distinct bands without smearing and A260/A280 ratios of 1.75–1.95 (Figure 5). The eight selected ISSR primers amplified 63 reproducible bands, of which 54 (85.7%) were polymorphic across the ten mutant samples (Table 3; representative profiles in Figure 6). Mean Polymorphism Information Content was 0.32 (range 0.00–0.49), Effective Multiplex Ratio 6.13, Resolving Power 5.95, and Marker Index 2.70. Two primers, (CA)8A and (CTC)6—amplified only monomorphic bands and contributed no informativeness. The (CAG)5 primer was the most informative (PIC = 0.49; MI = 6.84), followed by (GA)8YT (PIC = 0.48; MI = 4.78). Population-level diversity was higher in the lowland group (P% = 38.1; Nei’s h = 0.137; Shannon I = 0.207) than in the highland group (P% = 25.4; h = 0.094; I = 0.141), indicating that the lowland environment retained or expressed a broader pool of induced variability [11, 12].
Table 3. Polymorphism and informativeness indices for the eight inter-simple sequence repeat (ISSR) primers
|
Primer |
Total Bands |
Polymorphic Bands |
Polymorphism (%) |
PIC |
EMR |
RP |
MI |
|
(AC)9G |
11 |
9 |
81.8 |
0.351 |
7.36 |
6.60 |
2.584 |
|
(AG)8G |
6 |
5 |
83.3 |
0.410 |
4.17 |
4.60 |
1.708 |
|
(CA)8A |
1 |
0 |
0.0 |
0.000 |
0.00 |
0.00 |
0.000 |
|
(CAG)5 |
14 |
14 |
100.0 |
0.489 |
14.00 |
12.80 |
6.840 |
|
(CTC)6 |
2 |
0 |
0.0 |
0.000 |
0.00 |
0.00 |
0.000 |
|
(GA)8YT |
10 |
10 |
100.0 |
0.478 |
10.00 |
8.60 |
4.780 |
|
(GT)8YC |
10 |
8 |
80.0 |
0.394 |
6.40 |
7.40 |
2.522 |
|
(TC)8G |
9 |
8 |
88.9 |
0.440 |
7.11 |
7.60 |
3.129 |
|
Mean |
7.9 |
6.8 |
66.8 |
0.320 |
6.13 |
5.95 |
2.695 |
Note: PIC = Polymorphism Information Content; EMR = Effective Multiplex Ratio; RP = Resolving Power; MI = Marker Index.
3.6 Hierarchical clustering and non-negative matrix factorization component decomposition
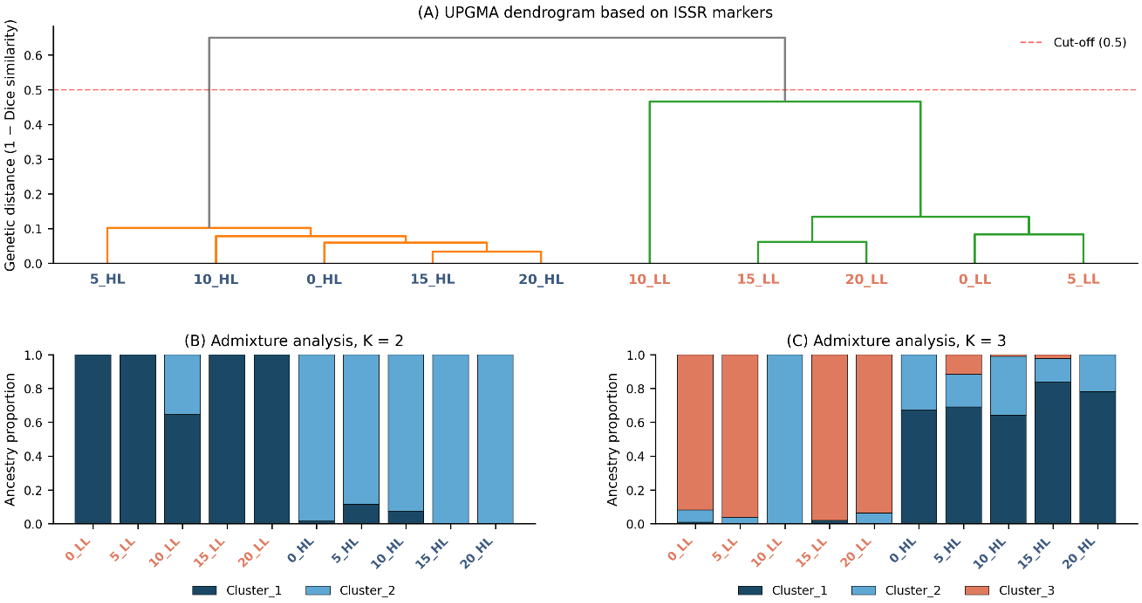
Unweighted Pair Group Method with Arithmetic Mean (UPGMA) clustering of the ten mutants (Figure 7) resolved two main clades separated along strictly altitudinal lines at a Dice distance of 0.5. Mean within-clade similarity was 0.92 in the highland clade (most similar pair 15_HL vs 20_HL, Dice = 0.967) and lower, though still substantial, among lowland members (mean 0.75; most similar pair 15_LL vs 20_LL, Dice = 0.939). The 10_LL mutant was relatively isolated within the lowland clade, consistent with its phytochemical exceptionalism. This similarity structure, derived from Dice coefficients scored across all ISSR loci, quantifies the genetic divergence induced by mutagenesis and altitudinal selection: a lower similarity between the non-irradiated control and a given treatment indicates a higher frequency of polymorphism and thus a broader genetic base [5, 11]. NMF component decomposition inference at K = 2 recovered the elevation partition with negligible NMF component decomposition for nine of ten samples (mean NMF component decomposition > 0.97 to the dominant cluster); the 10_LL mutant was the only sample showing appreciable NMF-derived component membership (0.65 / 0.35). At K = 3, the 10_LL mutant resolved as a discrete genetic cluster (100% NMF component decomposition to a unique component absent from all other samples), co-occurrence of molecular and phytochemical distinctiveness. Given the small sample size (n = 10) and the absence of model-selection or cross-validation criteria, the K = 3 decomposition is presented as an exploratory pattern rather than a validated genetic cluster.
Figure 7. Inter-simple sequence repeat (ISSR)-based molecular structure of the 10 BH1 mutants. (A) UPGMA dendrogram constructed from 1 − Dice similarity, (B) non-negative matrix factorization (NMF) component-weight barplot at K = 2 separates the lowland and highland populations, (C) NMF component-weight barplot at K = 3 isolates the 10 Gy lowland mutant as a distinct genetic cluster
3.7 Molecular differentiation between the sampled lowland and highland individuals
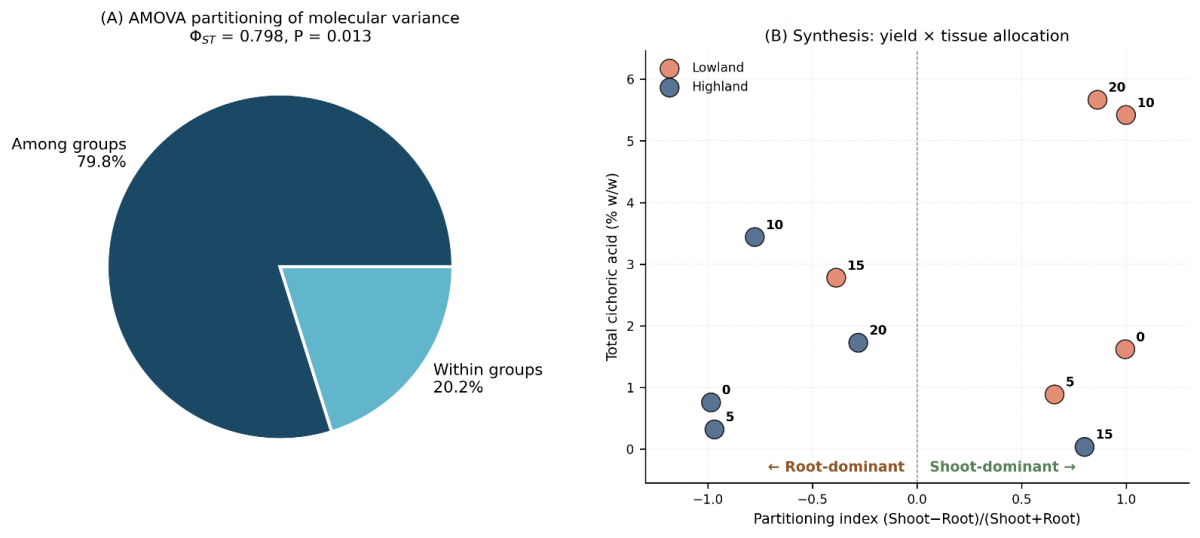
AMOVA (Figure 8(A)) showed that 79.8% of the total molecular variance stems from differences between altitudes, with only 20.2% attributable to variation within the same altitude group. The ΦST value of 0.798 (P = 0.013, 999 permutations) confirms very strong altitudinal differentiation, far exceeding the threshold commonly used in biogeographic substructure analysis. When the PI is plotted against the sum of tissue concentrations (shoot + root, % w/w) (Figure 8(B)), lowland and highland samples do not overlap: lowland mutants occupy the upper-right quadrant (high yield, shoot dominance) and highland mutants the lower-left quadrant (lower yield, root dominance). Both lines of evidence—molecular and chemical—converge on the same conclusion: the observed ISSR differentiation coincides with the altitudinal contrast between sites, though the small per-group sample size (n = 5) precludes attributing this pattern to altitude alone.
Figure 8. (A) Analysis of Molecular Variance (AMOVA)-based partitioning of molecular variance: 79.8% occurs among altitudinal populations (ΦST = 0.798, P = 0.013), (B) synthesis of partitioning index (PI) and sum of tissue concentrations (shoot + root, % w/w): lowland and highland mutants occupy non-overlapping regions of the chemotype space
4.1 An altitude-associated reversal of tissue-specific accumulation
The most notable finding of this study is the consistent, altitude-associated reversal in the distribution of cichoric acid within a single accession of E. purpurea (BH1) of uniform genetic background: lowland plants accumulate cichoric acid primarily in shoot tissue (mean PI = +0.62), highland plants primarily in root tissue (mean PI = −0.44) that a difference of 1.06 units on the partition scale. To our knowledge, this reversal within a single genotype has not been reported previously in Echinacea. Both shoot-dominant and root-dominant patterns have been documented separately in temperate populations under different environmental regimes [3, 8, 9], and organ-specific accumulation has recently been confirmed at the transcriptomic level [20], but not their reversal within one accession. A comparable divergence between above- and below-ground secondary metabolite allocation along an environmental gradient has been reported in Reynoutria japonica, where investment shifted toward below-ground rhizome metabolites relative to leaf metabolites at higher latitudes [10], and a significant negative correlation between root and aerial cichoric acid concentrations has previously been noted within E. purpurea itself [21], consistent with a partitioning trade-off between tissues rather than independent tissue-specific regulation.
Several mechanistic explanations are plausible. At low altitude, higher temperatures (≈ 27.8 vs 19.6 ℃) and a longer growing season promote faster canopy growth and greater photosynthetic capacity, providing a strong above-ground sink for newly synthesised hydroxycinnamate derivatives. At high altitude, greater abiotic stress, lower temperatures, higher UV-B, and wide diurnal temperature fluctuations are known to redirect carbon and nitrogen fluxes toward below-ground storage and defence [19, 22, 23]. Because root tissue is the primary long-term storage compartment for cichoric acid and related caffeic acid derivatives in Echinacea [8], high-altitude conditions would logically favour accumulation there. Although our design does not allow direct testing of this mechanism, the consistency of the pattern across four of five doses at each altitude, mirrored by the morphological stress signatures of the lowland series, indicates a general physiological response to tropical altitudinal gradients rather than a mutagenic artefact.
4.2 Operational implications for tissue- and site-targeted breeding
The altitude-associated distribution of cichoric acid has practical implications for developing Echinacea production in tropical regions. For products made from aerial parts, which are tinctures, teas, and similar herbal preparations, the lowland site produced the highest shoot cichoric acid concentrations observed in this dataset: the 10 Gy and 20 Gy lowland mutants yielded 5.42% and 5.28% w/w, respectively. These values fall within the range reported for European Echinacea cultivars analysed by HPLC [3, 9], although direct numerical comparison across studies should be treated with caution, as tissue composition (whole shoot versus leaf-only or flower-only material), harvest stage, drying method, extraction solvent, and HPLC quantification procedure were not necessarily identical between the present study and these literature sources; differences in any of these factors can materially affect the reported percentage concentration independent of genuine biological differences. Accordingly, the comparison with studies [3, 9] is presented here as literature-based contextualisation of the concentration range obtained rather than as evidence of a directly comparable, method-controlled superiority over European cultivars. For root-based products, particularly standardised extracts that the highland site was more advantageous: the 10 Gy highland mutant recorded a root cichoric acid concentration of 3.06% w/w, the highest in the dataset. Notably, gamma mutagenesis of accession BH1 increased cichoric acid concentration in both tissue compartments relative to the respective 0 Gy control, provided it was paired with a suitable environment; the environmental and physiological mechanisms plausibly underlying thealtitude-associated variation, such as temperature, UV-B exposure, and carbon-allocation shifts between shoot and root sinks, are discussed as literature-based explanations in Section 4.1 and were not directly measured in this study.
4.3 Co-occurrence of molecular and phytochemical distinctiveness of the 10 Gy lowland mutant
Integrating all analyses, the 10 Gy lowland individual is identified as a preliminary candidate for further M2–M3 screening. It produced the greatest shoot cichoric acid concentration (5.42% w/w) and PI = +1.00, and was genetically distinguished as a discrete NMF component decomposition cluster at K = 3 (97.8–100% NMF component decomposition to one component). Convergence of phenotypic, biochemical, and molecular distinctiveness is the canonical signature of a successful step-wise mutation-breeding outcome [5, 14] and is consistent with a mutational bottleneck centred on an emergent novel haplotype; advancing these lines through M2 and M3 generations is warranted for stability assessment. The 20 Gy lowland mutant is a noteworthy back-up candidate, with a nearly equivalent shoot concentration (5.28% w/w).
4.4 Strengths, limitations, and prospects
The strengths of this study include (1) a full factorial dose × altitude design using a single genetically uniform accession, enabling tissue-specific tabulation of cichoric acid and revealing reversals that whole-plant comparisons would obscure; and (2) integration of morphological, molecular (ISSR), biochemical (HPLC), and analytical (AMOVA, NMF component decomposition, partitioning indices) approaches. Limitations must nonetheless be acknowledged. First, the cichoric acid data comprise a single HPLC measurement per tissue × dose × altitude combination, precluding formal inferential testing; the descriptive comparisons should be read as effect-size markers rather than statistically confirmed differences. Each composite sample was pooled from 3 individual plants harvested from the same plot, so the reported values additionally absorb within-plot heterogeneity among those plants without providing an estimate of it; the observed contrasts among doses, altitudes and tissues therefore cannot be separated from injection, extraction and compositing variability, and should be treated as preliminary effect-size estimates rather than confirmed treatment differences. Future work should employ a minimum of three independent biological replicates per dose × altitude × tissue combination, each analysed in analytical duplicate, so that treatment effects can be evaluated by analysis of variance with appropriate post hoc testing. Second, 25% (5 of 20 samples) of samples fell below the detection limit; future work should employ more sensitive techniques such as LC-MS/MS. Third, re-genotyping using raw scoring data and complementary marker systems (e.g., SCoT, SSR, genotyping-by-sequencing) is recommended to corroborate the ISSR results, which are themselves based on a single individual per dose × altitude combination. Fourth, the M1 generation is heterozygous for many induced mutations; multi-generational confirmation in M2–M3 lines is required before any formal cultivar release. M1 individuals are moreover frequently chimeric, so that an observed phenotype may reflect somatic sectoring rather than a heritable genetic change and may not be recovered in the M2 generation; because only one individual was evaluated per dose × altitude combination, it is also not possible to determine whether the distinctive profile of the 10 Gy lowland plant represents a reproducible treatment response or an individual outlier. That plant is accordingly designated a preliminary candidate for further screening rather than a selected genotype. Fifth, formal calibration linearity (R²), LOD, LOQ, and recovery were not determined for the HPLC assay in this study; retention-time stability (RSD = 0.1–0.2%) and peak-area precision of the secondary reference standard (RSD = 7.2%, n = 3) were verified against the official laboratory certificate of analysis, but "below visual detection threshold " values were assigned based on visual absence of a peak above baseline rather than a statistically validated detection limit. This constitutes a major analytical limitation, because the observed concentrations span from below the visual detection threshold to 5.42% w/w, which is a range of several orders of magnitude over which single-point calibration cannot account for deviations from linearity, matrix effects, or intercept offsets; the visual criterion is moreover operator-dependent and may misclassify genuinely low but non-zero concentrations as absent, thereby exaggerating apparent contrasts between treatments. This should be addressed through full method validation in future replicated studies. Then, ISSR scoring reproducibility was not formally verified through repeated PCR runs or independent second-person scoring; this is acknowledged as a methodological limitation, and re-genotyping with repeated amplification and blind scoring is recommended for future confirmatory work. Because ISSR genotyping used a single plant per dose × altitude combination, each altitude group is represented by only five individuals; the reported AMOVA differentiation should be interpreted as a dataset-level pattern rather than proof that altitude per se drives genome-wide differentiation, since individual variation, mutational stochasticity, and pre-existing seed-lot variation cannot be excluded as contributing sources. ΦST estimates derived from such small groups are known to be unstable and sensitive to the particular individuals sampled, and no adjustment for multiple comparisons was applied, so the nominal significance level (P = 0.013) does not incorporate control of the family-wise type I error rate and should be read descriptively; stable estimation would require on the order of 15–20 individuals per group.
A further limitation concerns the attribution of the observed patterns to altitude itself. Although the two sites differ markedly in elevation (293 versus 1200 m a.s.l.), they also differ in a range of co-varying environmental attributes, including mean air and soil temperature (≈ 27.8 versus 19.6 ℃), diurnal temperature amplitude, relative humidity, rainfall distribution, solar radiation and ultraviolet-B flux, soil physicochemical properties, and soil microbial communities. Because altitude was not replicated, as a single site represents each elevation class and none of these variables was manipulated or held constant, elevation is confounded with all of them, and the reversal in tissue partitioning cannot be attributed uniquely to altitude. The mechanisms proposed in Section 4.1 are therefore offered as literature-based interpretations of an altitude-associated, site-dependent pattern rather than as demonstrated causes. Resolving the causal contribution of elevation will require either multiple sites nested within each altitude class, or controlled-environment experiments in which temperature, irradiance, photoperiod and ultraviolet-B are varied independently while other factors are held constant.
Prospectively, follow-up work on the 10 Gy lowland line should proceed in three stages. First, the M1 plant should be advanced to M2 by selfing and a population of at least 100–200 M2 progeny raised, so that segregation of the shoot cichoric acid phenotype can be assessed and chimerism excluded. Second, M2 individuals retaining elevated shoot concentrations should be advanced to M3 and evaluated in replicated trials as a minimum of three biological replicates per line at both study sites and, where feasible, under controlled conditions, in order to estimate broad-sense heritability and genotype × environment interaction for the partitioning trait. Third, the NMF component that distinguished the 10 Gy lowland plant at K = 3 should be re-examined across M2–M3 progeny to determine whether the underlying polymorphic bands are stably transmitted and, if so, converted into reproducible codominant markers (SSR or SNP) capable of supporting marker-assisted selection. Only after such confirmation would the line justify designation as a mutant with improved cichoric acid content, and the site-targeted strategy outlined in Section 4.2 become testable as an operational recommendation rather than a hypothesis.
This integrated morphological, ISSR, and phytochemical study of the Indonesian E. purpurea BH1 accession yields four principal conclusions. First, the distribution of cichoric acid between shoot and root tissues reverses consistently with altitude: lowland plants accumulate it primarily in the shoot (mean PI = +0.62) and highland plants primarily in the root (mean PI = -0.44), a pattern paralleled by dose-dependent morphological stress signatures in the lowland series. Second, the sampled lowland and highland individuals were clearly differentiated in this ISSR dataset (ΦST = 0.798, P = 0.013), consistent with, though not proof of, an altitude-associated effect. Third, among all treatment combinations, the 10 Gy lowland individual exhibited distinctive ISSR and phytochemical profiles and is proposed as a preliminary candidate for further M2–M3 screening, combining the highest shoot cichoric acid concentration (5.42% w/w; PI = +1.00) with a distinctive admixture cluster at K = 3. Fourth, these results generate a testable hypothesis for future site-targeted cultivation trials, rather than an operational cultivation recommendation at this stage. Further research should validate these findings in the M2–M3 generations using HPLC quantification with technical and biological replication, expand the analytical pipeline to non-targeted LC-MS/MS metabolomics, and complement ISSR genotyping with sequence-based markers for a more complete mutational dissection.
This research was supported by the Doctoral Dissertation Research Grant Scheme, Universitas Sebelas Maret, Surakarta, Indonesia. The authors thank the Center for Isotope and Radiation Application (BRIN-Jakarta) for the gamma-irradiation service, and the Tawangmangu and Jumantono field stations for logistical support. The BH1 accession curators at BRIN-Tawangmangu kindly provided the parental seed material.
[1] Ahmadi, F., Kariman, K., Mousavi, M., Rengel, Z. (2024). Echinacea: Bioactive compounds and agronomy. Plants, 13(9): 1235. https://doi.org/10.3390/plants13091235
[2] Cahyaningsih, A.P., Etikawati, N., Yunus, A. (2022). Morphological characters variation of Indonesian accession Echinacea purpurea in response to gamma-ray irradiation. Biodiversitas: Journal of Biological Diversity, 23(10): 5351. https://doi.org/10.13057/biodiv/d231045
[3] Pellati, F., Benvenuti, S., Magro, L., Melegari, M., Soragni, F. (2004). Analysis of phenolic compounds and radical scavenging activity of Echinacea spp. Journal of Pharmaceutical and Biomedical Analysis, 35(2): 289-301. https://doi.org/10.1016/S0731-7085(03)00645-9
[4] Diallo, S., Badiane, F.A., Gueye, M.D., Diouf, M., Diouf, D. (2025). Determining the optimal gamma irradiation dose for developing novel cowpea (Vigna unguiculata) genotypes. International Journal of Radiation Biology, 101(2): 174-185. https://doi.org/10.1080/09553002.2024.2440849
[5] Lal, R.K., Chanotiya, C.S., Gupta, P. (2020). Induced mutation breeding for qualitative and quantitative traits and varietal development in medicinal and aromatic crops at CSIR-CIMAP, Lucknow (India): Past and recent accomplishment. International Journal of Radiation Biology, 96(12): 1513-1527. https://doi.org/10.1080/09553002.2020.1834161
[6] Sidhiq, D.F., Widiyastuti, Y., Subositi, D., Pujiasmanto, B., Yunus, A. (2020). Morphological diversity, total phenolic and flavonoid content of Echinacea purpurea cultivated in Karangpandan, Central Java, Indonesia. Biodiversitas, 21(3): 1265-1271. https://doi.org/10.13057/biodiv/d210355
[7] Tsai, Y.L., Chiou, S.Y., Chan, K.C., Sung, J.M., Lin, S.D. (2012). Caffeic acid derivatives, total phenols, antioxidant and antimutagenic activities of Echinacea purpurea flower extracts. LWT-Food Science and Technology, 46(1): 169-176. https://doi.org/10.1016/j.lwt.2011.09.026
[8] Liu, C.Z., Abbasi, B.H., Gao, M., Murch, S.J., Saxena, P.K. (2006). Caffeic acid derivatives production by hairy root cultures of Echinacea purpurea. Journal of Agricultural and Food Chemistry, 54(22): 8456-8460. https://doi.org/10.1021/jf061940r
[9] Senica, M., Mlinsek, G., Veberic, R., Mikulic-Petkovsek, M. (2019). Which plant part of purple coneflower (Echinacea purpurea (L.) Moench) should be used for tea and which for tincture? Journal of Medicinal Food, 22(1): 102-108. https://doi.org/10.1089/jmf.2018.0026
[10] Bi, J., Bossdorf, O., Liao, Z., et al. (2024). Divergent geographic variation in above-versus below-ground secondary metabolites of Reynoutria japonica. Journal of Ecology, 112(3): 514-527. https://doi.org/10.1111/1365-2745.14248
[11] Taheri, S., Abdullah, T.L., Abdullah, N.A.P., Ahmad, Z. (2013). Use of intersimple sequence repeat assay for detection of DNA polymorphism induced by gamma rays in Curcuma alismatifolia. HortScience, 48(11): 1346-1351. https://doi.org/10.21273/HORTSCI.48.11.1346
[12] Wang, P., Zhang, Y., Zhao, L., Mo, B., Luo, T. (2017). Effect of gamma rays on Sophora davidii and detection of DNA polymorphism through ISSR marker. BioMed Research International, 2017(1): 8576404. https://doi.org/10.1155/2017/8576404
[13] Tambunan, R.S., Sukma, D., Purwoko, B.S., Efendi, D. (2025). Induced Lavandula angustifolia mill genetic variability through in vitro gamma irradiation. SABRAO Journal of Breeding and Genetics, 57(3): 1092-1102. http://doi.org/10.54910/sabrao2025.57.3.21
[14] Tharani, S., Mutharaian, V.N., Thirugnanasampandan, R. (2025). Mutagenesis for enhanced secondary metabolites production in medicinal plants. In Biotechnology, Multiple Omics, and Precision Breeding in Medicinal Plants, CRC Press, pp. 101-118.
[15] Subositi, D., Fauzi, F. (2016). Intraspecific diversity of Ekinase (Echinacea purpurea (L.) Moench) accessions from the first-stage mass selection based on ISSR analysis. Indonesian Journal of Plant Medicine, 9(1): 11-18. https://www.neliti.com/publications/142142/.
[16] Jabbarzadeh, Z., Khosh-Khui, M., Salehi, H., Saberivand, A. (2010). Inter simple sequence repeat (ISSR) markers as reproducible and specific tools for genetic diversity analysis of rose species. African Journal of Biotechnology, 9(37): 6091-6095.
[17] Baharuddin, M.F., Hariri, M.R., Turhadi, T. (2026). Suhu annealing primer inter simple sequence repeat (ISSR) pada DNA Aglaonema pictum (Roxb.) Kunth. BIOMA: Jurnal Biologi Makassar, 11(1): 1-9. https://doi.org/10.20956/bioma.v11i1.45426
[18] Aly, A., Eliwa, N., Abd El-Megid, M., Maraei, R. (2025). Impact of low-doses gamma radiation on phytochemicals and bioactive compounds in barley microgreens. International Journal of Radiation Biology, 101(7): 730-741. https://doi.org/10.1080/09553002.2025.2494613
[19] Wang, X.M., Zhao, G.Q., Chen, J., et al. (2025). Adaptation of plants to UV-B radiation with altitude in Tuha Basin: Synergistic regulation of epidermal structure, secondary metabolites, and organic element allocation. Life, 15(9): 1375. https://doi.org/10.3390/life15091375
[20] Lin, J., Yang, Q., Su, J., et al. (2025). Transcriptomics and metabolomics analyses of the effects of plant age and organ on caffeic acid derivative accumulation in Echinacea purpurea. Plant Physiology and Biochemistry, 226: 110051. https://doi.org/10.1016/j.plaphy.2025.110051
[21] Qu, L., Chen, Y., Wang, X., Scalzo, R., Davis, J.M. (2005). Patterns of variation in alkamides and cichoric acid in roots and aboveground parts of Echinacea purpurea (L.) Moench. HortScience, 40(5): 1239-1242.
[22] Bhat, I.A., Guleria, K., Fayaz, M., Qadir, R.U., Rafiq, S., Kaloo, Z.A. (2024). HR-LCMS-QTOF-assisted phytochemical profiling and an assessment of habitat and altitude influence on phytochemical, morphological and antioxidant potential in Aquilegia fragrans Benth. Chemical Papers, 78(17): 9019-9035. https://doi.org/10.1007/s11696-024-03724-8
[23] Pan, L., Yang, N., Sui, Y., et al. (2023). Altitudinal variation on metabolites, elements, and antioxidant activities of medicinal plant Asarum. Metabolites, 13(12): 1193. https://doi.org/10.3390/metabo13121193