Farah Jabber Hamood | Zainab Qassim Mohamed | Fouad Shakir Hashim* | Ahmed Ismail Abdelamir
© 2026 The authors. This article is published by IIETA and is licensed under the CC BY 4.0 license (http://creativecommons.org/licenses/by/4.0/).
OPEN ACCESS
Hybrid polymer nanocomposite (PNC) films based on polyvinyl alcohol-polyacrylamide (PVA-PAAM) were fabricated by solution casting to investigate the effect of Sb₂O₃-CuO nanofillers on their structural, morphological, and optical properties. A fixed amount of Sb₂O₃ (0.005 g) and increasing CuO contents (0.0075, 0.015, and 0.0225 g) were incorporated into the polymer blend to prepare S1-S3 films, while the unfilled blend served as the reference sample (S0). Fourier Transform Infrared (FT-IR) analysis indicated interfacial interactions between the polymer matrix and the metal-oxide nanofillers through band broadening and intensity changes, whereas field emission scanning electron microscope (FESEM) observations confirmed generally homogeneous dispersion with increased agglomeration at higher CuO loading. Ultraviolet-Visible (UV-Vis) analysis showed that nanofiller addition enhanced absorbance in the ultraviolet region, increased the Urbach energy from 0.37 to 1.07 eV, and reduced the allowed optical band gap from 4.68 to 3.60 eV. Optical parameters, including the refractive index, extinction coefficient, dielectric constants, and optical conductivity, increased progressively with CuO incorporation. Dispersion analysis using the Wemple-DiDomenico single-oscillator model further showed that the oscillator energy decreased from 4.79 to 3.92 eV, while the dispersion energy increased from 2.59 to 10.19 eV. The static refractive index rose from 1.24 to 1.90, the static dielectric constant from 1.54 to 3.60, and the oscillator strength from 12.4 to 39.9. These results demonstrate that Sb₂O₃-CuO incorporation effectively tunes the optical response of PVA-PAAM films and supports their potential use in UV-shielding and optoelectronic coating applications.
polyvinyl alcohol-polyacrylamide blend, Sb₂O₃-CuO nanofillers, Urbach energy, Wemple-DiDomenico, optoelectronic applications
Recently, there has been increased interest in using polycrystalline antimony trioxide (Sb2O3) nanocomposites (NCs) in a variety of applications as flame retardants, catalysts, optoelectronic, and photoelectric devices, due to its band gap of 3.5 eV. Energy, gas sensing, and medicine, as well as solar cells [1-3]. Recently, copper (CuO) NPs prepared by several methods, such as chemical reduction, thermal decomposition, microwave-assisted, solvothermal, and electrochemical synthesis, biosynthesis, and by some physical methods, have gained much attention due to their particular physical and chemical properties [4, 5]. The insertion of Sb2O3 into the polymeric matrix containing PVA or PVP has been reported for boosting ion transport, shielding, UV absorption, interfacial and mechanical stability, piezoelectric, optoelectronics, dielectric properties, and humidity sensing in the polymeric matrix [6]. As a type of non-living material added to the polymer structure, the size, shape, and surface features of these particles are important. The difference in size of Sb2O3 particles has a big impact on the strength and flame-resistant qualities of NCs [7]. The photocatalytic activity of pure Sb2O3 is low due to its high energy band gap. Therefore, combining it with other oxides such as copper oxide (CuO) effectively improves its photocatalytic activity [8]. The low cost and easier preparation of these NPs and mixing them with polymer have potential optoelectronic applications and make them promising in many applications, such as medical, low devices industry [9]. In this study, successfully prepared Sb2O3-CuO NCs were employed in the solid-state method to mix Sb2O3 and CuO NPs and then determine the effect of this on the modified blend polymers PVA-PAAM, at different concentrations, in terms of surface morphology and optical properties, which can help to gain a deep understanding of the materials' behavior in their composition in optoelectronic uses.
2.1 Materials
The PVA-PAAM polymer blend matrix was prepared from PVA [(C2H4O)n, 85000-124000 g.mol−1], a water-soluble synthetic polymer purchased from Himedia, India, and PAAM [-CH2-CH(CONH2)-]n, 500000 g.mol−1) from CDH, India. 99.9% pure Sb2O3 powder (20-30 nm) and 99.9% pure CuO powder (40 nm) were used as base materials to fabricate polymer NC films. Ultra-pure water (UPW) was used as a solvent for the polymer.
2.2 Preparation of PVA-PAAM/Sb2O3-CuO NC
A total of 0.85 g of PVA was dissolved in 25 mL of UPW. The solution was first stirred at RT for 1 hour with a magnetic stirrer, followed by continued stirring for another hour at a temperature of 45 ℃ until dissolved, then 0.15 g of PAAM was added to achieve a transparent solution. The resultant solution drops were placed on a clean Petri plate, which is made from plastic, and were left to dry in the air for four days at room temperature (RT). The nanofiller of Sb2O3 and varying proportions of CuO was prepared using the solution-casting method. A ceramic crucible and pestle were used to grind the nano mixture, with the aid of a quantity of absolute ethanol to facilitate mixing. Mixing continued for one hour, followed by three hours of drying at RT. After several experimental trials, suitable NC films were created using PVA-PAAM with 0.005 g Sb2O3 and varying proportions of (0.0075 g, 0.015 g, and 0.0225 g) CuO as listed in Table 1. In the same way, the prepared nanocomposite solutions were poured into plastic petri dishes, and then they were left at RT in the air for four days to dry completely. 90 ± 5 μm was the thickness of the created films, which was fixed by a Digital Vernier Caliper.
Table 1. Summarized the under-study films' content
|
Illustration |
PVA (g) |
PAAM (g) |
Sb2O3 (g) |
CuO (g) |
|
PVA-PAAM (S0) |
0.85 |
0.15 |
0 |
0 |
|
PVA-PAAM / Sb2O3-CuO (S1) |
0.83940 |
0.14813 |
0.005 |
0.0075 |
|
PVA-PAAM / Sb2O3-CuO (S2) |
0.83306 |
0.14700 |
0.005 |
0.015 |
|
PVA-PAAM / Sb2O3-CuO (S3) |
0.82670 |
0.14580 |
0.005 |
0.0225 |
2.3 Techniques
The field emission scanning electron microscope (FESEM) was used to study the morphological characteristics. A Bruker Fourier Transform Infrared (FT-IR) spectroscopy (Vertex 701) in 500-4000 cm-1 was applied for examining the chemical properties. UV-Vis has been applied to investigate the optical performance of the materials, such as absorbance and transmittance.
3.1 Fourier Transform Infrared examinations
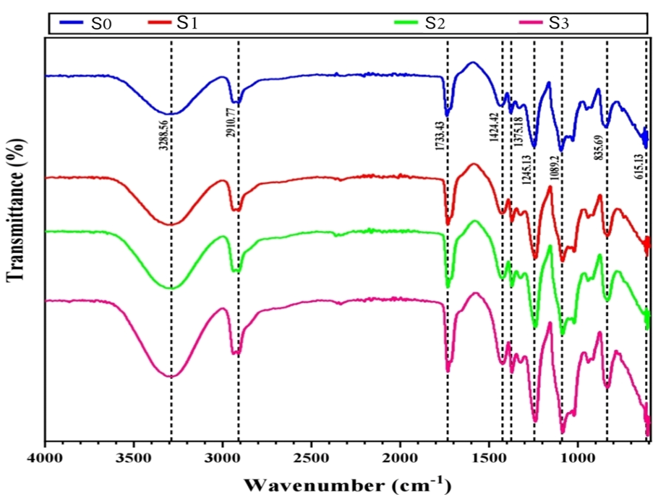
As represented in Figure 1, the absorption spectra of FT-IR for polymer blend S0 and polymer nanocomposites (PNCs) S1, S2, and S3 samples were between 500 and 4000 cm-1. The FT-IR absorption spectrum of S0 blended polymers indicates a good compatibility with a serial groups of 3288.56 cm⁻¹, 2910.77 cm⁻¹, 1733.43 cm⁻¹, 1424.42 cm⁻¹, 1375.18 cm⁻¹, 1245.13 cm⁻¹, 1089.2 cm⁻¹, 835.69 cm⁻¹ and weak peaks at 615.13 cm⁻¹, associated with hydroxyl groups' (–OH) extending throb as the cause of the broader band width [10], low-intensity band, indicative aliphatic C–H asymmetric stretching vibrational mode [11], C=O extending of the ester field carbonyl serials PVA [11], CH and OH bending, CH wagging vibration bands [10, 12], O-H ether group bending vibration [13], C–O stretching mode [14], CH2 wagging mode from PVA [15], peroxide C–O–O– stretching, and C–H stretching [10], in turn. FT-IR spectra reveal the functional groups present in polymer nanosystems. The slight shift in intensity and broadening of the FT-IR absorption bands upon integration of Sb₂O₃ and CuO NPs provide evidence of effective interfacial reactions between the polymer blend and the metal ions. In particular, the widening and intensity alteration of the –OH stretching band vibration (3288 cm⁻¹) demonstrate enhanced hydrogen bonding as a result of coordinating hydroxyl groups of Sb³⁺ and Cu²⁺ ions acting as acids, which weakens the O–H bond by redistribution of electron density. The minor variations in the C=O and C–O stretching vibrations also indicate the presence of dipole-dipole interactions between the oxygen-containing functional groups of both S0 and the nanofillers. No additional absorption bands are observed, although these systematic spectral changes prove the absence of new covalent bonds formed, which indicates better polymer-nanofiller compatibility and the establishment of interfacial charge-transfer interactions, which are consistent with the improvement in optical and dielectric properties in the NC system.
Figure 1. Fourier Transform Infrared (FT-IR) spectra of polymer blend S0, and polymer nanocomposites (PNCs) (S1, S2, and S3)
3.2 Field-emission scanning electron microscopy examinations
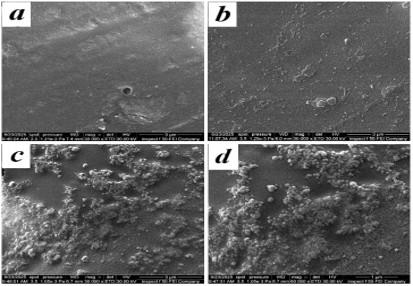
The filler dispersion, surface nature, and interfacial properties of the S0 and PNCs (S1, S2, and S3) samples were investigated using FESEM. Figure 2(a) shows a comparatively uniform and smooth surface, suggesting improved contact and high compatibility between the PVA and PAAM polymer chains. There are no obvious phase separations or surface flaws, indicating that a homogeneous polymeric matrix has formed. A uniform dispersion of the Sb2O3 and CuO NPs in the blend polymers was represented in Figures 2(c) and (d), which show acceptable homogeneity and some aggregation of the NPs at loading weights of the CuO from 0.015 g to 0.0225 g compared with the 0.0075 g as in Figure 2(b). Inferences can be drawn at optimal filler amounts; the nano Sb2O3-CuO fillers improve electrical conductivity by facilitating charge carrier movement and interfacial polarization. On the other hand, as Figures 2(c) and (d) show, excessive agglomeration at higher levels may produce charge trapping sites, restricting subsequent performance improvement.
Figure 2. The field-emission scanning electron microscopy (FESEM) micrographs of polymer blend S0 and polymer nanocomposites (PNCs) (S1, S2, and S3)
3.3 Optical properties
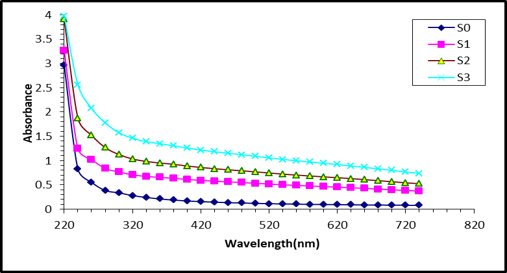
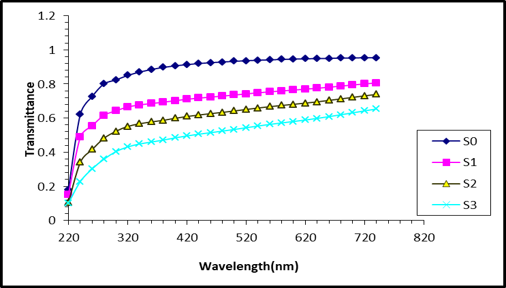
The optical properties of the polymer blend and PNCs, such as absorbance (A), transmittance (T), absorption coefficient (α), refractive index (n), optical energy gap ($\mathrm{E}_{\mathrm{g}}^{\text {opt}}$), real ɛ1 and imaginary ɛ2 dielectric constants, optical conductivity, and dispersion parameters have been synthesized by recording the absorbance spectra across the wavelength range (220-740 nm). Figures 3 and 4 represent the relationship between A and T with wavelength. The absorbance spectra of the S0 and PNCs (S1, S2, and S3) samples are at their highest in the ultraviolet (220–320 nm) region, then slightly decrease for the rest of the wavelength, while the transmittance increases with increasing wavelength until 320 nm. The increase thereafter decreases relatively for the remaining wavelengths. Regarding absorption spectra, this discovery may be attributed to the fact that photons in the ultraviolet region possess high energy. Consequently, electrons below the conduction band become excited as a result of absorbing these high-energy photons. In contrast, photons in the other regions (visible and near-infrared) have relatively lower energies, leading to weaker interactions with atoms, which prevents their complete absorption and allows them to pass through the material. The observed reduction in transmittance with increased addition rates is linked to aggregation, causing scattering losses, as shown in FESEM images. These findings make them appropriate for use as a coating for storing medicines regardless of cost, or for sunscreens and UV detector applications [16].
Figure 3. The absorbance spectra (A) of polymer blend S0, and polymer nanocomposites (PNCs) S1, S2, and S3 as a function of wavelength
Figure 4. The transmittance spectra (T) of polymer blend S0, and polymer nanocomposites (PNCs) S1, S2, and S3 as a function of wavelength
Optical absorption coefficient (α) is defined using the Swanepoel formula [17]:
$\alpha=2.303(\mathrm{~A} / \mathrm{t})$ (1)
where, t is the thickness of the sample.
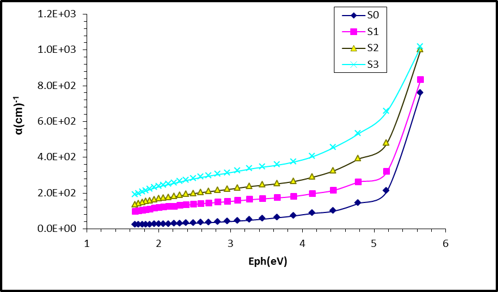
Figure 5 illustrates the dependence of α for S0 and PNCs (S1, S2, and S3) on photon energy (hυ); α enhances the duplicated features used to calculate the shape of electronic transitions. The α values shown in the figure are less than 104 cm−1, indicating that the electron transition between energy bands is indirect.
Figure 5. The absorption coefficient (α) of polymer blend S0, and polymer nanocomposites (PNCs) S1, S2, and S3 as a function of photon energy (hυ)
From the α calculation, Urbach tail energy (EU) is found depending on the relation 2 [18, 19].
$\ln \alpha=\ln \beta o+\frac{\mathrm{h} v}{\mathrm{E}_{\mathrm{U}}}$ (2)
Band gaps, both direct and indirect, are regarded with the hυ and α, as shown in the following Tauc relation [20]:
$(\alpha \mathrm{h} v)=B\left(\mathrm{~h} v-\mathrm{E}_{\mathrm{g}}^{\mathrm{opt}}\right)^{\mathrm{r}}$ (3)
where, B is the parameter for band tailing that varies depending on the type of material, $\mathrm{E}_{\mathrm{g}}^{\text {opt.}}$ represent the optical band gap, r is an exponential constant whose value depends on the type of electronic transition in the K space; r = 1/2 for allowed direct, and 1/3 for forbidden direct; r = 2 for allowed indirect, and 3 for forbidden indirect.
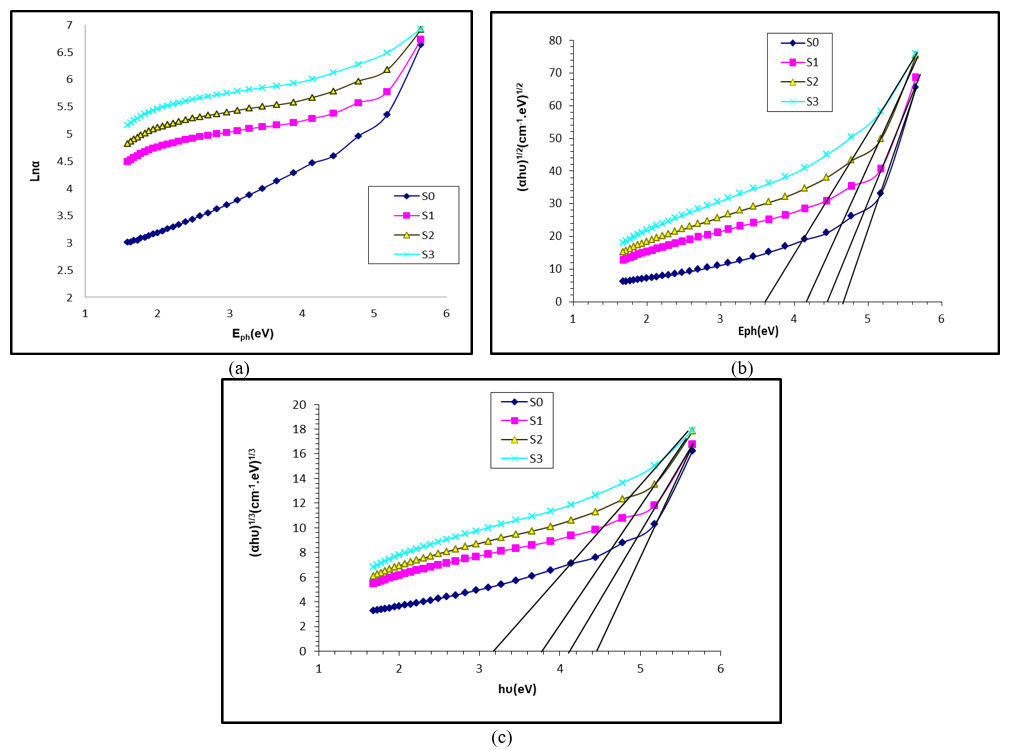
Figure 6(a) shows the EU values obtained by fitting the straight part of the graph, which is the inverse of its slope, respectively, 0.37 eV, 0.49 eV, 0.64 eV, and 1.07 eV for S0, and three different PNCs (S1, S2, and S3). The allowed and forbidden transition band gaps ($\mathrm{E}_{\mathrm{g} \text { indir}}^{\text {opt}}$) decreased from 4.68 eV and 4.32 eV for S0 to 3.6 eV and 2.65 eV for S3, as shown in Figures 6(b) and (c), as inserted in Table 2. The anarchic structure formed by the polymer chains upon solidification and the presence of Sb₂O₃ and CuO nanofillers lead to the formation of disordered atoms and structure-related defects that can lead to the emergence of local states that act as donor centers near the conduction band level, causing the Urbach tail to increase. Consequently, the $\mathrm{E}_{\mathrm{g}}^{\mathrm{opt}}$ decreases. This finding provides a positive indication for use in many optoelectronics devices, like photovoltaic cell applications.
Figure 6. (a) The Urbach energy $(\ln \alpha)$, (b) allowed energy gap $(\alpha \mathrm{h} v)^{1 / 2}$, and (c) forbidden $(\alpha \mathrm{h} v)^{1 / 3}$ polymer blend S0 , and polymer nanocomposites (PNCs) $\mathrm{S} 1, \mathrm{~S} 2$, and S3 as a function of photon energy (hv)
Table 2. The optical energy gap ($\mathrm{E}_{\mathrm{g}}^{\text {opt}}$) and Urbach tail energy (EU) of polymer blend S0, and polymer nanocomposites (PNCs) (S1, S2, and S3)
|
Films Type |
Allowed $\mathrm{E}_{\mathrm{g} \text {indir}}^{\text {opt}}$ (eV) |
Forbidden $\mathrm{E}_{\mathrm{g} \text {indir}}^{\text {opt}}$ (eV) |
EU (eV) |
|
S0 |
4.68 |
4.32 |
0.37 |
|
S1 |
4.46 |
4.00 |
0.49 |
|
S2 |
4.18 |
3.50 |
0.64 |
|
S3 |
3.60 |
2.65 |
1.07 |
The n and extinction coefficient (k) were estimated using the following [21]:
$n=\left(\frac{1+R}{1-R}\right)+\sqrt{\frac{4 R}{(1-R)^2}-K^2}$ (4)
$\mathrm{k}=\frac{\alpha \lambda}{4 \pi}$ (5)
where, R represents the optical medium reflectance.
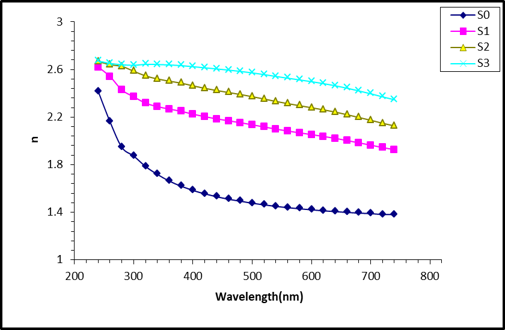
Figure 7 shows that the refractive index (n) varies with wavelength for the S0 and PNCs (S1, S2, and S3) films. The n values of the polymer blend and its PNCs gradually decrease along the photon wavelength under examination. Also, the n values of S0 rise with the addition of CuO nanofillers, which is due to the increase in the film's density [22].
Figure 7. Refractive index (n) of polymer blend S0, and polymer nanocomposites (PNCs) (S1, S2, and S3) as a function of wavelength
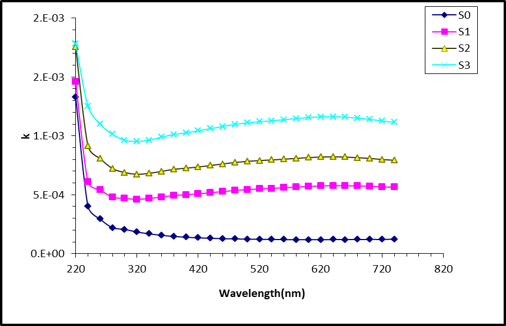
Figure 8 displays the variation of extinction coefficient (k) with wavelength for S0 and PNCs (S1, S2, and S3) at low wavelengths (220–240 nm), where the k values decrease sharply, after which they stay nearly constant. The sharp decrease in k is due to a group of factors, including electronic polarization, structural disorder, and the electronic band structure of the material. Also, the k values of the polymer blend rise with rising CuO nanofillers, which is due to the increase in film density [22].
Figure 8. Extinction coefficient (k) of polymer blend S0, and polymer nanocomposites (PNCs) (S1, S2, and S3) as a function of wavelength
The dielectric transmittance (real $\varepsilon_1$ and imaginary $\varepsilon_2$ ) of the optical regions of S0 films and their PNCs, S1, S2, and S3 were calculated from following equations [23]:
$\varepsilon_1=\mathrm{n}^2-k^2$ (6)
$\varepsilon_2=2 \mathrm{n} k$ (7)
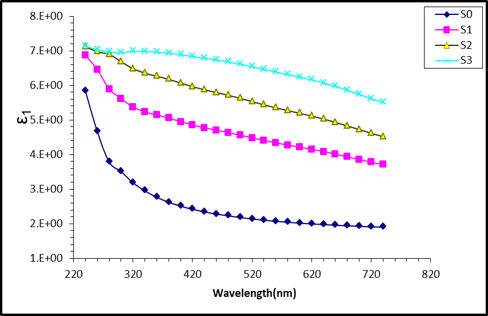
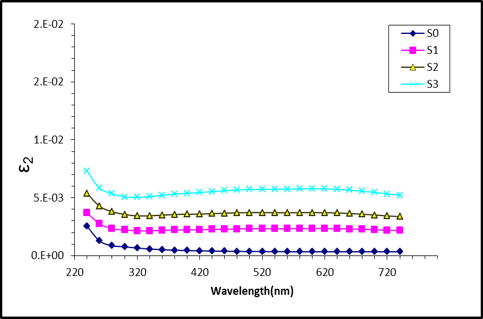
The variations in the real $\varepsilon_1$ and imaginary $\varepsilon_2$ of the dielectric constant for S 0 with $\mathrm{Sb}_2 \mathrm{O}_3$, along with the variation in CuO amount across different wavelengths, are shown in Figures 9 and 10. The results show that the dielectric constant of the PNC films shows a bigger value compared with S0 for all samples; this could mean that the PNCs are expected to become more polarizable, as enhanced by the added materials of $\mathrm{Sb}_2 \mathrm{O}_3-\mathrm{CuO}$ [24]. The value of $\varepsilon_1$ improved while the $\varepsilon_2$ value was very low, which shows that these films are very applicable in optical energy storage devices [18]. The plots describing $\varepsilon_1$ against hu have been used to study the values of $\mathrm{E}_{\mathrm{g} \text { indir}}^{\mathrm{opt}}$ and compare them with the results from Tauc's plots calculations, as presented in the listed scale stretched of Figure 10. The band gap results were 4.6, 4.34, 4.09 , and 3.5 eV, which align closely with the Tauc calculations.
Figure 9. Real dielectric constants (ε1) of polymer blend S0, and polymer nanocomposites (PNCs) (S1, S2, and S3) as a function of wavelength
Figure 10. Imaginary dielectric constants (ε2) of polymer blend S0, and polymer nanocomposites (PNCs) (S1, S2, and S3) as a function of wavelength
The optical conductivity (σop) has been specified using the following relation [21]:
$\sigma_{\mathrm{op}}=\frac{\alpha \mathrm{nc}}{4 \pi}$ (8)
where, c is the speed of light.
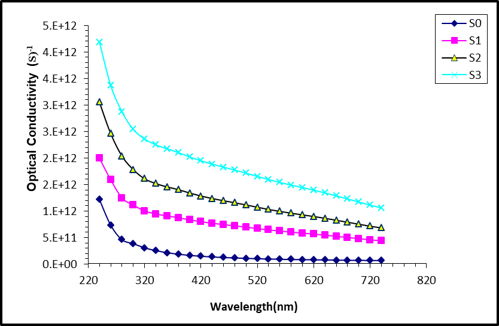
The relationship between σop and wavelength for S0 with S1, S2, and S3 PNCs is shown in Figure 11. σop can be noticed as an increase in the UV region. The σop was determined to transmit in the Vis and NIR ranges. The augmentation of inorganic filler quantity leads to an elevation in the density of functionalized conditions; nevertheless, the forbidden energy gap, hence boosting α and subsequently σop [25].
Figure 11. Optical conductivity σop of polymer blend S0, and polymer nanocomposites (PNCs) (S1, S2, and S3) as a function of wavelength
3.4 Parameters of dispersion energy
The dispersion energy (Ed) parameters are very important in defining the optical properties of the materials. They allow determining the critical parameters required to design an optical communication device and generate wide-spectrum dispersion. Therefore, the energy states of the saturated S0 and S0-doped Sb2O3, and increasing the amount of CuO, need to be investigated regarding the oscillator energy in single-mode E0 and Ed. Tail-width confined levels near the conduction/valence band can substantially affect optical absorption, possibly decreasing the band gap. The Urbach energy may increase, whereas these tail states have the least impact for the Eo level. The Wemple-DiDomenico model suggests the study of Eo (or average band gap, which offers quantitative information concerning the overall band structure of the material), and Ed (which measures the extent of strength of inter-band transitions change), using a single oscillator. This model explains how two different energy levels are associated with the energy of a photon (hʋ). The model of Wemple-DiDomenico could be theoretically expressed in the equation below [26]:
$\left(n^2-1\right)^{-1}=\frac{E_o}{E_d}-\frac{1}{E_o E_d}(h v)^2$ (9)
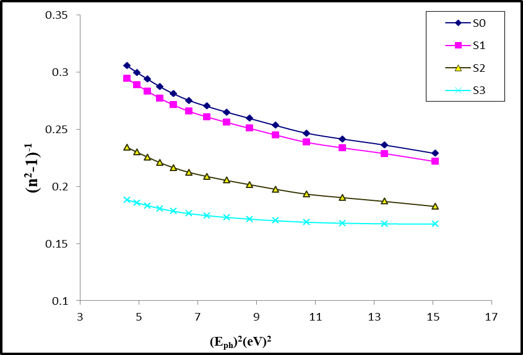
Figure 12 shows a straight-line plot of (n2 - 1)-1 versus (hʋ)2. The slope and y-intercept of this line correspond to (1 / EdEo), and (Eo / Ed), respectively. The resulting (Eo, Ed) values as shown in Table 3. The addition of Sb2O3 NP and increasing CuO NPs content within the S0 lead to a reduction of Eo values, which is related to the shrinking of the energy gap. This trend signifies a shift from interband transitions toward lower-energy, defect-assisted and charge-transfer–mediated processes that are a result of polymer-nanofiller interfacial conditions. Conversely, it is observed that Ed values increase, which indicates that the incorporation of Sb2O3 and CuO NPs enhanced the optical intensity (a strengthening of interband transition probabilities) [27]. This improvement is physically associated with the effective coordination number, electronic polarizability, and valence-electron density provided by the metal-oxygen bonds of the nanofillers. Consequently, the observed decrease in E₀ coupled with the increase in Ed indicates that the interaction between S0 and the nano‑Sb₂O₃ incorporated with CuO Nps is intensified, thereby rendering the nanocomposite promising for applications in optical waveguides, modulators, and components of photonic communication systems.
Figure 12. $\left(n^2-1\right)^{-1}$ vs. $(\mathrm{hv})^2$ of polymer blend S 0 , and polymer nanocomposites $(\mathrm{PNCs})$ (S1, S2, and S3)
Moreover, the calculation of refractive index in static form (ns) with dielectric constant (εs) can be performed using the values of Eo and Ed. One can find these values by substituting (hʋ)2 = 0 in Eq. (9) of DiDomenico, which becomes:
$\varepsilon_s=n_s^2=1+\frac{E_d}{E_o}$ (10)
The values of εs and ns are calculated and presented in Table 3. These parameters increased as the weight quantity of CuO in the S0 system increased. Based on Eq. (8), the oscillator strength (fo) = (Eo × Ed) [28]. The fo parameter values obtained are shown in Table 3.
$\mathrm{f}_{\mathrm{o}}=\mathrm{E}_{\mathrm{o}} \mathrm{E}_{\mathrm{d}}$ (11)
The results revealed a significant rise with the addition of Sb2O3 and an increase in CuO NPs loading. Besides, using (Ed and Eo), one can calculate the optical moments M-1 and M-3 of optical spectra for the PNCs. These parameters have been calculated using the following equations [29]:
$\mathrm{E}_{\mathrm{o}}^2=\frac{\mathrm{M}_{-1}}{\mathrm{M}_{-3}}$ (12)
$\mathrm{E}_{\mathrm{d}}^2=\frac{\mathrm{M}_{-1}^3}{\mathrm{M}_{-3}}$ (13)
By rearranging these equations, we get the following:
$M_{-1}=\frac{E_d}{E_o}$ (14)
$\mathrm{M}_{-3}=\frac{\mathrm{M}_{-1}}{\mathrm{E}_{\mathrm{o}}^2}$ (15)
Increasing CuO concentration from 0.0075 g to 0.0225 g also resulted in an increase in the optical moments, which supports the boost in the optical transitions.
Table 3. Optical parameters of polymer blend S0, and polymer nanocomposites (PNCs) S1, S2, and S3
|
Films Type |
Eo |
Ed (eV) |
$E_{\text {g indir}}^{\text {opt}}$ (eV) |
ns |
ɛs |
M-1 |
M-3 × 10⁻² (eV)-2 |
fo (eV)2 |
|
S0 |
4.79 |
2.59 |
4.68 |
1.24 |
1.54 |
0.54 |
0.23 |
12.4 |
|
S1 |
4.27 |
3.17 |
4.46 |
1.32 |
1.74 |
0.74 |
0.14 |
13.5 |
|
S2 |
4.06 |
8.02 |
4.18 |
1.72 |
2.98 |
1.97 |
12 |
32.6 |
|
S3 |
3.92 |
10.19 |
3.6 |
1.9 |
3.6 |
2.59 |
19 |
39.9 |
The study developed composite nanomaterials with unique properties that significantly surpass those of their individual components. FT-IR spectroscopy confirmed strong interactions between the polymer blend and nanofillers in the prepared matrix. FESEM images reveal improved contact and high compatibility between the PVA and PAAM polymer chains, as well as uniform dispersion of the Sb2O3 and CuO NPs in the polymeric blend. The highest absorbance values for PNCs in the UV region appear suitable for optoelectronic applications as a coating for storing medicines, sunscreens, and UV detectors. The validity of the allowed Tauc calculations was verified after comparison with the indirect energy gap calculations using the imaginary dielectric constant method. Increasing the energy of the Urbach tail energy (EU) means increasing the degree of structural disorder and the formation of local energy levels within the energy gap, which facilitates electron transitions at lower energies. The dispersion energy (Ed), static index of refraction (nₛ), static dielectric constant (εₛ), oscillator strength (fₒ), and optical spectra (M₋₁ and M₋₃) exhibit an increase after adding the nanofillers in the blend polymer matrix. In contrast, the single-oscillator energy (Eo) shows a decrease. These findings give a clear picture of the improved optical-electrical function of the material.
[1] Attia, A.A., Hashim, F.S., Haneen Abass, K. (2023). Fabrication and characterization of p-Sb2O3: CuO/n-Si solar cell via thermal evaporation technique. International Journal of Nanoscience, 22(3): 2350023. https://doi.org/10.1142/S0219581X23500230
[2] Akinay, Y., Celik Kazici, H., Akkuş, I.N., Salman, F. (2021). Synthesis of 3D Sn doped Sb2O3 catalysts with different morphologies and their effects on the electrocatalytic hydrogen evolution reaction in acidic medium. Ceramics International, 47(20): 29515-29524. https://doi.org/10.1016/j.ceramint.2021.07.278
[3] Kokkalas, D.E., Bikiaris, D.N., Karayannidis, G.P. (1995). Effect of the Sb2O3 catalyst on the solid-state postpolycondensation of poly (ethylene terephthalate). Journal of Applied Polymer Science, 55(5): 787-791. https://doi.org/10.1002/app.1995.070550516
[4] Qassim, Z., Al-Ogaili, A.O.M., Abass, K.H. (2022). Morphology of copper oxide nano-layer prepared via thermal evaporation technique. NeuroQuantology, 20(3): 87-94. https://doi.org/10.14704/nq.2022.20.3.NQ22046
[5] Qassim, Z., Mousa Al-Ogaili, A.O., Haneen Abass, K. (2024). Enhancement of CuO/Si solar cell efficiency by Cu2O doping prepared via thermal evaporation technique. Nano, 19(14): 2450085. https://doi.org/10.1142/S1793292024500851
[6] Slimani, H., Nkele, A.C., Dagher, S., et al. (2024). Investigating the optical properties of antimony oxide, Sb2O3 nanomaterials synthesized by spray pyrolysis. Optical Materials, 157: 116405. https://doi.org/10.1016/j.optmat.2024.116405
[7] Ibrahim, M., Eseyin, E.A., Gungshik, J.R., Ankwai, G.E. (2024). The applications of flame retardants; types and characteristics for polymeric and allied materials. Chemistry Research Journal, 9(1): 32-49.
[8] Huerta-Flores, A.M., Torres-Martínez, L.M., Moctezuma, E., Carrera-Crespo, J.E. (2018). Novel SrZrO3-Sb2O3 heterostructure with enhanced photocatalytic activity: Band engineering and charge transference mechanism. Journal of Photochemistry and Photobiology A: Chemistry, 356: 166-176. https://doi.org/10.1016/j.jphotochem.2017.12.049
[9] Mohamed, Z.Q., Jabbar, S.A., Abass, K.H., Naser, B.A. (2025). Preparation and synthesis of SnS-Doped CdS nanoparticles for solar cell application. Revue des Composites et des Materiaux Avances, 35(3): 471. https://doi.org/10.18280/rcma.350308
[10] Abbas, M.Y., Hashim, F.S. (2024). Electrospinning preparation of PVP/Ni2O3 nanofibers: Characterization and antibacterial studies. AIP Conference Proceedings, 3229(1): 110007. https://doi.org/10.1063/5.0236097
[11] Mahendia, S., Tomar, A.K., Chahal, R.P., Goyal, P., Kumar, S. (2011). Optical and structural pvvroperties of poly (vinyl alcohol) films embedded with citrate-stabilized gold nanoparticles. Journal of Physics D: Applied Physics, 44(20): 205105. https://doi.org/10.1088/0022-3727/44/20/205105
[12] Abdelamir, A.I., Al-Bermany, E., Hashim, F.S. (2020). Important factors affecting the microstructure and mechanical properties of PEG/GO-based nanographene composites fabricated applying assembly-acoustic method. AIP Conference Proceedings, 2213(1): 020110. https://doi.org/10.1063/5.0000175
[13] El Nemr, A., Serag, E., El-Maghraby, A., Fathy, S.A., Abdel Hamid, F.F. (2019). Manufacturing of pH sensitive PVA/PVP/MWCNT and PVA/PEG/MWCNT nanocomposites: An approach for significant drug release. Journal of Macromolecular Science, Part A, 56(8): 781-793. https://doi.org/10.1080/10601325.2019.1607377
[14] Amiri, H., Mohsennia, M. (2017). Impedance study of PVA/PEG/LiClO4/TiO2 nanocomposite solid polymer blend electrolyte. Journal of Materials Science: Materials in Electronics, 28(6): 4586-4592. https://doi.org/10.1007/s10854-016-6095-8
[15] Jassim, H.H., Hashim, F.S. (2022). Synthesis of (PVA/PEG: ZnO and Co3O4) nanocomposites: Characterization and antibacterial studies. AIP Conference Proceedings, 2398(1): 020033. https://doi.org/10.1063/5.0096112
[16] Rasheed, M.H., Hashim, F.S., Abass, K.H. (2023). Impact of Ag nanoparticles on the spectral and optical properties of electrospun nanofibrous poly (vinyl alcohol)–poly (acrylamide). International Journal of Nanoscience, 22(3): 2350025. https://doi.org/10.1142/S0219581X23500254
[17] Abdelamir, A.I., Hashim, F.S. (2025). Solvothermal synthesis of CZTS nano-structure based-electrospun PAN nanofibers impact on characterizations and antibacterial activity. Nano-Structures & Nano-Objects, 43: 101517. https://doi.org/10.1016/j.nanoso.2025.101517
[18] Khaleel, M.R., Hashim, F.S., Alkhayatt, A.H.O. (2024). Preparation, characterization and the antibacterial activity of PVA-PVP/Co3O4 nanofiber films via indigenous electrospinning setup. AIP Conference Proceedings, 3229(1): 090002. https://doi.org/10.1063/5.0237178
[19] Tauc, J., Menth, A., Wood, D.L. (1970). Optical and magnetic investigations of the localized states in semiconducting glasses. Physical Review Letters, 25(11): 749. https://doi.org/10.1103/PhysRevLett.25.749
[20] Hashim, F.S., Idres, S.H., Tuama, A.N., Abdali, K. (2024). Microstructure, optical, and antibacterial features of PVP/Cu2O electrospun nanofibers for optoelectronics and biological purposes. Journal of Inorganic and Organometallic Polymers and Materials, 34(11): 5342-5350. https://doi.org/10.1007/s10904-024-03201-5
[21] Ghazi, R.A., Al-Mayalee, K.H., Al-Bermany, E., Hashim, F.S., Albermany, A.K.J. (2022). Impact of polymer molecular weights and graphene nanosheets on fabricated PVA-PEG/GO nanocomposites: Morphology, sorption behavior and shielding application. AIMS Materials Science, 9(4): 584-603. https://doi.org/10.3934/matersci.2022035
[22] Wadatkar, N.S., Waghuley, S.A. (2015). Complex optical studies on conducting polyindole as-synthesized through chemical route. Egyptian Journal of Basic and Applied Sciences, 2(1): 19-24. https://doi.org/10.1016/j.ejbas.2014.12.006
[23] Sheehab, N.T., Hashim, F.S., Al-Bermany, E., Obaid, A.N., Abdali, K., Alkhayatt, A.H.O. (2025). Performance of TiO2-SiC nanomaterials on morphology and sorption behavior of PVA-PEG-based nanocomposites for UV-applications and antibacterial efficacy. Nano-Structures & Nano-Objects, 42: 101479. https://doi.org/10.1016/j.nanoso.2025.101479
[24] Abdul Hamza, R.S., Oreibi, I., Habee, M.A. (2024). Enhancement structural properties and optical energy gap of PVA–ZrO2–CuO nanostructures for optical nanodevices. Nanosistemi, Nanomateriali, Nanotehnologii, 22(2): 379-390. https://doi.org/10.15407/nnn.22.02.379
[25] Hashim, F.S., Jabbar, S.A., Al-Bermany, E., Abdali, K. (2025). Effect of inclusion ZnO-Co3O4 nanoparticles on the microstructural and optical properties of PVA-CMC polymeric blend for biomedical, UV shielding, and nuclear radiation shielding applications. Plasmonics, 20(3): 1629-1641. https://doi.org/10.1007/s11468-024-02379-1
[26] Wemple, S.H., DiDomenico Jr, M. (1971). Behavior of the electronic dielectric constant in covalent and ionic materials. Physical Review B, 3(4): 1338. https://doi.org/10.1103/PhysRevB.3.1338
[27] Abdelamir, A.I., Hashim, F.S. (2025). Tuning the morphological and dispersion parameters of electrospun PAN/CZTS nanofibers as a potential candidate for advanced optoelectronic applications. Journal of Sol-Gel Science and Technology, 115: 998-1014. https://doi.org/10.1007/s10971-025-06765-x
[28] Alshammari, A.H., Alshammari, M., Alshammari, K., Allam, N.K., Taha, T.A. (2023). PVC/PVP/SrTiO3 polymer blend nanocomposites as potential materials for optoelectronic applications. Results in Physics, 44: 106173. https://doi.org/10.1016/j.rinp.2022.106173
[29] Das, S., Alagarasan, D., Ganesan, R., Naik, R. (2024). Time-dependent 532 nm laser irradiation for tuning in optical, structural, and surface wettability changes of Te/In2Se3 thin films for optoelectronic applications. Surfaces and Interfaces, 53: 105029. https://doi.org/10.1016/j.surfin.2024.105029