Khairulla Ismailov | Murodil Madaliev* | Bakhtiyar Ismailov | Alua Shambilova | Aleksandr Volnenko
© 2026 The authors. This article is published by IIETA and is licensed under the CC BY 4.0 license (http://creativecommons.org/licenses/by/4.0/).
OPEN ACCESS
This study presents a numerical investigation of turbulent gas flow in a packed column with lateral gas injection using the Reynolds-averaged Navier-Stokes (RANS) Shear Stress Transport (SST) turbulence model implemented in ANSYS Fluent. The influence of guide plates on the gas-flow characteristics was evaluated by comparing a conventional column configuration with a modified design. The numerical results indicate that the conventional configuration is characterized by non-uniform flow distribution and the presence of recirculation regions, whereas the modified configuration predicts smaller recirculation regions and a more uniform time-averaged velocity field. The incorporation of guide plates results in a moderate increase in pressure drop, from 117 Pa to 140 Pa, while improving the predicted gas-flow distribution under the investigated operating conditions. Comparison with available experimental pressure-drop data showed satisfactory agreement for the investigated conditions. The predicted velocity redistribution and recirculation characteristics should be interpreted as numerical predictions of the steady-state RANS SST model. The proposed numerical approach provides a useful tool for analyzing and optimizing gas-flow distribution in packed-column apparatuses.
computational fluid dynamics modelling, ANSYS Fluent, Reynolds-averaged Navier-Stokes, Shear Stress Transport, turbulent flow, guide plates
Modern gas-liquid column apparatuses play a crucial role in a wide range of industrial processes, including chemical production, oil and gas refining, power engineering, and environmental protection systems [1-3]. The efficiency and reliability of such systems are largely determined by the hydrodynamic structure of the flow, which governs phase interaction, mixing intensity, and the overall stability of operation. Consequently, improving flow distribution and minimizing hydrodynamic non-uniformities remain key challenges in the design and optimization of column equipment.
In practical applications, gas–liquid contact is achieved through various mechanisms, such as bubbling, film flow, and droplet dispersion, all of which are strongly influenced by the internal flow structure. The presence of internals, including plates, packings, and flow-guiding elements, significantly affects the redistribution of gas flow and the formation of vortex structures. In particular, non-uniform gas distribution caused by lateral injection or geometric constraints can lead to the formation of recirculation zones, flow bypassing, and reduced effectiveness of the apparatus. Therefore, detailed analysis of hydrodynamic behavior is essential for understanding and improving the performance of such systems.
Traditionally, the investigation of gas–liquid systems has relied on experimental methods and empirical correlations. While these approaches provide valuable insights, they are often limited in their ability to capture detailed flow structures, especially in complex geometries. Parameters such as local velocity distribution, vorticity, and turbulence characteristics are difficult to measure experimentally with sufficient spatial resolution. As a result, the application of computational fluid dynamics (CFD) has become increasingly important for the analysis and design of column apparatuses.
CFD methods enable detailed numerical investigation of flow behavior, allowing the prediction of velocity fields, turbulence characteristics, and flow non-uniformities within industrial-scale equipment. Previous studies have demonstrated the effectiveness of CFD for analyzing gas distribution and hydrodynamic performance in packed columns and related systems [4-8]. In particular, numerical simulations provide insight into the formation of recirculation zones and the influence of internal elements on flow redistribution.
In this context, mathematical modeling based on the Reynolds-averaged Navier-Stokes (RANS) equations remains one of the most widely used approaches, offering a practical compromise between computational efficiency and predictive accuracy [9-14]. RANS-based models describe turbulent flows by averaging their properties in time and space, making it possible to simulate complex three-dimensional flow structures without resolving all turbulent scales. However, the accuracy of such models strongly depends on the chosen turbulence closure.
Among the available turbulence models, the Shear Stress Transport (SST) model proposed by Menter [15] has proven to be particularly effective for engineering applications involving adverse pressure gradients, flow separation, and complex streamline curvature. By combining the advantages of the k–ε and k–ω formulations, the SST model provides improved accuracy in near-wall regions while maintaining robustness in the free-stream flow. These features make it well suited for the simulation of gas flow in column apparatuses with internal structures.
Despite significant progress in CFD modeling, studies specifically addressing the role of flow-guiding elements in column apparatuses remain relatively limited. For example, Fu et al. [16] developed a CFD model to investigate countercurrent flow in a packed column, focusing primarily on liquid holdup and phase distribution. However, the influence of guiding elements on gas flow redistribution and vortex suppression was not examined in detail. Similarly, Guardo-Zabaleta et al. [17] performed a comparative analysis of turbulence models in packed beds, demonstrating their impact on velocity and pressure fields. Nevertheless, these studies do not consider the effect of guide plates on mitigating flow maldistribution and improving flow uniformity. Therefore, there is a clear need for a detailed numerical investigation of gas flow behavior in column apparatuses with flow-guiding elements. In particular, understanding how such elements influence velocity distribution, vortex structures, and overall hydrodynamic stability is essential for improving the design of industrial systems.
In recent years, CFD has been increasingly applied to investigate gas-flow distribution, pressure drop, and hydrodynamic behavior in packed columns and other process equipment. Recent studies have demonstrated that optimized packing geometries, gas distributors, and internal flow-conditioning devices can significantly improve flow uniformity and reduce flow maldistribution under turbulent operating conditions. Furthermore, advances in turbulence modeling, particularly the application of the SST model, have enhanced the prediction accuracy of complex separated flows in chemical engineering systems. Despite these developments, detailed numerical investigations of packed columns with lateral gas injection incorporating flow-guiding plates remain limited. Therefore, the present study aims to address this gap by evaluating the influence of guide plates on velocity redistribution, vortex suppression, and pressure loss using the RANS SST turbulence model.
The scientific contribution of this work can be summarized as follows: (a) A modified column apparatus design incorporating a system of flow-guiding plates is proposed to improve gas flow redistribution within the packing zone; (b) A three-dimensional numerical analysis of turbulent gas flow in a packed column with lateral injection is performed using the RANS SST turbulence model, with particular focus on velocity distribution and recirculation behavior; (c) The effect of guide plates on flow stabilization, reduction of vortex intensity, and improvement of velocity uniformity along the column height is quantitatively evaluated; (d) It is demonstrated that, despite a moderate increase in hydraulic resistance, the proposed modification leads to a more uniform and stable flow structure, indicating improved hydrodynamic performance of the apparatus. Overall, the study provides a detailed assessment of gas flow redistribution mechanisms in column apparatuses and demonstrates the applicability of the RANS SST approach for analyzing and optimizing their hydrodynamic behavior.
The design of apparatuses for the physical and chemical processing of gas-liquid systems has reached a relatively high level of technological maturity. To ensure effective gas–liquid contacting, various operational modes are employed, including gas bubbling through liquids, film flow along surfaces in the presence of a gas stream, and dispersion of liquids into droplets within a gas flow. These processes are governed by the hydrodynamic behavior of the interacting phases. A distinctive feature of such systems is the use of hydrodynamic mechanisms, such as liquid dispersion driven by the kinetic energy of an upward gas flow. Typical structural elements include horizontal, vertical, and inclined trays or plates, zigzag baffles, grids, spheres, cylinders, and other internals. These elements influence the flow structure, vortex formation, phase interaction patterns, and energy dissipation within the apparatus. However, many previous studies of such systems have relied predominantly on experimental observations or simplified empirical approaches. These methods do not provide detailed information about velocity fields, vorticity, turbulent kinetic energy, or the structure of turbulent fluctuations throughout the flow domain. Moreover, comprehensive studies that consistently couple hydrodynamic analysis with other transport processes remain limited. In this context, the application of CFD methods enables detailed investigation of flow behavior and provides a deeper understanding of the hydrodynamic mechanisms governing gas-liquid systems.
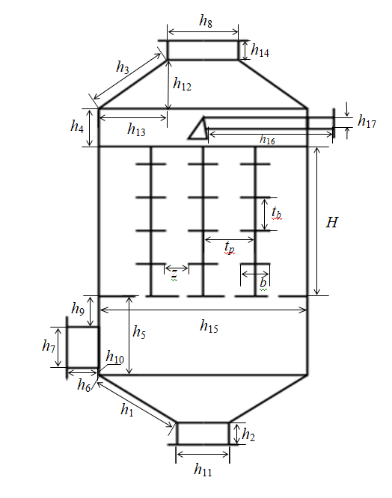
Note: The geometric dimensions of the structural elements are specified in millimetres as follows: h1 = 500, h2 = 100, h3 = 500, h4 = 600, h5 = 800, h6 = 150, h7 = 600, h8 = 800, h9 = 150, h10 = 50, h11 = 600, h12 = 490, h13 = 100, h14 = 100, h15 = 1000, h16 = 700, h17 = 50, H = 1000, b = 50, tb = 100, tp = 100, z = 75.
2.1 Geometry of the base column model with plate-type packing
Two configurations of the column apparatus are considered in this study. The base configuration incorporates a regular plate-type packing and is designed to ensure effective gas-liquid contact within the apparatus (Figure 1) [18, 19].
Figure 1. Schematic diagram of the base apparatus model with plate-type packings
The free ends of the plates promote the formation of vortex structures within the flow, contributing to enhanced mixing and more complex flow patterns without the use of external mechanical energy input. The proposed design ensures stable operating conditions while maintaining moderate hydraulic resistance. Owing to these characteristics, the base configuration can be effectively applied in absorbers, scrubbers, and gas-cleaning units, where controlled gas–liquid interaction and reliable hydrodynamic performance are required.
2.2 Design of the modified column apparatus with plate-type packing
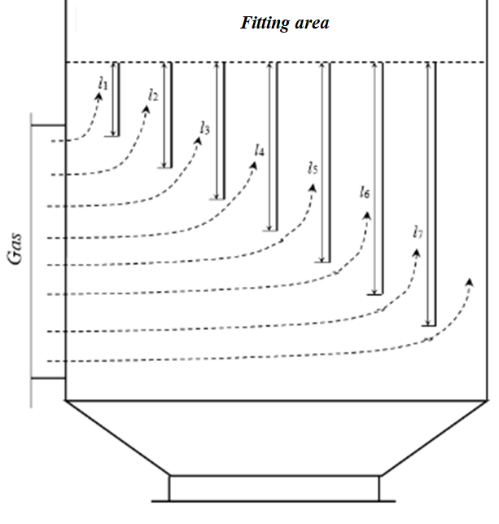
Previous studies have shown that flow-distribution devices and internal flow-conditioning elements can be used to improve flow uniformity in column apparatuses [20]. In the present study, the modified apparatus geometry is based on the patented design developed in Innovation Patent of the Republic of Kazakhstan No. 25541. To analyze this behavior, numerical simulations of turbulent gas flow in the packed column were performed using the RANS equations with an appropriate turbulence model, accounting for the influence of turbulent fluctuations on the mean flow. Such hydrodynamic non-uniformity adversely affects flow stability and leads to the formation of recirculation zones and uneven flow distribution. To address this issue, flow-conditioning devices can be employed to redistribute the incoming flow and improve flow uniformity [20]. The specific arrangement of the flow-straightening plates investigated in the present work follows the geometry described in Kazakhstan Innovation Patent No. 25541. Figure 2 illustrates the configuration of the proposed flow-straightening device integrated into the inlet region of the column apparatus.
Figure 2. Schematic of the flow-straightening plates in the inlet section of the modified column apparatus
The overall geometric dimensions of the modified model remain identical to those of the base configuration shown in Figure 1, ensuring direct comparability of hydrodynamic performance. The guide plates are arranged sequentially along the flow direction, with their lengths defined by the relation Eq. (1):
$l_i=175+(i-1) h, \quad i=1,2, \ldots 7$ (1)
where, $l_i$ denotes the length of the i-th guide plate and h = 75 mm. This arrangement promotes gradual redistribution and alignment of the incoming gas flow, mitigating excessive lateral momentum and suppressing the formation of large-scale recirculation zones in the lower part of the apparatus. As a result, the modified configuration provides a more uniform gas supply to the packing zone and improves the overall hydrodynamic conditions within the column.
The plate-type packing was modeled explicitly using its actual geometric configuration; no porous-medium approximation was employed. The computational domain included all guide plates with their physical dimensions. Each plate had a thickness of 2 mm, while the plate lengths varied from 175 mm to 625 mm depending on their position within the column. The spacing between adjacent plates was maintained at 125 mm throughout the packing section. These geometric parameters correspond to the design of the investigated column apparatus and were directly incorporated into the CFD model. The present numerical model considers only single-phase gas flow. The working fluid was air, and the simulations were performed under steady-state conditions using the RANS SST turbulence model. Gas-liquid interactions, liquid holdup, interfacial momentum transfer, and other two-phase hydrodynamic phenomena were not included in the present study. Therefore, the numerical results represent the predicted characteristics of the gas-phase flow within the investigated packed column.
Most chemical engineering processes in gas-liquid systems are carried out at flow velocities corresponding to the turbulent regime. To date, there is no single universally accepted theoretical framework that fully describes turbulent gas motion. Nevertheless, a number of studies have demonstrated that, by introducing reasonable simplifying assumptions, it is possible to obtain results that adequately represent processes in which one or more phases exhibit turbulent behavior. One of the well-established approaches for describing turbulent motion is the Spalding-Patankar method, which has been successfully applied to a wide range of practically important problems, such as the flow of reacting gas mixtures in ducts and pipes. In many cases, the numerical results obtained using this approach show good agreement with experimental data.
The development of a mathematical model that is adequate for the problem under consideration is a crucial, though not exclusive, stage of comprehensive modeling in chemical engineering. A characteristic feature of modern research on processes and apparatuses is the increasing mathematization of physical analysis and the extensive use of mathematical modeling techniques. Accordingly, a key challenge lies in the formulation of sufficiently general numerical methodologies for investigating problems expressed as systems of equations of mathematical physics. These systems form the core of most models describing hydrodynamics and mass transfer in chemical engineering processes and equipment. In the present study, numerical simulation of the flow was performed using an approach based on the RANS equations. Within the RANS framework, flow variables are decomposed into mean and fluctuating components, which makes it possible to account for the effects of turbulence without explicitly resolving all turbulent scales. The averaging procedure yields a set of equations governing the dynamics of the mean quantities, supplemented by additional terms-Reynolds stresses that represent the influence of turbulent fluctuations on the averaged flow. Closure of this system is achieved through the application of the SST turbulence model. Such an approach allows, to varying degrees, the effects of flow separation, turbulence anisotropy, and streamline curvature to be captured. The conservation equations of mass and momentum, which describe the variation of the fluid velocity under the action of external and internal forces, can be written as Eq. (2):
$\left\{\begin{array}{l}\frac{\partial \bar{u}_i}{\partial x_i}=0 \\ \frac{\partial \bar{u}_i}{\partial t}+\bar{u}_j \frac{\partial \bar{u}_i}{\partial x_j}=-\frac{1}{\rho} \frac{\partial \bar{p}}{\partial x_i}+v \frac{\partial^2 \bar{u}_i}{\partial x_j \partial x_i}+\frac{1}{\rho} \frac{\partial}{\partial x_i}\left(2 \mu_t\left(S_{i j}-\left(\frac{\partial u_k}{3 \partial x_k}\right) \delta_{i j}\right)-\frac{2}{3} \rho k \delta_{i j}\right)\end{array}\right.$ (2)
where, $\bar{u}_i$ is the component of the mean velocity field, $\bar{p}$ is the mean pressure, v-denotes the kinematic viscosity, and $\rho$ is the fluid density.
3.1 Turbulence models: Shear Stress Transport model
The SST turbulence model proposed by Menter [15] represents an advanced two-equation formulation that combines the advantages of the k-ε and k-ω models. The core concept of the SST approach lies in the use of a hybrid scheme: in the near-wall region, the k-ω formulation is employed, providing high accuracy in boundary layers, while in the outer regions of the flow it automatically transitions to the k-ε model, which is more robust under free-stream conditions. The SST model is practically identical to the original formulation developed by Menter [21-24]; the differences are limited to a single model constant (σk1) and the expression used for the turbulent viscosity. The two-equation SST model, written in conservative form, can be expressed as follows Eq. (3):
$\left\{\begin{array}{l}\frac{\partial(\rho k)}{\partial t}+\frac{\partial\left(\rho u_j k\right)}{\partial x_j}=P-\beta^* \rho \omega k+\frac{\partial}{\partial x_j}\left[\left(\mu+\sigma_k \mu_t\right) \frac{\partial k}{\partial x_j}\right] \\ \frac{\partial(\rho \omega)}{\partial t}+\frac{\partial\left(\rho u_j \omega\right)}{\partial x_j}=\frac{\gamma}{v_t} P-\beta \rho \omega^2+\frac{\partial}{\partial x_j}\left[\left(\mu+\sigma_\omega \mu_t\right) \frac{\partial \omega}{\partial x_j}\right]+2\left(1-F_1\right) \frac{\rho \sigma_{\omega 2}}{\omega} \frac{\partial k}{\partial x_j} \frac{\partial \omega}{\partial x_j}\end{array}\right.$ (3)
The production term P is defined as Eq. (4):
$\begin{aligned} P= & \tau_{i j} \frac{\partial u_i}{\partial x_j}, \tau_{i j}=\mu_t\left(2 S_{i j}-\frac{2}{3} \frac{\partial u_k}{\partial x_k} \delta_{i j}\right)-\frac{2}{3} \rho k \delta_{i j}, S_{i j}=\frac{1}{2}\left(\frac{\partial u_i}{\partial x_j}+\frac{\partial u_j}{\partial x_i}\right)\end{aligned}$ (4)
The turbulent (eddy) viscosity is calculated according to Eq. (5):
$\mu_t=\frac{\rho a_1 k}{\max \left(a_1 \omega, \Omega F_2\right)}$ (5)
Each model constant is expressed as a blending of the near-wall (1) and free-stream (2) constants using the relation Eq. (6):
$\phi=F_1 \phi_1+\left(1-F_1\right) \phi_2$ (6)
where, F1 and F2 are the standard blending functions of the SST model. The remaining coefficients and auxiliary functions used in the model are presented in detail in the corresponding reference sources.
3.2 Boundary conditions
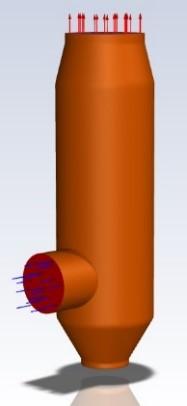
For both apparatus configurations considered in this study, identical boundary conditions were specified in the ANSYS Fluent environment to ensure direct comparability of the numerical results. At the inlet (Figure 3), a Velocity Inlet boundary condition was imposed with an air velocity of 11.1 m/s, oriented normal to the inlet surface. Turbulence quantities were defined using the intensity and hydraulic diameter method, with a turbulence intensity of 5% and a hydraulic diameter of 0.6 m.
Figure 3. Schematic representation of the boundary conditions applied to the column apparatus model
The selected boundary conditions provide a physically consistent representation of the flow and ensure reliable prediction of velocity and pressure fields within the computational domain.
At the outlet, a pressure outlet boundary condition with zero gauge pressure (0 Pa) was applied. The turbulence parameters at the outlet were specified using a turbulence intensity of 5% and a turbulent viscosity ratio of 10, ensuring numerical stability and preventing reverse flow.
All solid walls were modeled using a no-slip boundary condition. The near-wall treatment was ensured through appropriate mesh resolution (y⁺ ≈ 1), allowing accurate resolution of the viscous sublayer in accordance with the requirements of the SST turbulence model.
Wall roughness effects were neglected by assuming hydraulically smooth surfaces (roughness height = 0 m, roughness constant = 0.5).
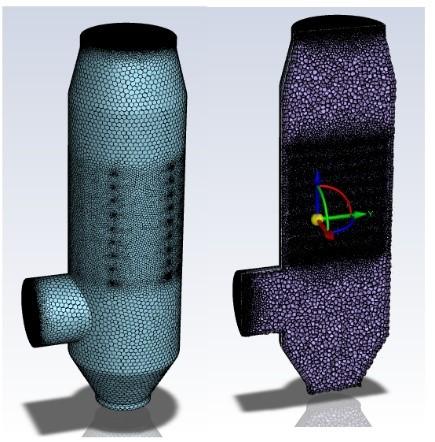
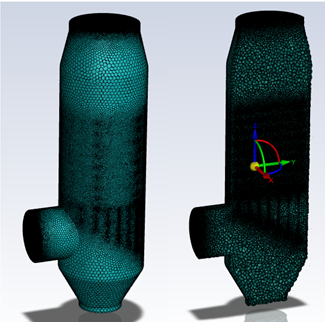
For the standard model, the following mesh parameters were applied: maximum cell size of 40 mm, minimum cell size of 2 mm, growth rate of 1.2, local surface refinement with a characteristic size of 5 mm, and three boundary-layer prism layers implemented using the Smooth Transition Method with a transition ratio of 0.272. For the modified configuration with guide plates, similar parameters were used; however, the growth rate was reduced to 1.1. This adjustment enabled a denser mesh in the vicinity of the guide elements and ensured uniform resolution of complex vortex structures arising from flow-plate interactions. In both configurations, mesh refinement was applied in the air-supply region and within the packing zone, allowing accurate representation of velocity and turbulence gradients. The average cell quality ranged from 0.82 to 0.86, which satisfies the recommended criteria for CFD simulations of turbulent flows in ANSYS Fluent as shown in Figures 4–5.
Figure 4. Computational mesh of the standard apparatus configuration
Figure 5. Computational mesh of the improved configuration with guide plates
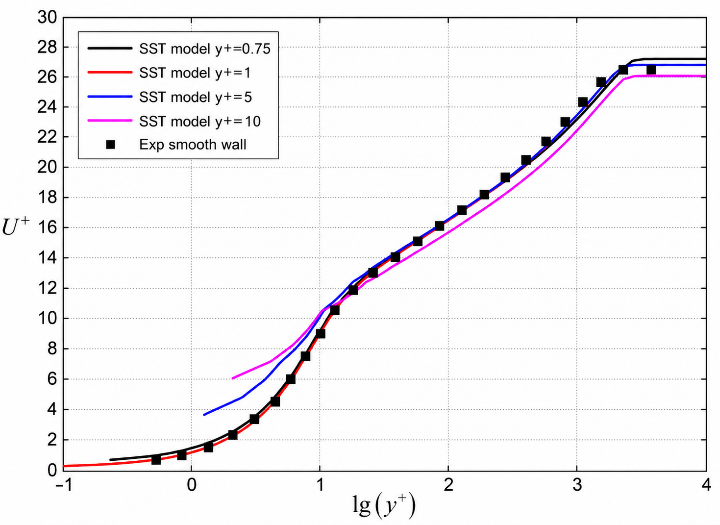
The final computational mesh contained approximately 5–28 million cells. A mesh sensitivity analysis was performed by varying the near-wall resolution, particularly the dimensionless wall distance (y⁺). Several mesh configurations corresponding to different y⁺ values were tested, as shown in Figure 6. Based on this analysis, the mesh corresponding to y⁺ ≈ 1 was selected, ensuring accurate resolution of the viscous sublayer and reliable prediction of near-wall flow behavior using the SST turbulence model.
Figure 6. Velocity profile comparison for different near-wall resolutions (y⁺ values) used in the mesh sensitivity analysis
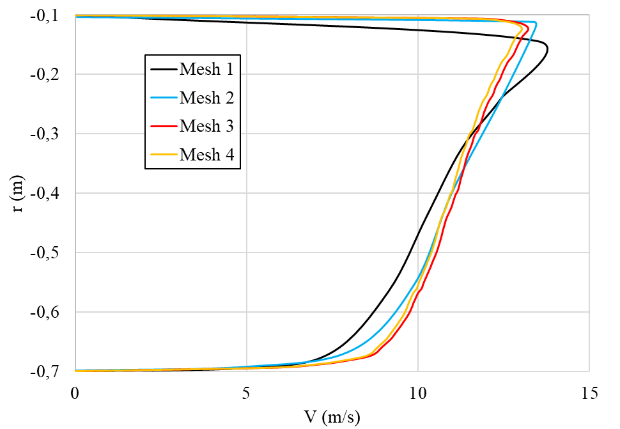
Figure 7. Comparison of the time-averaged axial velocity profiles at the inlet section of the modified packed-column configuration obtained using four computational meshes with different near-wall resolutions
For both configurations, meshes corresponding to y⁺ = 1 were employed to ensure accurate near-wall resolution.
As shown in Figure 7, time-averaged axial velocity profiles at the inlet section of the modified packed-column configuration were compared using four computational meshes with different near-wall resolutions (Mesh 1: y⁺ ≈ 10, Mesh 2: y⁺ ≈ 5, Mesh 3: y⁺ ≈ 1, and Mesh 4: y⁺ ≈ 0.75). The velocity profiles obtained with Meshes 2–4 show very close agreement, whereas Mesh 1 exhibits noticeable deviations near the wall. The close overlap of Meshes 3 and 4 indicates that further mesh refinement produces negligible changes in the predicted velocity field.
To evaluate mesh independence, four computational meshes with different near-wall resolutions were investigated. The meshes contained approximately 5, 15, 23, and 28 million computational cells, corresponding to average wall-coordinate values (y⁺) of approximately 10, 5, 1, and 0.75, respectively, as summarized in Table 1. Figure 7 compares the time-averaged axial velocity profiles at the inlet section of the modified packed-column configuration obtained using these meshes.
Table 1. Computational meshes used for the grid-independence study
|
Mesh |
Number of Cells |
Average y⁺ |
|
Mesh 1 |
5 million |
10.0 |
|
Mesh 2 |
15 million |
5.0 |
|
Mesh 3 |
23 million |
1.0 |
|
Mesh 4 |
28 million |
0.75 |
A noticeable difference is observed between Mesh 1 and the finer meshes, whereas Meshes 2-4 produce nearly identical velocity profiles over the entire sampling line. In particular, the results obtained with Meshes 3 and 4 are almost indistinguishable, indicating that further mesh refinement has only a negligible influence on the predicted time-averaged velocity field. Therefore, Mesh 3, consisting of approximately 23 million computational cells with an average y⁺ of about 1, was selected for all subsequent simulations because it provides an appropriate balance between numerical accuracy and computational cost.
3.3 Numerical solution procedure
The numerical simulations were performed using the ANSYS Fluent software package. The governing equations were solved using a pressure-based solver under steady-state conditions. Pressure-velocity coupling was achieved using the SIMPLE algorithm. Spatial discretization of the governing equations was carried out using second-order accurate schemes for pressure, momentum, turbulent kinetic energy, and specific dissipation rate, ensuring improved solution accuracy and reduced numerical diffusion. Turbulent flow was modeled using the SST turbulence model, which combines the advantages of the k-ε and k-ω formulations and allows reliable prediction of near-wall behavior and flow separation [25-29].
3.4 Numerical accuracy and convergence
To ensure the reliability of the numerical results, convergence and solution stability were carefully monitored. The residuals of the governing equations for mass, momentum, and turbulence quantities were reduced below 10⁻⁴ and stabilized without further oscillations. In addition, key integral parameters, such as the mean axial velocity and the pressure drop between the inlet and outlet of the apparatus, were monitored and reached steady values, indicating convergence to a stable steady-state solution. A grid-independence study was performed by comparing results obtained with different mesh resolutions in critical regions of the apparatus, including the inlet section, the guide plate zone, and the packing region. The comparison showed that further mesh refinement did not lead to significant changes in velocity and pressure distributions. These results confirm that the numerical solution is stable, converged, and independent of the computational grid (Table 2). The comparison of pressure-drop predictions with available experimental data supports the overall applicability of the numerical model, although additional experimental validation of detailed velocity fields would further strengthen confidence in the predicted flow structures.
Table 2. Statistical evaluation of the axial velocity distribution at the intermediate cross-section
|
Configuration |
Sampling Points |
Mean Axial Velocity (m/s) |
Standard Deviation (m/s) |
Coefficient of Variation (CV) (%) |
|
Conventional |
100 |
1.429 |
0.819 |
57.29 |
|
Modified |
100 |
0.653 |
0.296 |
45.28 |
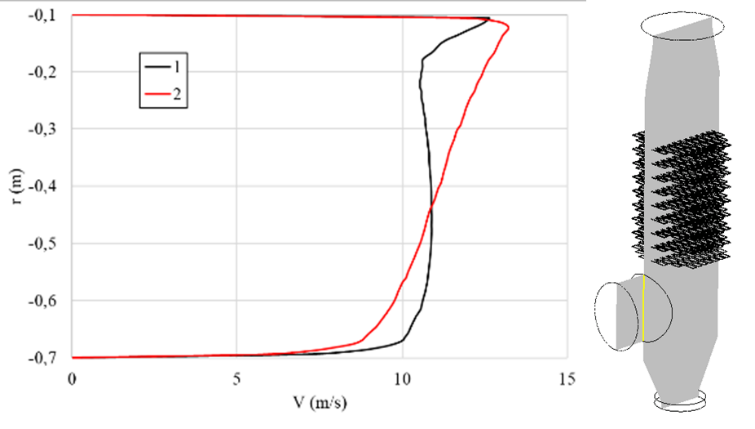
The results of the numerical simulations are presented and discussed below. Their reliability is confirmed by the verification and validation procedures described earlier. Figure 8 illustrates the distribution of the axial air-flow velocity along the radius of the apparatus at the investigated cross-section (marked by a yellow line in the schematic). Curve 1 (black line) corresponds to the standard apparatus configuration without guide elements, whereas curve 2 (red line) represents the proposed modified configuration equipped with guide plates.
Figure 8. Distribution of axial air-flow velocity along the apparatus radius
As can be seen from the plot, the standard configuration (curve 1) exhibits a pronounced non-uniform velocity profile: the maximum velocities (10-11 m/s) are concentrated near the wall opposite the inlet, while in the central and lower regions of the column the velocity decreases almost to zero. This behavior is explained by the fact that the laterally introduced flow does not have sufficient distance to redistribute across the cross-section and therefore retains a directed motion toward the opposite wall, forming a recirculation zone in the lower part of the apparatus. In contrast, for the modified configuration with guide plates (curve 2), the velocity profile becomes smoother and more uniform. The maximum velocity shifts closer to the column axis, and the difference between the central and peripheral regions is significantly reduced. This indicates that the proposed guide elements effectively redistribute the flow, suppress vortex-dominated regions, and ensure a more uniform air supply throughout the height of the packing zone.
Figure 9 presents the results of the numerical analysis of air-flow velocity distribution in a transverse cross-section of the column apparatus (the section location is indicated by a yellow line in the schematic on the right).
Figure 9. Air-flow velocity distributions in a transverse cross-section of the column apparatus
To further quantify the improvement in flow uniformity, the axial velocity distributions presented in Figures 8–10 were statistically evaluated. As observed from the velocity profiles, the modified configuration exhibits a noticeably smaller velocity dispersion across the column cross-section than the standard configuration. The reduced spread of velocity values indicates a more homogeneous gas distribution and confirms the qualitative observations obtained from the velocity contours, streamline patterns, and vortex visualization. Although the present study focuses primarily on the comparative analysis of the two configurations, future work will include a more comprehensive statistical characterization of flow uniformity based on detailed experimental and numerical datasets.
(a)
(b)
(c)
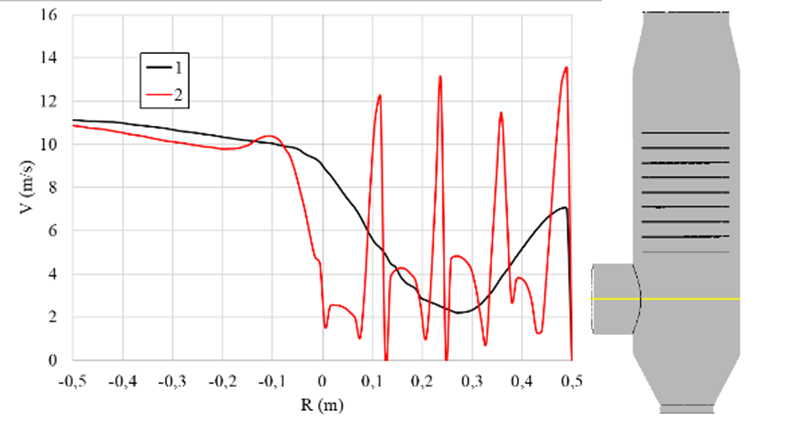
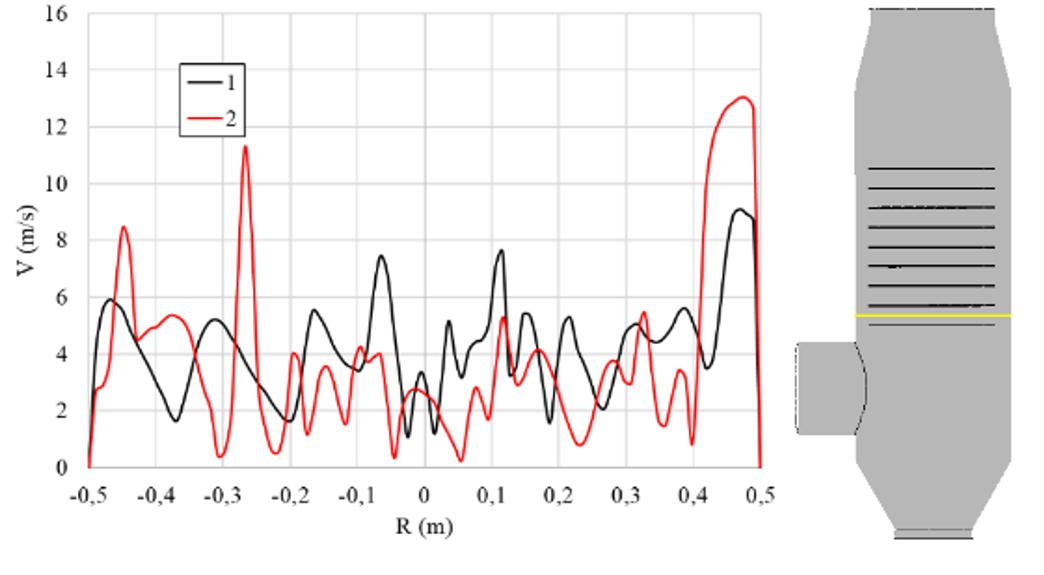
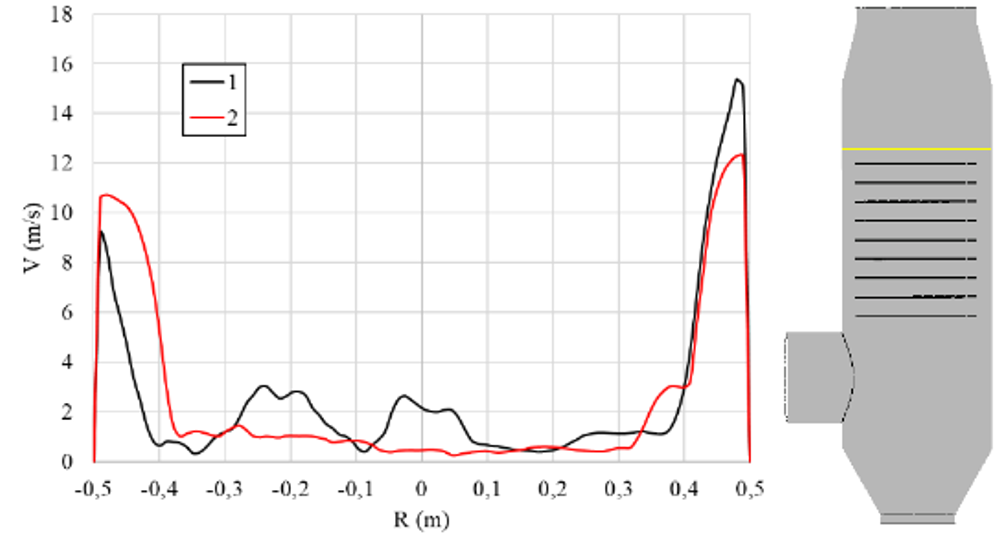
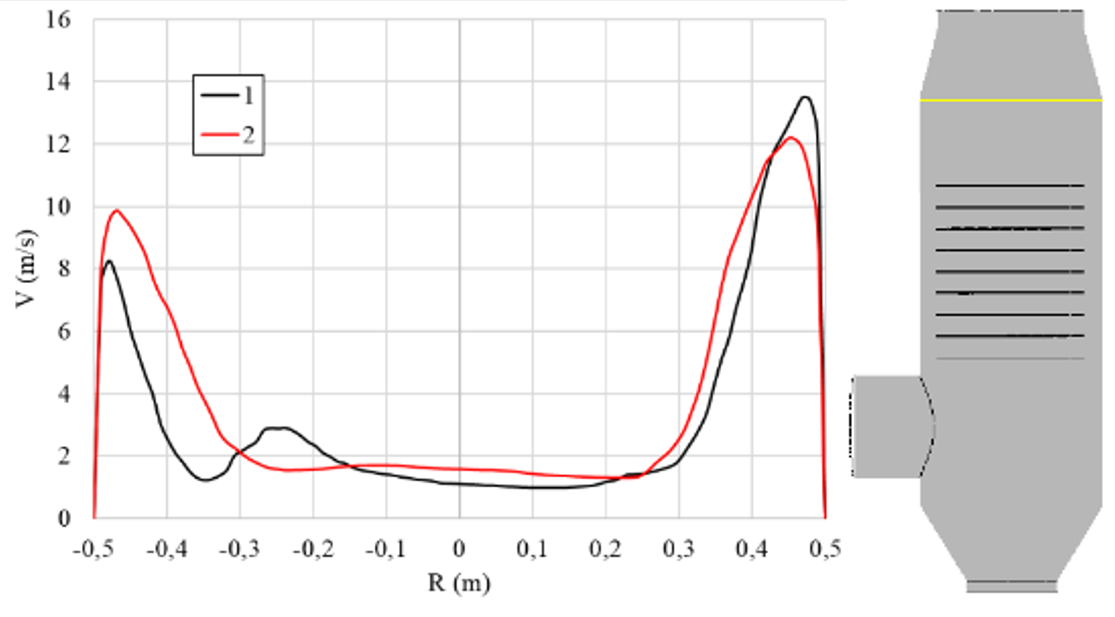
Figure 10. Radial air-flow velocity distributions at three characteristic cross-sections
For the standard configuration (curve 1), a distinctly non-uniform radial velocity distribution is observed: regions of increased velocity (approximately 12 m/s) occur near the inlet nozzle, while reduced velocities are recorded in the central and opposite regions, indicating the development of vortex structures and reverse flows. In the case of the modified configuration (curve 2), the velocity profile exhibits a more complex but dynamically balanced structure. Local velocity peaks and depressions are associated with the passage of the flow through the guide plates, which generate secondary vortical structures that enhance mixing and redistribution of air across the entire cross-section. As a result, the main flow acquires a more uniform axial orientation, eliminating stagnant zones and providing an optimal velocity distribution in the working region of the apparatus. To provide a quantitative assessment of flow uniformity, the standard deviation of the axial velocity distribution across the selected cross-section was evaluated for both configurations. The results show that the modified configuration with guide plates exhibits a lower velocity dispersion compared to the standard design, indicating improved flow uniformity.
Figure 10 shows the radial velocity distributions at three characteristic axial locations: (a) at height z = 462.5 mm, near the inlet nozzle; (b) at height z = 1100 mm, in the central packing zone; and (c) at height z = 1500 mm, in the upper part of the column. In the lower section (Figure 10(a), z = 462.5 mm), the standard configuration demonstrates a significant non-uniformity in velocity distribution: a maximum of approximately 13-15 m/s is observed near the wall opposite the inlet, while the central region exhibits much lower velocities (2-5 m/s). This indicates the presence of vortices and stagnant zones resulting from the asymmetric lateral air supply. In the modified configuration, the velocity distribution is considerably more uniform, confirming the effective redistribution of the flow by the guide plates. In the intermediate section (Figure 10(b), z = 1100 mm), the standard configuration still shows two pronounced velocity maxima near the walls, with reduced velocity values (<5 m/s) in the center, indicating a two-channel flow structure and insufficient mixing. In the modified configuration, the profile becomes smoother: the central velocity increases to 8-10 m/s, and the radial gradient decreases, indicating partial restoration of axial flow symmetry. In the upper section (Figure 10(c), z = 1500 mm), the velocity profile for the modified configuration is nearly uniform, with minimal differences between the central and peripheral regions and an average velocity of 10-12 m/s. In contrast, the standard configuration continues to exhibit non-uniformity, with wall-adjacent maxima and reduced central velocities. These results confirm that the installation of guide plates promotes flow stabilization and the formation of a more uniform upward air motion along the column height.
To provide a quantitative assessment of flow uniformity, the axial velocity distribution at the intermediate cross-section (Figure 10(b)) was statistically analyzed. Velocity values were extracted along the radial sampling line using 100 uniformly distributed sampling points. The mean axial velocity, standard deviation, and coefficient of variation (CV) were calculated to characterize the velocity distribution. As summarized in Table 3, the modified configuration exhibits a substantially lower standard deviation (0.296 m/s) than the conventional configuration (0.819 m/s), corresponding to a reduction of approximately 63.9%.
The CV also decreases from 57.29% to 45.28%, indicating a more uniform distribution of the time-averaged axial velocity within the investigated cross-section. These quantitative results are consistent with the velocity profiles and streamline patterns presented in Figures 10–14.
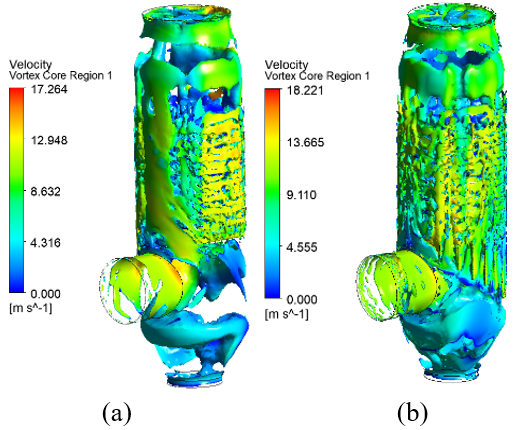
Figure 11 predicted vortex-core regions in the conventional (a) and modified (b) packed-column configurations. The vortex structures were identified using the Q-criterion with a threshold value of Q = 0.01 s⁻². The same criterion and threshold value were applied to both configurations to ensure a consistent comparison of the predicted flow structures.
Figure 11 compares the three-dimensional time-averaged velocity fields and the predicted vortex-core structures in the conventional (a) and modified (b) packed-column configurations. The vortex-core regions were identified using the Q-criterion with a threshold value of Q = 0.01 s⁻², and the same criterion was applied to both configurations to ensure a consistent comparison. In the conventional configuration (Figure 11(a)), the incoming gas jet is deflected toward the opposite wall, resulting in an asymmetric flow pattern and the formation of relatively large recirculation regions in the lower part of the apparatus near the inlet. In the modified configuration (Figure 11(b)), the guide plates redistribute the incoming gas flow, producing a more uniform time-averaged velocity field within the packing section. The predicted vortex-core regions in the lower part of the column occupy a smaller spatial extent than those observed in the conventional configuration, indicating improved redistribution of the mean gas flow. Because the simulations were performed using the steady-state RANS SST turbulence model, the vortex-core structures shown in Figure 11 represent numerical predictions of the time-averaged flow field rather than transient vortex evolution or oscillatory flow behavior.
Figure 11. Three-dimensional time-averaged velocity fields and vortex-core structures identified using the Q-criterion (Q = 0.01 s⁻²): (a) conventional configuration; (b) modified configuration
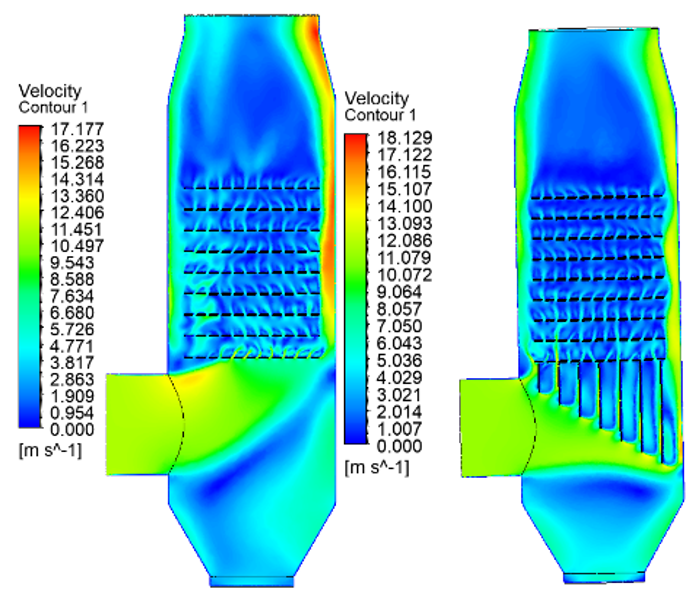
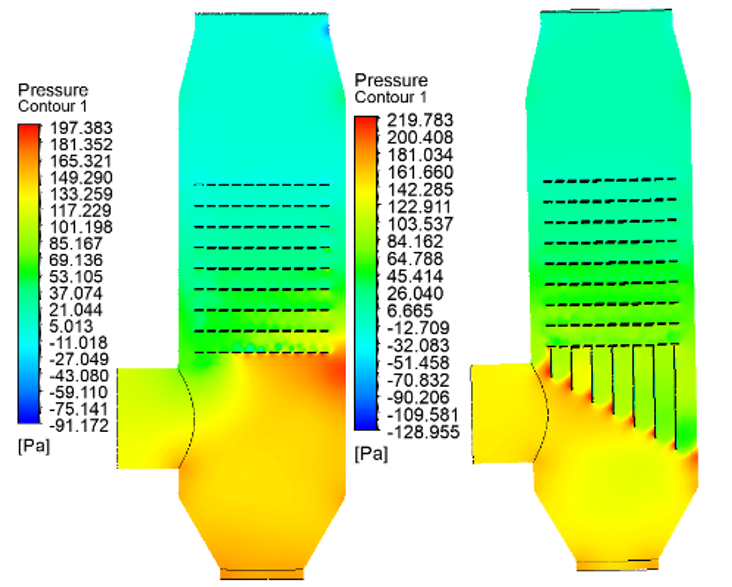
Figure 12 shows the velocity and pressure fields in a longitudinal cross-section of the column apparatus for both configurations.
(a)
(b)
Figure 12. Velocity and pressure distributions in the longitudinal cross-section of the column apparatus for the two configurations
The velocity contours (Figure 12(a)) show that, in the standard configuration, the air flow entering through the lateral nozzle is directed toward the opposite side of the column, forming a high-velocity region along the wall and extensive recirculation zones in the lower and central parts of the apparatus. This results in a strongly non-uniform flow distribution along the packing height. In the modified configuration, the introduction of guide plates promotes a more uniform redistribution of the air flow. The axial velocity component becomes more dominant, large-scale vortex structures are suppressed, and a more stable upward motion of the flow is established throughout the column. As a result, the flow becomes more vertically oriented, indicating improved hydrodynamic organization. Analysis of the pressure fields (Figure 12(b)) indicates that, in the standard configuration, a steep pressure gradient is formed near the inlet region, accompanied by pronounced flow asymmetry and recirculation effects. In the modified configuration, the pressure field becomes more uniform, with reduced local gradients in the inlet zone, reflecting a more stable and organized flow structure. At the same time, the introduction of guide plates leads to an increase in the overall pressure drop across the column from 117 Pa to 140 Pa, indicating higher hydraulic resistance due to additional flow obstruction. The modified configuration improves the uniformity of the velocity and pressure fields. However, this improvement is accompanied by a moderate increase in hydraulic losses.
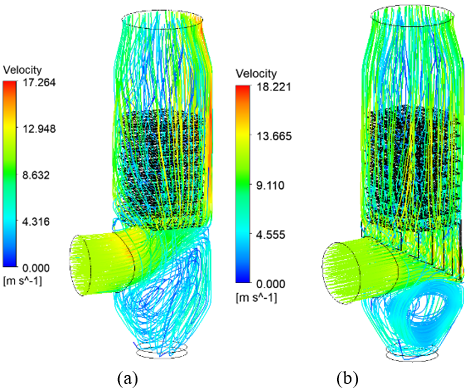
Figure 13 presents streamlines illustrating the airflow patterns within the column apparatus: the standard configuration without guide elements is shown on the left, and the modified configuration with guide plates is shown on the right.
Figure 13. Streamlines illustrating airflow patterns in the column apparatus
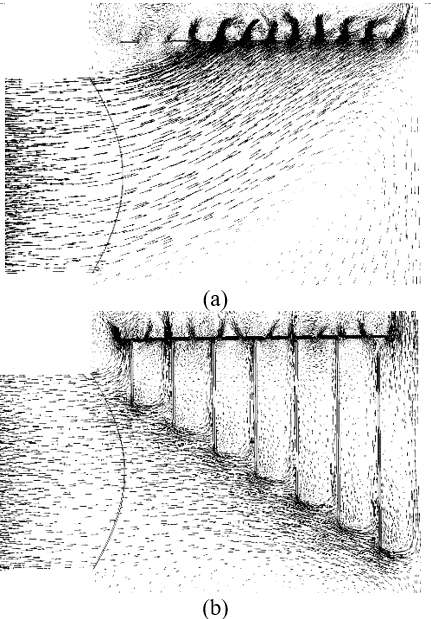
In the standard configuration, the flow is characterized by pronounced asymmetry and the formation of large-scale vortex structures in the lower part of the apparatus after entering through the lateral nozzle. A significant portion of the flow is directed toward the opposite wall, forming a high-velocity region, while recirculation zones persist in the central and lower regions. This results in a non-uniform velocity distribution within the column. In the modified configuration with guide plates, the flow becomes more uniformly distributed across the column cross-section and is predominantly directed in the axial direction. The guide plates reduce the transverse velocity components, limit the predicted extent of large-scale recirculation regions in the inlet section, and produce a more uniform axial velocity field. As a result, recirculation zones are reduced, and the flow structure becomes more uniform along the column height. Figure 14 shows the velocity vector fields in the air inlet region of the column apparatus: (a) the standard configuration without guide elements and (b) the modified configuration with guide plates.
Figure 14. Velocity vector fields in the air inlet region of the column apparatus: (a) standard configuration; (b) modified configuration with guide plates
In the standard configuration (Figure 14(a)), the flow entering through the lateral nozzle has a pronounced horizontal component and impinges on the opposite wall of the column, forming an intense recirculation zone in the lower part of the apparatus. This region is characterized by chaotic velocity vectors and the formation of large vortical structures oriented against the main flow direction. Such a flow configuration leads to non-uniform air distribution in the packing zone and the emergence of stagnant regions, thereby reducing the effectiveness of gas-liquid interaction. In the modified configuration (Figure 14(b)), the presence of guide plates redistributes the air flow along the apparatus axis, significantly reducing the horizontal velocity component. The velocity vectors become more ordered, forming a smooth transition from the inlet region to the central part of the column. The guide plates prevent the formation of large-scale vortices and damp transverse flow oscillations, ensuring a more uniform air supply to the working zone.
Table 3 compares the characteristic parameters obtained in the present study for the base and modified configurations with available experimental data.
Table 3. Comparison of numerical and experimental data for the hydraulic resistance of the column apparatus
|
No. Parameter |
Experimental Data [18] |
RANS SST Simulation Results |
Deviation from Experiment % |
||||
|
Base model |
Modified model |
Base model |
Modified model |
Base model |
Modified model |
||
|
1 |
Initial conditions: inlet gas velocity. m/s |
11.0-11.2 |
11.0-11.2 |
11.1 |
11.1 |
None |
None |
|
2 |
Pressure drop ΔP. Pa |
120 |
130 |
117 |
140 |
2.5 |
7.6 |
Note: Reynolds-averaged Navier–Stokes (RANS), Shear Stress Transport (SST).
The numerical results for pressure drop show reasonable agreement with available experimental data [18]. The analysis of velocity distribution and flow structure is based on the numerical simulation results and provides a qualitative assessment of flow behavior within the column.
Based on the numerical simulations of air flow in the column apparatus performed using ANSYS Fluent and the RANS SST turbulence model, the results indicate that the proposed modified design incorporating guide plates provides a more uniform time-averaged air-flow distribution along both the height and the cross-section of the apparatus compared with the conventional configuration. The SST turbulence model was employed to predict the turbulent flow field, including near-wall regions and zones with pronounced streamline curvature. The numerical results predict a reduction in the extent of recirculation regions and a more uniform time-averaged velocity distribution in the modified configuration, leading to improved gas-flow distribution within the working volume of the apparatus.
Although the incorporation of guide plates increases the pressure drop from 117 Pa to 140 Pa, this increase is accompanied by a more uniform distribution of the velocity and pressure fields under the investigated operating conditions. The developed numerical model, based on the Reynolds-averaged Navier–Stokes equations and the SST turbulence model, provides a useful tool for evaluating gas-flow characteristics and assessing the influence of guide-element geometry on the hydrodynamic performance of packed-column apparatuses. The proposed numerical approach can therefore be applied to the design analysis and optimization of similar gas-flow systems.
The numerical model was validated through comparison with available experimental pressure-drop data, which showed satisfactory agreement for the investigated operating conditions. However, direct experimental validation of the predicted velocity fields and recirculation structures was not performed in the present study. Therefore, the observed flow redistribution and reduction in recirculation regions should be interpreted as numerical predictions obtained using the steady-state RANS SST model rather than experimentally verified flow characteristics. Future work will focus on experimental measurements of velocity distributions using advanced flow diagnostic techniques to further validate the predicted flow structures.
[1] Cussler, E.L., Billet, R. (1995). Packed towers (In processing and environmental technology). Journal of the American Chemical Society, 117(51): 12899-12899.
[2] Sinnott, R. (2005). Chemical Engineering Design: Chemical Engineering Volume 6. Elsevier Butterworth‑Heinemann, Oxford.
[3] Kister, H.Z. (1992). Distillation Design. McGraw-Hill, New York, USA.
[4] Krishna, R., Van Baten, J.M. (2001). Scaling up bubble column reactors with the aid of CFD. Chemical Engineering Research and Design, 79(3): 283-309. https://doi.org/10.1205/026387601750281815
[5] Ranade, V.V. (2001). Computational Flow Modeling for Chemical Reactor Engineering. Elsevier, Amsterdam.
[6] Chen, W.C., Fan, Y.W., Zhang, L.L., et al. (2022). Computational fluid dynamic simulation of gas-liquid flow in rotating packed bed: A review. Chinese Journal of Chemical Engineering, 41: 85-108. https://doi.org/10.1016/j.cjche.2021.09.024
[7] Lotfy, E., Harun, Z., Taip, F. (2026). Developing and testing an OpenFOAM model to solve the conjugate heat and mass transfer problem. Engineering Computations, 43(4): 1349-1365. https://doi.org/10.1108/EC-04-2025-0293
[8] Venkata Anjani Kiran, S., Ranganathan, P. (2023). Computational fluid dynamics simulation of reactive absorption of CO2 in a structured packed column. The Canadian Journal of Chemical Engineering, 101(11): 6271-6283. https://doi.org/10.1002/cjce.24663
[9] Tucker, P.G. (2014). Turbulence and its modelling. In Unsteady Computational Fluid Dynamics in Aeronautics. Fluid Mechanics and Its Applications, 104: 93-148. https://doi.org/10.1007/978-94-007-7049-2_3
[10] Ferziger, J.H., Perić, M., Street, R.L. (2002). Computational Methods for Fluid Dynamics, 3: 196-200. Springer, Berlin. https://link.springer.com/book/10.1007/978-3-642-56026-2.
[11] Pope, S.B. (2001). Turbulent flows. Measurement Science and Technology. https://www.cambridge.org/sg/universitypress/subjects/physics/nonlinear-science-and-fluid-dynamics/turbulent-flows.
[12] Wilcox, D.C. (1998). Turbulence Modeling for CFD. La Canada, CA: DCW Industries. https://sutlib2.sut.ac.th/sut_contents/H133907.pdf.
[13] ANSYS. (2023). Ansys Fluent Theory Guide. https://ansyshelp.ansys.com/public/account/secured?returnurl=/Views/Secured/corp/v242/en/flu_th/flu_th.html.
[14] Haghshenasfard, M., Zivdar, M., Rahimi, R., Esfahany, M.N. (2007). CFD simulation of gas distribution performance of gas inlet systems in packed columns. Chemical Engineering &Technology, 30: 1176-1180. https://doi.org/10.1002/ceat.200700102
[15] Menter, F.R. (1994). Two-equation eddy-viscosity turbulence models for engineering applications. AIAA Journal, 32(8): 1598-1605. https://doi.org/10.2514/3.12149
[16] Fu, Y.C., Bao, J., Singh, R., Wang, C., Xu, Z.J. (2020). Investigation of countercurrent flow profile and liquid holdup in random packed column with local CFD data. Chemical Engineering Science, 227: 115693. https://doi.org/10.1016/j.ces.2020.115693
[17] Guardo-Zabaleta, A., Coussirat, M., Larrayoz, M.A., Recasens, F., Egusquiza, E. (2005). Influence of the turbulence model in CFD modelling of wall-to-fluid heat transfer in packed beds. Chemical Engineering Science, 60: 1733-1742. https://doi.org/10.1016/j.ces.2004.10.034
[18] Ismailov, B., Ismailov, K., Shambilova, A., Iztaev, Z., Tileuov, G. (2023). Simulation of hydrodynamics and mass transfer in separated flows past packings in technological apparatuses. Chemical Engineering Transactions, 100: 349-354. https://doi.org/10.3303/CET23100059
[19] Ismailov, B.R., L.P. Kholpanov, O.S. Balabekov. (2002). Distribution of gas flow parameters in mass transfer columns with regularly spaced shelves. Theoretical Foundations of Chemical Engineering, 36(5): 409-413. https://doi.org/10.1023/A:1020618224756
[20] Xue, J., Wu, Q., Zhao, H., Li, Q. (2022). A computational fluid dynamics-based method to investigate and optimize novel liquid distributor. AIChE Journal, 68(10): e17806. https://doi.org/10.1002/aic.17806
[21] Menter, F.R. (1992). Improved two-equation k–ω turbulence models for aerodynamic flows. NASA STI. Recon Technical Report, 93: 22809. https://ntrs.nasa.gov/citations/19930013620.
[22] Menter, F. R., Kuntz, M., Langtry, R. (2003). Ten years of industrial experience with the SST turbulence model. Turbulence, Heat and Mass Transfer, 4(1): 625-632. https://www.researchgate.net/profile/Florian-Menter/publication/228742295_Ten_years_of_industrial_experience_with_the_SST_turbulence_model/links/0046353c6330b1c0a4000000/Ten-years-of-industrial-experience-with-the-SST-turbulence-model.pdf.
[23] Spalart, P.R., Rumsey, C.L. (2007). Effective inflow conditions for turbulence models in aerodynamic calculations. AIAA Journal, 45(10): 2544-2553. https://doi.org/10.2514/1.29373
[24] Smirnov, P.E., Menter, F.R. (2009). Sensitization of the SST Turbulence model to rotation and curvature by applying the spalart-shur correction Term. ASME Journal of Turbomachinery, 131(4): 041010. https://doi.org/10.1115/1.3070573
[25] Wang, G.C., Cai, W.F., Xie, L., Zhang, X.B., Wang, Y. (2022). CFD modeling and simulation of the hydrodynamics characteristics of packed column with structured sinusoidal corrugated sheets packings. Chemical Engineering Research and Design, 183: 56-66. https://doi.org/10.1016/j.cherd.2022.04.038
[26] Macfarlan, L.H., Seibert, A.F., Phan, M.T., Eldridge, R.B. (2021). CFD-based study on structured packing geometry. Chemical Engineering Science, 243: 116767. https://doi.org/10.1016/j.ces.2021.116767
[27] Jain, E., Sau, M., Buwa, V.V. (2021). Eulerian simulations of liquid distribution generated by chimney and bubble cap distributors. Chemical Engineering Journal, 421: 127799. https://doi.org/10.1016/j.cej.2020.127799
[28] Haroun, Y., Raynal, L. (2015). Use of computational fluid dynamics for absorption packed column design. Oil & Gas Science and Technology-Revue d’IFP Energies Nouvelles, 71(3): 43. https://doi.org/10.2516/ogst/2015027
[29] Wang, K.H., Yuan, X., Wang, P., et al. (2025). CFD and machine learning-based multi-objective optimization for structured packing design. Chemical Engineering Science, 122483. https://doi.org/10.1016/j.ces.2025.122483