Taha A.T.D. AlJawwadi* | Aiman T.M.S. AlSayegh | Dena M.A.S. AlHamundi
© 2026 The authors. This article is published by IIETA and is licensed under the CC BY 4.0 license (http://creativecommons.org/licenses/by/4.0/).
OPEN ACCESS
This preliminary study investigated the effect of five phosphate fertilizer levels (0, 80, 120, 160, and 200 kg ha⁻¹ P₂O₅) on the spectral signature of broad bean leaves under controlled pot conditions, with three pots prepared for each treatment, while spectral measurements were conducted on selected representative plants. At the pre-flowering vegetative stage, the most representative plant per treatment was selected for spectral reflectance measurement using an Analytical Spectral Devices (ASD) FieldSpec 4 Hi-Res spectroradiometer (350–2500 nm). Key growth indicators were also recorded. Plant phosphorus concentration increased from 0.55% in the control to 0.89% at the highest fertilization level, while initial soil phosphorus remained constant at 12.64 mg kg⁻¹ across all pots (measured before fertilization). Spectral curves showed notable treatment-related variation, particularly at 720 nm (red-edge), near-infrared (NIR) regions around 1000 - 1075 nm, and Short-Wave Infrared (SWIR) regions around 1650 and 2250 nm. Growth responses generally reflected improved phosphorus supply, especially in shoot dry weight and root nodule number, though trends were non-linear. The results suggest that broad bean leaf spectral reflectance is sensitive to phosphate fertilization level, with the red-edge and SWIR regions showing the greatest discriminative potential. These findings are exploratory and based on representative single-replicate spectral curves due to resource limitations. Overall, the study indicates that phosphorus fertilization influences leaf spectral behavior indirectly through its effects on plant physiology and internal structure. The study highlights the potential of spectral signature analysis as an efficient tool for detecting phosphorus-related changes in broad bean leaves and supports its future application for nutrient assessment in plants without relying exclusively on time-consuming chemical analyses.
remote sensing, spectral signature, phosphate fertilizer, broad bean
Remote sensing technology has witnessed significant development in recent years, transforming it into a precise tool for detecting the physiological and nutritional status of plants. Previously, its use was limited to distinguishing between plant species or monitoring ground cover. The spectral reflectivity of any object can be measured by determining the energy it reflects according to its reflected wavelength. This is called the spectral reflectance index of that object and is expressed as a percentage. The reflectance diagram of the object as a function of wavelength is called the spectral reflectance curve. This is known as the spectral fingerprint of that object [1]. The spectral fingerprint serves as an analytical tool used to study the chemical composition and physical properties of plant leaves [2]. It is recorded by measuring the effect of absorption and emission of the electromagnetic spectrum when the sample is exposed to specific radiation. This allows for understanding the interaction of plant leaves with phosphate fertilizers and identifying the changes resulting from this interaction [3]. Spectral fingerprinting is used to analyze the potential effects of phosphate fertilizers on leaves and to provide specific explanations for the chemical and physical changes that may occur as a result of these effects [4]. Phosphorus nutrition affects the spectral fingerprint of broad bean leaves by enhancing Adenosine Triphosphate (ATP) synthesis, nitrogen biofixation, chlorophyll, photosynthesis, and leaf area. This is typically reflected by a decrease in reflectance in the visible range, particularly red, a change in the red edge, and an increased near-infrared (NIR) response; conversely, phosphorus deficiency generates detectable spectral patterns [5]. By analyzing the spectral fingerprint, or plant spectral signature, it has become possible to determine its nutritional status and its response to various agricultural management practices such as fertilization, stress, and moisture. Recent studies indicate that subtle spectral changes in leaves are closely linked to nutrient levels. For example, a study by Okyere et al. [6] confirms that spectral sensing can detect plant physiological changes resulting from nutrient availability and environmental conditions. Furthermore, a study by Khajehyar et al. [7] demonstrated the ability to predict nutrient content from the spectral signature of leaves, reflecting the effectiveness of this technique in accurately determining plant nutritional and overall health. With rapid digital advancements, it now employs a wide range of spectral bands and advanced processing, including integration with artificial intelligence, to extract vegetation characteristics and monitor plant health and changes [8, 9].
Plant Leaf Physiology and Its Response to Solar Radiation: The leaf of the broad bean plant exhibits distinctive physiological characteristics that respond clearly to spectral radiation, making it suitable for spectral observation. It contains pigments such as chlorophyll and carotenoids that absorb blue and red light, while reflecting NIR radiation. This serves as an indicator of photosynthetic efficiency and plant health. Environmental changes, such as leaf exposure to pollutants like sulfur dioxide, cause alterations in spectral reflectivity [10]. Certain wavelengths, such as blue light, affect stomata, thus modifying gas exchange [11]. Furthermore, light and soil conditions influence the physiological response of leaves [12].
Fertilization and Its Effect on Plant Health: Phosphate fertilizers are a key nutrient that plays a vital role in broad bean cultivation, promoting leaf growth and improving fruit quality. Phosphate fertilizers contain phosphorus, which is essential for activating vital plant processes such as DNA synthesis, energy storage, and genetic transmission. It also provides seeds with the energy necessary for germination [13]. Furthermore, phosphorus plays a crucial role in leguminous plants, as its deficiency leads to reduced root nodule formation [14].
Spectral Signature: Spectral signature is an analytical tool used to study the chemical composition and physical properties of plant leaves [2]. It is recorded by measuring the absorption and emission of the electromagnetic spectrum when a sample is exposed to specific radiation. This allows for an understanding of the interaction of plant leaves with phosphate fertilizers and the identification of changes resulting from this interaction [3]. Spectral signature is used to analyze the potential effects of phosphate fertilizers on leaves and to provide specific interpretations of the chemical and physical changes that may occur as a result of these effects [4].
Potential Effects of Phosphate Fertilizers on Broad Bean Leaves: There are potential effects that may occur as a result of using phosphate fertilizers on broad bean leaves. The expected results of the effects on plant structure and the chemical composition of the leaves will be analyzed based on relevant previous studies. The focus will also be on possible interpretations of the overall effects and expected results based on the analytical methods used. The aim is to provide accurate and reliable results and analyses regarding the potential effects of phosphate fertilizers on broad bean leaves.
Broad bean plants are affected by the type and concentration of added nutrients, and these effects are reflected in the physiological and color characteristics of the plant's leaves. These changes can be accurately monitored using ground-based remote sensing techniques, particularly spectroradiometers such as the Analytical Spectral Devices (ASD) FieldSpec, which allow for the measurement of the spectral reflectivity of plant leaves within the visible and infrared spectral ranges. To assess the extent to which fertilization affects the plant, broad beans were chosen as an experimental plant due to their high sensitivity to nutritional changes and the clear color responses in their leaves. Different concentrations of phosphate fertilizer were applied, and plant growth indicators were closely monitored after the completion of the vegetative growth stage [15, 16]. The research aims to determine the possibility of monitoring the amount of fertilizers added to broad bean plants and the extent of their effect on the color of plant leaves and the spectral signature of the plant leaf, and to understand the potential effects of phosphate fertilizers on leaves more broadly and deeply.
The broad bean plant was chosen as the suitable plant for this study due to its rapid growth under both laboratory and field conditions, as well as the ability to monitor its physiological indicators that are affected by changes in the applied stimuli. Before conducting the experiment, several seeds were used to test germination and growth rate, ensuring the selection of viable seeds. Common garden soil was chosen because it is light and allows plant extraction without affecting the roots. The soil was prepared using standard methods (spreading, air drying, and grinding). Soil samples were taken for physical and chemical tests before any fertilizer application. Electrical conductivity, soil acidity, soil texture, organic matter, and the initial phosphorus content (12.64 mg kg⁻¹, measured prior to treatment) were determined. The same soil batch was used for all pots to ensure uniform initial conditions. Following the tests, 15 pots were prepared, with 3 pots per treatment; 750 g of soil per pot. Two broad bean seeds were planted in each pot. Nitrogen–Phosphorus–Potassium (NPK) 50:50:50 compound fertilizer was added to it, and the phosphorus was in the form of triple superphosphate P₂O₅. The fertilizer was added at planting time and mixed with the soil. The actual quantity added to each pot in grams, equivalent to kilograms per hectare, is shown in Table 1. The pots were irrigated regularly. After one week, one seedling per pot was removed for thinning and germination quality was assessed.
Table 1. Treatments and concentrations of fertilizer added according to broad bean plant fertilizer recommendations
|
No. |
Weight of Fertilizer in Grams/Pot |
Added Levels (kg ha⁻¹) |
|
1 |
0 |
0 |
|
2 |
0.06 |
80 |
|
3 |
0.09 |
120 |
|
4 |
0.12 |
160 |
|
5 |
0.15 |
200 |
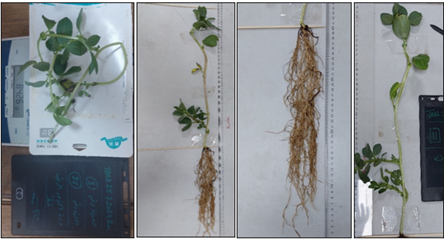
After approximately three weeks, once the plant had reached a suitable vegetative growth stage and just before flowering, plant growth was observed, and the most suitable plant for measuring the spectral signature of the leaves was selected. This was done by choosing the most representative and mature plant in each treatment, as it was difficult to obtain the average spectral signature for three replicates and it was not useful to represent and compare them within a single replicate. To promote rapid germination and optimal leaf maturation, a small greenhouse was designed for this purpose. Subsequently, the pots with the best spectral signature from each of the five treatments were selected, and the samples were transferred to the Spectral Signature Laboratory at the Remote Sensing Center. The spectral reflectance of each selected sample was measured using an ASD FieldSpec 4 Hi-Res spectroradiometer (Malvern Panalytical, USA), covering 350–2500 nm with a spectral resolution of ~3 nm in the Visible and Near-Infrared (VNIR) and 10 nm in the Short-Wave Infrared (SWIR). A Spectralon white reference panel was used for calibration before each session and recalibrated every 10–15 minutes. Dark current correction was applied automatically. Measurements were taken from the adaxial (upper) surface of fully expanded intact leaves held flat against a black felt background. Ten scans were averaged per sample to reduce noise. Spectral data were processed using ViewSpecPro software. Figure 1 illustrates the measurement setup. After spectral measurement, the plant was carefully extracted for growth parameter assessment.
Figure 1. Measurement of the spectral signature of samples using an Analytical Spectral Devices (ASD) device
The roots were gently washed so that no trace of soil remained. The number of root nodules and maximum root length were recorded, along with shoot length and leaf number. These measurements were repeated for each selected sample. Plant moisture content was also measured gravimetrically by weighing a fresh, moist plant sample and then drying it in an oven until the weight stabilized. The following equation was then used to calculate the moisture content:
$Plant\ Moisture\ Content (\%)=\left[\left(W_f-W_d\right) \div W_f\right] \times 100$
where, Wf = Fresh Weight, Wd= Dry Weight; this information was recorded as vital indicators in Figure 2. This occurred without displaying the individual values for the repeats or the libertarian deviation, according to the documentation method supervising the selection at the time. This diversity is acknowledged as a limitation in displaying the results, and in the future, it will be based on documenting the individual values for each repeat and always displaying the statistical correlation criteria. Leaf samples were collected from the plants whose spectral signature was measured, one group per treatment. The leaves were dried in metal trays inside an oven at 70 ℃ for 48 hours, then ground to a fine powder. Wet digestion was performed using 0.5 g of dry tissue in 10 mL of concentrated H₂SO₄; leave it for 24 hours, then place it on a heat source and add 1 mL HClO₄ until the sample becomes clear, following Schuffelen and Muller [17, 18]. The phosphorus concentration in the extract was determined using the standard blue molybdate method, based on the reaction of orthophosphate with ammonium molybdate in the presence of ascorbic acid as a reducing agent, to form a blue complex. Absorbance was measured at 430 nm using an APEL PD-303UV spectrophotometer (Japanese-made). A calibration curve was prepared using standard KH₂PO₄ solutions in the range of 0–10 mg/L at six calibration points; the calibration curve showed a strong linear relationship, with a coefficient of determination (R²) of 0.97. Blank samples were included to correct for background absorbance, and each digested sample was analyzed as an analytical triplicate, with the average of the triplicates used in the statistical analysis.
Figure 2. Measurements of the shoot and root system with weight
To discuss the results, it was necessary to present a table illustrating the experimental map and the samples selected for measurement using the spectrometer. This provided a complete picture of the experiment, as shown in Table 2. The table displays the sample numbers read by the ASD device, as these were considered the most representative samples of the plant's condition. It should be noted that the spectral signature measurement was limited to one most representative and mature plant in each treatment, rather than measuring and averaging the three replicate samples, due to the limited operating time of the spectrometer within the targeted physiological window (immediately before flowering). Therefore, these results should be considered preliminary and descriptive, reflecting general trends in spectral response among treatments, and are not statistically generalizable. This limitation did not extend to the other study variables, as all were measured on all replicate samples according to the approved experimental design.
Table 2. Method of arranging the parameters and candidate samples for the spectrometer
|
P0 |
P1 |
P2 |
P3 |
P4 |
|
|
R1 |
P0r1 |
P1r1 |
P2r1 |
P3r1 |
P4r1 |
|
R2 |
P0r2 |
P1r2 |
P2r2 |
P3r2 |
P4r2 |
|
R3 |
P0r3 |
P1r3 |
P2r3 |
P3r3 |
P4r3 |
To further clarify, Table 3 shows the phosphorus concentration in the soil along with the number of the selected sample, as well as the concentration of the added fertilizer and the resulting change in the phosphorus concentration in the plant leaf.
Table 3. Concentrations of added phosphorus fertilizer (P₂O₅) with phosphorus concentrations in the soil
|
Treatment Number |
Sample Number Selected from the Treatment |
Phosphorus Concentration in the Soil (mg kg-1) |
Added Levels (kg ha⁻¹) |
Phosphorus Concentration in Plants (%) |
|
P0 = Treatment 1 |
P0r3 |
12.64 |
0 |
0.55 |
|
P1 = Treatment 2 |
P1r3 |
12.64 |
80 |
0.62 |
|
P2 = Treatment 3 |
P2r2 |
12.64 |
120 |
0.66 |
|
P3 = Treatment 4 |
P3r2 |
12.64 |
160 |
0.75 |
|
P4 = Treatment 5 |
P4r3 |
12.64 |
200 |
0.89 |
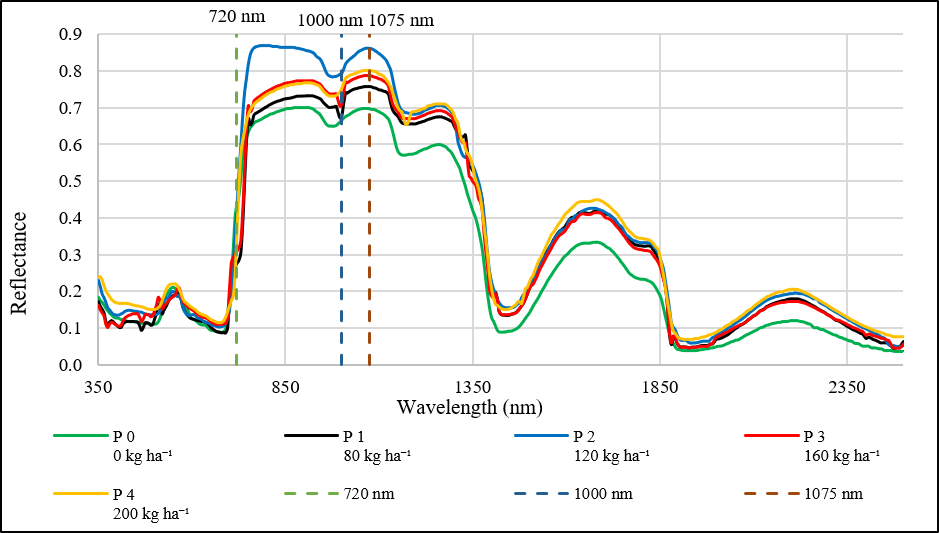
Figure 3 shows the spectral reflectance curves of the representative replicates; P0–P4 correspond to 0, 80, 120, 160, and 200 kg P₂O₅ ha⁻¹. Notable spectral differences are observed at 720 nm (red-edge), 1000 nm, and 1075 nm, which indicate some variation at a wavelength of 720 nm and a clear decrease in the curve at a wavelength of 1000 nm. However, the most significant differences, which could be indicative of the degree of variation between the samples, were at a wavelength of 1075 nm. Table 4 shows that the soil properties are consistent for all samples because they are the same soil. We observe that the texture is sandy loam, pH = 7.4, EC = 3.1 dS/m³, organic matter = 0.65%, and soil phosphorus P = 12.64 mg kg⁻¹. This means that the chemical properties of the soil, especially the available phosphorus, did not change between the treatments. Therefore, the subsequent observed differences in the plant's spectral curve are primarily attributed to the level of P₂O₅ fertilizer applied and the resulting physiological/chemical response within the plant, rather than to initial differences in the soil of each treatment. It should be noted that the p-value (12.64 mg/kg) falls within the critical range, depending on the crop type and soil properties (clay/oxides/phosphorus regulatory capacity). Thus, the fertilizer response may be evident in the plant even if the soil value appears to be average [19].
Figure 3. Spectral reflectance curves of the representative replicates
Table 4. Some physical and chemical properties of the soil under study
|
Soil Characteristics |
Quantity |
|
pH |
7.4 |
|
Electrical Conductivity, ds m-1 |
3.1 |
|
Organic matter, g kg-1 |
6.5 |
|
N, mg kg-1 |
49 |
|
P, mg kg-1 |
12.64 |
|
K, mg kg-1 |
80 |
|
Sand, g kg-1 |
424.5 |
|
Silt, g kg-1 |
300 |
|
Clay, g kg-1 |
275.5 |
|
Texture |
Sandy Loam |
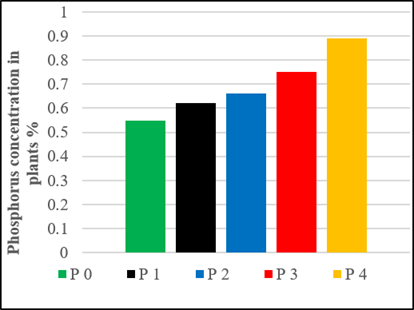
From Table 3, increasing phosphorus fertilizer level led to a corresponding increase in plant tissue P concentration, rising from 0.55% at P0 to 0.89% at P4. In contrast, the initial soil phosphorus was uniformly 12.64 mg kg⁻¹ across all pots (measured before fertilization), confirming that observed spectral differences are associated with plant physiological responses to absorbed P, rather than initial soil P variability. The spectral curves Visible-Near Infrared-Short Wave Infrared (VIS-NIR-SWIR) support this interpretation. The variations in the visible region and the red-edge may be associated with phosphorus-induced changes in possible changes in pigment composition (chlorophyll, carotenoids, anthocyanins) — as suggested by the literature — though pigments were not directly measured in the present study. The red-edge region has been reported to help discriminate phosphorus nutrition levels in several crops [20].
As for NIR radiation, it is generally related to the internal structure of the leaf and the scattering of light within mesophyll tissue. Its potential sensitivity to phosphorus nutritional status has been reported in recent studies, with the direction of the response varying by species and experimental conditions; however, since leaf internal structure was not directly measured in this study, the NIR response is interpreted as a possible indicator of P-induced structural changes [21].
Regarding the SWIR region (2200–2400 nm), this spectral area is associated with absorption features of biochemical components (proteins, cellulose, starch, sugars) and leaf water content. Since phosphorus may indirectly affect these components–though not directly measured in this study–the observed SWIR variation is tentatively attributed to phosphorus-mediated biochemical changes within the leaf [20, 22]. Therefore, Table 5 provides the reflectance values for the selected samples at different wavelengths. Values are from representative spectral curves; replication was limited by resources; therefore, SD was not calculated. Observing phosphorus at these wavelengths reveals what might be happening in the plant, and these values were obtained by intersecting the curve to find the reflectance value at the required wavelength [23]. Regarding the increased reflectivity in the third treatment, the P₂O₅ phosphorus treatments showed a gradual increase because the spectral response in the NIR range (800–1100 nm) followed a non-linear pattern; reflectivity values peaked in the third treatment and then decreased at higher levels. This indicates that the spectral signal does not directly represent phosphorus, but rather reflects intermediate changes in the leaf's internal structure and biochemical properties related to growth and nutritional status [24].
Table 5. Estimated spectral reflectance values for each phosphorus treatment
|
Treatment |
P₂O₅ kg ha⁻¹ |
P in Plant% |
R 800 |
R 1000 |
R 1100 |
R 1650 |
R 2250 |
|
P0 |
0 |
0.55 |
0.680 |
0.660 |
0.690 |
0.330 |
0.120 |
|
P1 |
80 |
0.62 |
0.740 |
0.720 |
0.740 |
0.420 |
0.170 |
|
P2 |
120 |
0.66 |
0.860 |
0.850 |
0.880 |
0.410 |
0.180 |
|
P3 |
160 |
0.75 |
0.760 |
0.740 |
0.770 |
0.430 |
0.190 |
|
P4 |
200 |
0.89 |
0.780 |
0.760 |
0.790 |
0.440 |
0.200 |
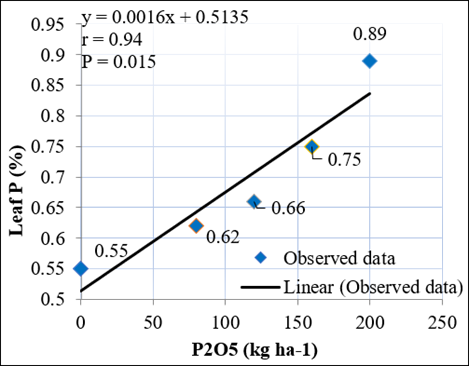
Figure 4. Pearson Correlation between P₂O₅ application rate and leaf phosphorus concentration
Exploratory Pearson correlation analysis (Figure 4) revealed a strong and statistically significant positive correlation between P₂O₅ application rate and leaf phosphorus concentration (r = 0.94, p = 0.015). Pearson correlation was calculated using the five treatment means (n = 5). Correlations between leaf P% and spectral reflectance were positive across all tested wavelengths, ranging from weak at R800–R1100 (r = 0.36–0.39, p > 0.05) to moderate-to-strong at R1650 and R2250 (r = 0.77 and 0.85, respectively), with the latter approaching statistical significance (p = 0.070). These trends, although not significant at α = 0.05, are likely attributable to the limited number of treatment levels (n = 5) and warrant further investigation with a larger sample size.
Figure 5. Shoot dry weight
The results showed a general improvement in shoot dry weight with phosphate fertilization concentration, as shown in Figures 5 and 6, although the trend was not strictly linear. The control (P0) recorded 1.21 g, while Treatment 4 (160 kg P₂O₅ ha⁻¹) achieved the highest value at 1.35 g, with slight variation at higher levels. This non-linear response suggests that moderate phosphorus availability optimizes physiological efficiency; phosphorus plays a fundamental role in organic compound formation and carbohydrate transport, contributing to dry matter accumulation [25].
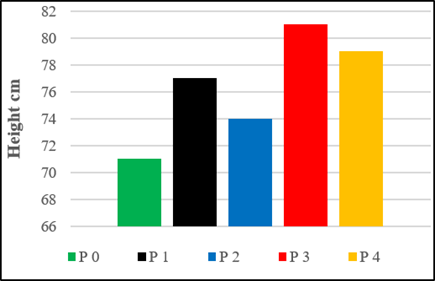
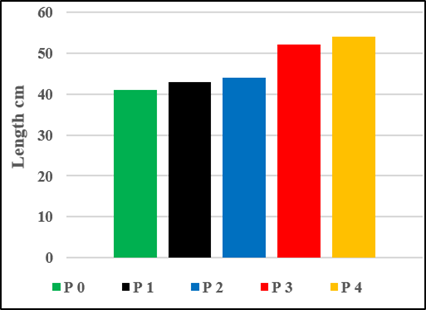
The effect of phosphate fertilization also affects plant growth characteristics through root and shoot length, as shown in Figures 7-9, respectively. Plant length generally increased with phosphorus fertilization, reaching a maximum value of 81 cm at treatment 4 (160 kg ha⁻¹ P₂O₅), compared with 71 cm in the control treatment. A slight reduction was observed at treatment 5 (200 kg ha⁻¹), where plant length decreased to 79 cm. These results indicate that phosphorus application promoted vegetative growth up to an optimum level, beyond which additional fertilizer provided little further improvement in plant height. The results indicate that root length increased with increasing levels of phosphate fertilization at the initial concentration of 80, compared to the other phosphorus levels, which did not produce any increase with fertilization levels. This suggests that the availability of phosphorus at increasing concentrations in the rhizosphere led to a lack of root activation and elongation in search of phosphorus [26]. Shoot length increased steadily with increasing phosphorus application, from 41 cm in the control treatment to 54 cm at treatment 5 (200 kg ha⁻¹ P₂O₅). This response indicates that phosphorus availability promoted aboveground vegetative growth, likely through enhanced energy transfer, photosynthesis, and biomass accumulation. The continuous increase in shoot length suggests that phosphorus was effectively utilized to support stem and leaf development.
Figure 6. Percentage of Phosphorus concentration in plants
Figure 7. Plant height growth
Figure 8. Root length
Figure 9. Shoot length
Regarding the number of root nodules, the results showed in Figure 10 that treatment 4 produced the highest number of root nodules with increasing levels of phosphate fertilization. This is attributed to the fact that root nodule formation is a vital process requiring high energy, as it depends on the availability of energy compounds within the plant. Phosphorus has a regulatory capacity in root nodule formation and growth performance. The increase was not significant with increasing nodule number [27].
Figure 10. Number of root nodules
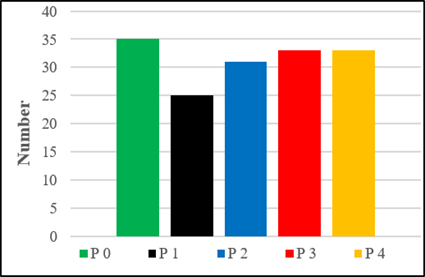
As for leaf number showed in Figure 11, the control treatment (P0) produced the highest count (35 leaves/plant) compared to all fertilized treatments. Phosphorus application did not increase leaf number; instead, it caused an initial decrease followed by partial recovery without surpassing the control. This is attributed to phosphorus availability shifting carbon distribution from vegetative growth toward physiological and reproductive equilibrium–a pre-reproductive transition–thus limiting new leaf formation. The response of leaf number to phosphate fertilization is highly dependent on growth stage and application timing, and early fertilization may accelerate the transition from vegetative to reproductive stages without increasing foliar characteristics [28].
Figure 11. Leaves number
This preliminary study demonstrated that broad bean leaf spectral reflectance is sensitive to phosphate fertilization levels, particularly in the red-edge region (~720 nm), NIR regions around 1000-1075 nm, and SWIR regions around 1650 and 2250 nm. Plant P concentration increased progressively from 0.55% to 0.89% with increasing P₂O₅ application, and growth indicators generally responded positively, though non-linearly. The observed spectral variation may be associated with P-induced changes in plant physiology and pigment composition, consistent with the literature; however, since these variables were not directly measured, such mechanisms remain hypotheses. These findings are exploratory, based on single representative replicates without formal statistical modeling. Future work should involve full spectral replication, phosphorus-sensitive spectral indices (red-edge position, PRI, SWIR-based), PLSR modeling, and multi-stage measurements. If validated, spectral signature analysis could offer a rapid, non-destructive alternative to chemical P analysis in broad bean crops.
The authors would like to express their sincere gratitude to the College of Agriculture and Forestry, University of Mosul, for its valuable support and encouragement.
[1] Kulesza, K., Hawryło, P., Socha, J., Hościło, A. (2025). How reliable are the spectral vegetation indices for the assessment of tree condition and mortality in European temporal forests? Remote Sensing, 17(15): 2549. https://doi.org/10.3390/rs17152549
[2] Ji, J., Lu, X., Ma, H., et al. (2025). Estimation of plant leaf water content based on spectroscopy. Frontiers in Plant Science, 16. https://doi.org/10.3389/fpls.2025.1609650
[3] Li, Y., Du, J., Zeng, C., et al. (2025). Reconstructed hyperspectral imaging for in-situ nutrient prediction in pine needles. Frontiers in Plant Science, 16: 1630758. https://doi.org/10.3389/fpls.2025.1630758
[4] Yang, J., Shen, G., Qin, J. (2025). Non-destructive sensing of nitrogen and phosphorus contents in plants via hyperspectral imaging of Hydrangea macrophylla at the seeding stage. Scientia Horticulturae, 347: 114144. https://doi.org/10.1016/j.scienta.2025.114144
[5] Kiddee, S., Daengngam, C., Wongarrayapanich, S., Lau, J.Y., Cheng, A., Klinnawee, L. (2026). Detection of phosphorus deficiency using hyperspectral imaging for early characterization of asymptomatic growth and photosynthetic symptoms in maize. Agronomy, 16(8): 772. https://doi.org/10.3390/agronomy16080772
[6] Okyere, F.G., Cudjoe, D., Sadeghi-Tehran, P., et al. (2023). Modeling the spatial-spectral characteristics of plants for nutrient status identification using hyperspectral data and deep learning methods. Frontiers in Plant Science, 14: 1209500. https://doi.org/10.3389/fpls.2023.1209500
[7] Khajehyar, R., Vahidi, M., Tripepi, R. (2024). Using hyperspectral signatures for predicting foliar nitrogen and calcium content of tissue cultured little-leaf mockorange (Philadelphus microphyllus A. Gray) shoots. Plant Cell, Tissue and Organ Culture, 157(3): 60. https://doi.org/10.1007/s11240-024-02765-x
[8] Kazanskiy, N., Khabibullin, R., Nikonorov, A., Khonina, S. (2025). A comprehensive review of remote sensing and artificial intelligence integration: Advances, applications, and challenges. Sensors, 25(19): 5965. https://doi.org/10.3390/s25195965
[9] Jafarbiglu, H., Pourreza, A. (2022). A comprehensive review of remote sensing platforms, sensors, and applications in nut crops. Computers and Electronics in Agriculture, 197: 106844. https://doi.org/10.1016/j.compag.2022.106844
[10] Wang, D., Liu, Z., Dian, Y., Zhou, Z., Fang, S. (2018). Potential of detecting the sulfur dioxide stress on landscape plants in spectral reflectance data. Journal of the Indian Society of Remote Sensing, 46(4): 561-568. https://doi.org/10.1007/s12524-017-0717-3
[11] Kana, T.M., Miller, J.H. (1977). Effect of colored light on stomatal opening rates of Vicia faba L. Plant Physiology, 59(2): 181-183. https://doi.org/10.1104/pp.59.2.181
[12] Pawełek, A., Wyszkowska, J., Cecchetti, D., Dinka, M.D., Przybylski, K., Szmidt-Jaworska, A. (2022). The physiological and biochemical response of field bean (Vicia faba L.(partim)) to electromagnetic field exposure is influenced by seed age, light conditions, and growth media. Agronomy, 12(9): 2161. https://doi.org/10.3390/agronomy12092161
[13] Xu, N., Niu, J., Guo, Z., Wang, Q., Chen, Z. (2025). Nitrogen–phosphorus stoichiometry shapes seedling growth and yield performance of perennial cool-season forage grasses in saline–alkali soil. BMC Plant Biology, 25(1): 1445. https://doi.org/10.1186/s12870-025-07092-7
[14] Sarda, X., Diquelou, S., Abdallah, M., et al. (2013). Assessment of sulphur deficiency in commercial oilseed rape crops from plant analysis. Journal of Agricultural Science, 152(4): 616-633. https://doi.org/10.1017/s0021859613000105
[15] Khdery, G.A., El-Metwally, I.M., Shokr, M.S., Meroño de Larriva, J.E., Aldosari, A.A. (2025). Analysis of spectral signatures and vegetation indices to assess the response of faba bean plants to varying zinc levels under sandy soil conditions. Frontiers in Environmental Science, 13: 1706260. https://doi.org/10.3389/fenvs.2025.1706260
[16] Panek-Chwastyk, E., Paradowski, K., Rutkowska, B., Szulc, W., Dzierżanowski, I. (2025). Advancing early-stage plant phosphorus assessment for winter rye via hyperspectral data: A model-based approach harnessing feedforward neural networks. European Journal of Agronomy, 169: 127667. https://doi.org/10.1016/j.eja.2025.127667
[17] Schuffelen, A.C., Muller, A., Van Schouwenburg, J.C. (1961). Quick-tests for soil and plant analysis used by small laboratories. Netherlands Journal of Agricultural Science, 9(1): 2-16. https://doi.org/10.18174/njas.v9i1.17630
[18] AlQaisi, S.M., Al-Wazzan, F.A., Albayati, H. (2026). Synergistic effects of nano-NPK and organic fertilization on potato yield and soil nutrient availability under drip irrigation. International Journal of Design & Nature and Ecodynamics, 21(2): 417-424. https://doi.org/10.18280/ijdne.210210
[19] Recena, R., Díaz, I., del Campillo, M.C., Torrent, J., Delgado, A. (2016). Calculation of threshold Olsen P values for fertilizer response from soil properties. Agronomy for Sustainable Development, 36(4): 54. https://doi.org/10.1007/s13593-016-0387-5
[20] Siedliska, A., Baranowski, P., Pastuszka-Woźniak, J., Zubik, M., Krzyszczak, J. (2021). Identification of plant leaf phosphorus content at different growth stages based on hyperspectral reflectance. BMC Plant Biology, 21(1): 28. https://doi.org/10.1186/s12870-020-02807-4
[21] Zhang, Y., Wang, T., Li, Z., Wang, T., Cao, N. (2023). Based on machine learning algorithms for estimating leaf phosphorus concentration of rice using optimized spectral indices and continuous wavelet transform. Frontiers in Plant Science, 14: 1185915. https://doi.org/10.3389/fpls.2023.1185915
[22] Sawut, M., Hu, X., Abulaiti, Y., et al. (2025). Estimation of leaf phosphorus content in cotton using fractional order differentially optimized spectral indices. Plants, 14(10): 1457. https://doi.org/10.3390/plants14101457
[23] Aydin, O., Yassikaya, M.Y. (2021). Validity and reliability analysis of the PlotDigitizer software program for data extraction from single-case graphs. Perspectives on Behavior Science, 45(1): 239-257. https://doi.org/10.1007/s40614-021-00284-0
[24] Yu, M., Zeng, J., Li, Y., et al. (2025). Near-infrared prediction of total phosphorus in leaves content in Korla fragrant pear with growth period specificity via spectral modeling. Frontiers in Plant Science, 16: 1666460. https://doi.org/10.3389/fpls.2025.1666460
[25] Wang, X., Yang, J., Liu, H., Qu, X., Xu, W. (2025). Influence of long-term fertilization on carbon, nitrogen, and phosphorus allocation and homeostasis in cotton under the regulation of phosphorus availability. Agronomy, 15(12): 2886. https://doi.org/10.3390/agronomy15122886
[26] Nadeem, M., Wu, J., Ghaffari, H., et al. (2022). Understanding the adaptive mechanisms of plants to enhance phosphorus use efficiency on podzolic soils in boreal agroecosystems. Frontiers in Plant Science, 13: 804058. https://doi.org/10.3389/fpls.2022.804058
[27] Qin, L., Zhao, J., Tian, J., et al. (2012). The high-affinity phosphate transporter GmPT5 regulates phosphate transport to nodules and nodulation in soybean. Plant Physiology, 159(4): 1634-1643. https://doi.org/10.1104/pp.112.199786
[28] Liu, J., Wang, D., Yan, X., et al. (2024). Effect of nitrogen, phosphorus and potassium fertilization management on soil properties and leaf traits and yield of Sapindus mukorossi. Frontiers in Plant Science, 15: 1300683. https://doi.org/10.3389/fpls.2024.1300683