Moqtik Bawase | Ravi Sekhar* | Naman Kumar | Sukrut Thipse
© 2026 The authors. This article is published by IIETA and is licensed under the CC BY 4.0 license (http://creativecommons.org/licenses/by/4.0/).
OPEN ACCESS
As a result of increased urbanization, the road transport sector is one of the major sources of air pollution as well as greenhouse gas (GHG) emissions. Alternative fuels, such as biomethane is one of the alternative sources of fuel, with several environmental benefits. Environmental Impacts, for 18 mid-level impact categories, of Compressed Biogas (CBG), generated using Press Mud (PM) and Napier Grass (NG) as feedstocks, followed by its purification using Pressure Swing Adsorption (PSA), Membrane Separation, and Amino Washing (AW) to manufacture biomethane, compressed for its use as a fuel in automobiles, were studied using Life Cycle Assessment (LCA) following the Recipe method. Hotspot analysis was performed to identify critical steps in terms of environmental impact, focusing on Global Warming Potential (GWP). Sensitivity analysis was performed for critical input parameters. Results of LCA show that GWP was in the range of 0.997 kg CO₂ eq. to 1.368 kg CO₂ eq. for 1 m3 of biomethane generation. Leakage of CH₄ gas, quality of feedstock/ bio-gas yield, electricity, and heat inputs were found to be the most critical aspects for GWP. The study provided vital information on the sources of emissions and also suggested critical areas for improvement in the GWP performance of different feedstock- purification technique combinations.
Compressed Biogas, Compressed Natural Gas, Life Cycle Assessment, biomethane, alternate fuels, cradle-to-gate
The steadily growing population, urbanisation, and industrialisation are leading to an increase in food and energy demands, which are aggravating the environmental challenges [1]. Automobiles are one of the major sources of air pollution and also emit CO₂, leading to greenhouse gas (GHG) emissions. Replacing fossil fuels with renewable energy alternatives has become a major global topic of the 21st century and a key to sustainable development [2]. Compressed Biogas (CBG), which has the potential to replace Compressed Natural Gas (CNG), is an alternative fuel with more than 95% CH₄ as per IS 16087:2025 to be used in Natural Gas Vehicles (NGVs). In India, biogas is manufactured by Anaerobic Digestion (AD) of diverse feedstock such as press-mud (Agri-residue), cattle dung, and Municipal Solid Waste (MSW) as per the availability near the manufacturing plant. The biomass is further purified to produce bio-methane by increasing the CH₄ content to use it in NGVs [3].
The manufacturing of CBG starts with the cultivation of feedstocks by farmers, such as Napier Grass (NG), or from the generation of waste by industries, Press Mud (PM). The feedstock is procured by biogas manufacturers and transported to their production site. The biogas can also be manufactured with a variety of feedstocks like cow dung, waste biomass, Agri-residue, MSW, etc. [4]. After pre-treatment of the feedstocks, it is sent to anaerobic digesters for bacterial breakdown of the organic matter of the feedstock in the absence of oxygen. This biological process converts the waste feedstock into biogas through four stages, including hydrolysis, acidogenesis, acetogenesis, and methanogenesis. There are research studies available for the optimum temperature conditions and a favourable mixture of feedstock for the AD [5-7]. Two products come out of this process: biogas and liquid slurry. This liquid slurry can be directly fed to agricultural land as organic manure or transformed into high-value fertilizers first and then used in agriculture to replace chemical fertilizers with organic manures [8]. The generated biogas mainly contains, on an average 55% – 65% of methane, 25%-35% CO₂ [9]. Hydrogen sulphide (H2S) and trace elements are also present in small amounts [10]. Since this is not compatible to be used in automobiles, the CH₄ content in biogas is enhanced by purification to remove the CO₂ & H2S by Pressure Swing Adsorption (PSA) [11], Water/Chemical Scrubbing [12, 13], Membrane Technique (MT) [14], etc. The purified biogas (biomethane) is then compressed to 200-250 bar pressure to make it compatible with natural gas, to be used in automobiles [15]. Through the Sustainable Alternative Towards Affordable Transportation (SATAT) scheme, an initiative by the Ministry of Petroleum and Natural Gas (MoPNG) launched in 2018, a number of CBG manufacturing plants are being set up [16].
It is important to understand the overall emissions of any alternative fuel through its entire life cycle. This Life Cycle Assessment (LCA) study will also help in identifying the hotspots for biomethane manufacturers to further innovate the process by researchers, so that the environmental impacts of biomethane manufacturing can be brought to a minimum value [17]. The quantified sustainability score from the LCA study helps in supporting the government mandate of promoting the manufacturing of biomethane/CBG for the replacement of natural gas or fossil fuels with it.
A study was conducted with the goal of quantifying the environmental impacts of biomethane manufacturing, exploring the hotspots in the AD and purification techniques, and potential solutions to reduce the environmental impacts of biomethane manufacturing. The intended audience for this study includes biogas manufacturers, CBG manufacturers, CNG vehicle owners, academicians, researchers, and policymakers in the field of biogas and CBG. A cradle-to-gate LCA study is conducted for CBG. PM and NG are studied for biomethane manufacturing. As the majority of the operational plants are based on PM as a feedstock in India, it is selected for this study. PM is available as a waste product; therefore, associated environmental impacts (cut-off) are not considered for the same. Since NG is cultivated for the purpose of using it in biogas/biomethane manufacturing, the impacts from the cultivation of the grass need to be considered in a cradle-to-gate LCA study. The scope of the current study is shown in Figure 1, where the processes considered in the study boundary are colored in blue, main products like feedstock, biogas, and biomethane are shown in blue colored shape with red borders, and the rest grey colored shape are out of the scope of this study. In this paper, a comparison of environmental impacts for three purification methods, viz. PSA, MT, and Amino Washing (AW) are also presented with the help of the SimaPro LCA tool version 3.10.0.1.
Figure 1. System boundaries for the Life Cycle Assessment (LCA) study of Compressed Biogas (CBG) (coloured in blue) with feedstock, intermediate biogas, and final CBG are shown inside a box with a red border
1.1 Feedstocks
PM (also referred to as filter cake) is a residual by-product generated during the clarification of sugarcane juice in sugar mills. Its yield typically falls within the range of 3-4% weight-by-weight relative to the sugarcane processed in a unit. As a feedstock for CBG production, PM has several advantages over other sources of biomass. It does not contain the organic polymer lignin, and so the pre-treatment cost is substantially reduced, which is not the case with other agri-residues. However, PM has less inorganic content in comparison to MSW, which reduces the gas output by slowing the AD. In terms of conversion efficiency, approximately 25 t of PM is required to produce 1 t of CBG. The availability, high conversion efficiency, and minimal pre-treatment requirements make PM the predominant feedstock for operational CBG plants under the SATAT scheme in India, and it is therefore selected as one of the feedstocks for this study.
NG (commonly referred to as elephant grass) is a fast-growing perennial energy crop native to tropical and subtropical regions. Its rapid growth rate and high biomass productivity, of more than 50 t dry mass per hectare annually and a potential of 200 t dry mass per hectare annually, make it an ideal feedstock for large-scale CBG production [18-21]. It has a high content of cellulose and hemicellulose, which is important for effective AD and results in good biogas yields. The range of biogas yield from NG is around 150 m3/t, equivalent to 60 kg of CBG [22]. Pre-treatment method like microbial pre-treatment of the feedstock, can enhance this yield further. Some studies have demonstrated higher biogas yields with less Hydraulic Retention Time (HRT) using novel technologies like a developed thermophilic consortium at 52 ℃ [23, 24]. Unlike PM, which is a waste by-product and thus assigned zero environmental burden under the cut-off approach in this LCA, NG is cultivated specifically for energy purposes, necessitating inclusion of cultivation-stage impacts within the system boundary of a cradle-to-gate study.
1.2 Anaerobic digestion
AD is the biological process where organic feedstocks are broken down by microorganisms in the absence of oxygen to produce the raw biogas and digestate as by-products. The produced raw biogas is composed mainly of CH₄ and CO₂. This is done in four stages of breakdown, namely hydrolysis, acidogenesis, acetogenesis, and methanogenesis.
Process performance in AD is governed by temperature - mesophilic (35–37 ℃) or thermophilic (50–55 ℃) organic loading rate (OLR), pH, and solids retention time. The carbon-to-nitrogen ratio of the feedstock is also critical, with an optimal range of 20:1 to 30:1 recommended for better digestion. The two main outputs of the AD process are biogas and a liquid digestate, which can be used as manure.
1.3 Biogas purification
1.3.1 Pressure Swing Adsorption
In this purification technique, the biogas from the AD is made to pass through several columns with adsorbents, where the impurities are adsorbed, and CH₄ comes out with 96% purity [25]. Zeolites, activated carbon, activated aluminum, silica gel, etc., are commonly used chemicals for the PSA purification method [11]. In the current study, the modelling for PSA is done with the Ecoinvent database values, which reflect contemporary multi-stage PSA, which has very low CH₄ slip (1.25%) in comparison to early-stage PSA systems.
1.3.2 Membrane technique
This purification method works on the basic principle of selective permeability. Polymeric membranes such as cellulose acetate and polyimides are used, which don’t allow CH₄ to pass through them, and CH₄ with 97% purity can be obtained. CO2 has higher permeability towards such membranes in comparison to CH4 [26]. The CH₄ concentration is increased in the feed biogas as CO2 permeates through the membranes. To achieve higher efficiency, multi-stage membranes are used. H2S is removed, due to its corrosive nature, by activated carbon before passing the gas through membranes to avoid damage to membranes.
1.3.3 Amino Washing
The biogas generated after the AD contains H2S, which is removed, and the H2S-free biogas is passed through the Mono-ethanolamine (MEA) in an absorption column. The CO₂ is absorbed by MEA, and CH₄ with higher purity (99%) comes out of the absorption column [27]. The solution of MEA with absorbed CO₂ is taken to a regenerative column, and the solution is heated to 140 ℃. This heating regenerates the aqueous MEA solution without CO2, which can be reused to absorb CO2, and the cycle continues [28].
1.4 Biogas compression
After purification, the biogas with CH₄ content exceeding 95% (as per the requirement of ISO 16087:2025) is compressed to a high pressure of up to 250 bar, so that the energy density of the biomethane is suitable for vehicular application and practical storage like CNG. It is done using multi-stage reciprocating compressors, which are equipped with inter-stage cooling to manage the heat of compression and maintain their mechanical integrity [29]. The compressed biomethane is then dispensed into cascades (high-pressure cylindrical vessels) for storage and dispatch.
1.5 Compressed Biogas transportation
The transportation distance from the CBG plant to the dispensing station is a crucial parameter that influences the well-to-wheel GHG emission profile of CBG. Physical and chemical properties of CBG are similar to those of fossil CNG, and the existing dispensing infrastructure for CNG can be used without significant capital modification.
1.6 Usage in vehicles
A vehicle running on CNG can be directly filled with CBG from the dispensing station without any modification to the vehicle [30]. The combustion of CBG in NGVs substantially reduces the tailpipe emissions of particulate matter, NOₓ, and CO₂ compared to diesel or petrol, and CO₂ emissions do not contribute to the net addition to atmospheric carbon, being biogenic in nature.
The current study excludes the environmental impacts from biogas compression, transportation, and its usage in vehicles, keeping the boundary of the study till the purification of biogas to biomethane.
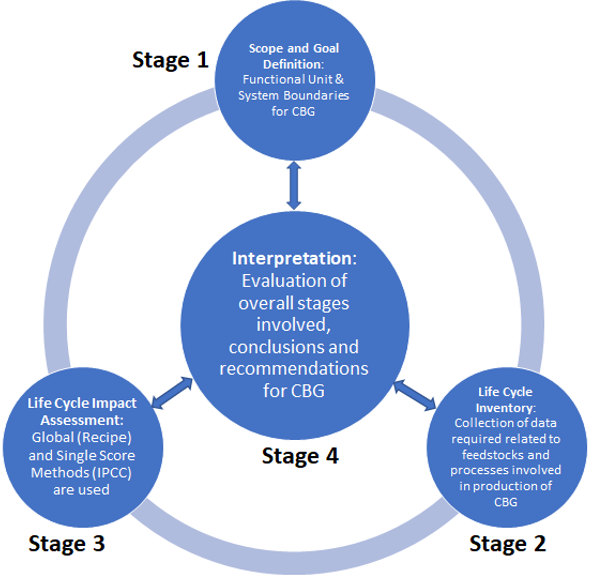
The study has been conducted as per the international standards, i.e., ISO 14040:2006 and ISO 14044:2006 [31, 32]. The International Reference for Life Cycle Data (ILCD) Handbook guidance was used for impact assessment method selection, impact categories selection, and data quality assessment [33]. Four stages for LCA of CBG as per the ISO 14040 are shown in Figure 2. Due to the privacy concern with the manufacturers, Primary data could not be furnished; and so secondary data like feedstock quantities for biogas, energy requirements in the form of heat and electricity at biogas manufacturers from the Indian literature [34] and background processes with the other remaining data like auxiliary inputs, emissions, purification inputs, CH₄ leakages are taken from the Ecoinvent 3.11 database [35-37]. Energy inputs (electricity and heat) and feedstock characterisation were modelled using Indian-specific literature to ensure regional representativeness. Electricity-related emissions were calculated using the latest grid mix emission factors published by the Central Electricity Authority (CEA) of India. A screening LCA was initially performed using the available Ecoinvent database to identify the key input parameters for modelling. The model was subsequently refined with contextual data from the literature.
There are multiple functions of CBG, such as energy source, transportation fuel, power generation, domestic cooking, and heating for commercial purposes. In this study, transportation is considered the main function of biomethane. Though the function is transportation, instead of choosing a functional unit of passenger-km, the declared unit is set at 1 m3 of biomethane, as the study is cradle-to-gate, where biomethane at 5 bar pressure is generated with a lower heating value of 35 MJ, a 0.732 kg/m3 density (dry basis), and a CH₄ composition equal to or higher than 95%. To understand the environmental impacts of a biomethane plant and to make the study a decision-making tool for manufacturers and policymakers, it is chosen as a declared unit. For academicians, researchers, and other stakeholders willing to scale up the impacts for 1 kg or t of biomethane or representing it in terms of energy units (MJ), the results can be multiplied with the help of a conversion factor (density or lower heating value).
Figure 2. Stages of Life Cycle Assessment (LCA) of Compressed Biogas (CBG) as per ISO 14040
In this study, two feedstocks for biogas production with three different purification techniques for biomethane production are discussed and compared. In this study, two of the feedstocks, i.e., PM, an industrial waste feedstock, as well as NG, an agricultural feedstock also known as energy stock, are analysed for their environmental impacts. PM is considered waste material, and the environmental impact from the cultivation stage, juice extraction stage, and clarification of juice is excluded from the study. The impact of the transportation of CBG to gas stations and its consumption in automobiles is outside the boundary of the study and is also not considered.
After the goal and scope definition, the Life Cycle Inventory (LCI) data collection is conducted for the processes involved under the study scope with the help of SimaPro modelling software and Ecoinvent, version 3.11, for the background database. Indian specific data is selected and modelled to make the study relevant for the Indian geographic location. The LCI, which is the balance of material and energy flows to and from the system, was populated with the help of the Ecoinvent database and literary sources and formal discussion with CBG manufacturers to identify and remove the major discrepancies in the model. The inventory was categorised into two main sections. The first one is AD, covering both feedstocks, and the other one is the purification of the biogas with three techniques. Since the purification technique is dependent on the biogas generated from the feedstock and not directly on the feedstock, the inventory of different purification techniques is the same for PM and NG.
After the inventory modelling, a Life Cycle Impact Assessment (LCIA) was conducted to get the impact value associated with the input materials, processes, and their interaction in the different environmental parameters. A global and most widely adopted assessment method, Recipe 2016 Midpoint with Hierarchist (H) perspective, and Intergovernmental Panel on Climate Change (IPCC) 2021 Global Warming Potential (GWP) 100 for GHG-focused analysis were selected. In the Recipe, the Hierarchist perspective was selected as it gives the scientific consensus on time horizons and environmental cause-effect relationships. It is recommended for policy-relevant LCA studies as it gives a balanced result between the short-term of the individualistic perspective and the precautionary view of the Egalitarian perspective.
There are 18 environmental impact categories in Recipe Midpoint, which comprehensively convert to three endpoint damage categories, i.e., human health, ecosystem quality, and resource availability. Since midpoint categories have greater scientific certainty and are easily traceable to the inventory, the study has discussed the midpoint impacts. The Recipe 2016 Midpoint, with Hierarchist cultural perspective as well as IPCC 2021 GWP 100 impact assessment method, was selected in the study for six production pathways, three purification technologies - PSA, MT, and AW for both the feedstocks (PM and NG). The results are run for 1 m3 of biomethane. The recipe midpoint method gives impact result in 18 impact categories, which include global warming.
LCA is one of the important objectives of identifying hotspots in the processes or raw materials involved so that proper intervention can be planned to reduce the environmental impact. The hotspot analysis is done with Recipe 2016 Midpoint with Hierarchist (H) perspective. The LCIA for the purification technique with six possible combinations is conducted with the Recipe 2016 Midpoint with Hierarchist (H) perspective for GWP hotspots identification.
The sensitivity analysis is performed using Recipe 2016 Midpoint with Hierarchist (H) perspective method, by altering the value of a specific parameter (electricity, heat, CH₄ leakage, and biogas yield of the feedstock), keeping the other values constant.
LCI for the defined goal and boundary of the study was prepared by collecting the data for subsequent life cycle modelling.
3.1 Life Cycle Inventory
3.1.1 Anaerobic digestion
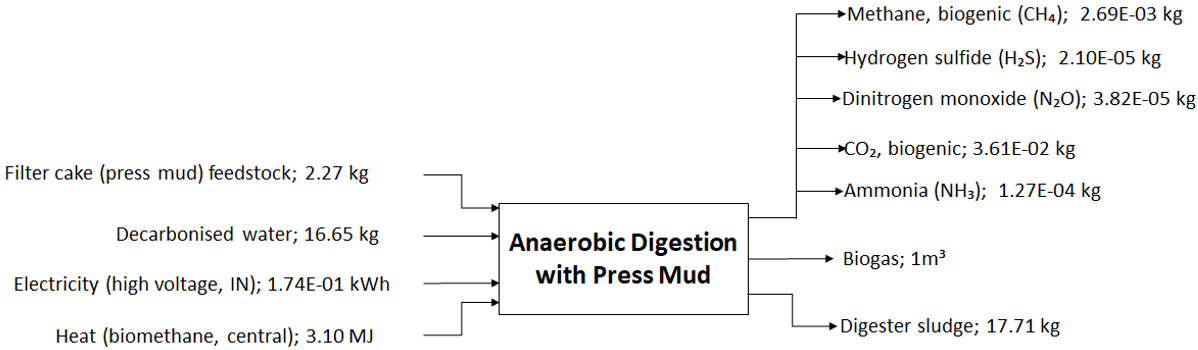
AD of PM. To produce 1 m³ of biogas from PM via AD, 2.27 kg of filter cake feedstock, along with decarbonised water, electricity sourced from the Indian grid, and heat supplied through natural gas, is needed (Figure 3). The output is digester sludge as a by-product, being cut off from the study scope. The atmospheric emissions from this stage include CO₂, CH₄, NH₃, dinitrogen monoxide (N₂O), and H₂S. In this case, the CO₂ and CH₄ are biogenic in nature due to the feedstock source.
Figure 3. Life Cycle Inventory (LCI) for Anaerobic Digestion (AD) of Press Mud (PM) feedstock
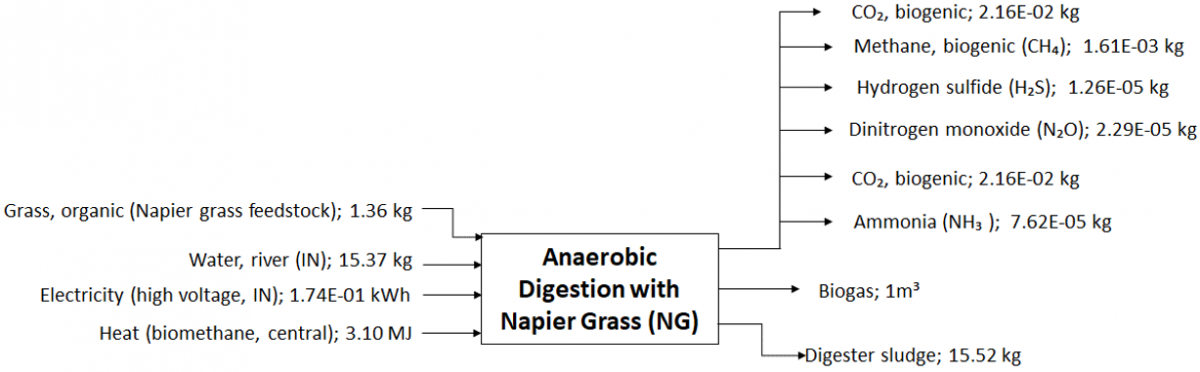
AD of NG. The AD of NG reflects a fundamentally different upstream profile, as this feedstock is cultivated specifically for energy use and therefore carries associated agricultural and resource burdens. The production of 1 m³ of biogas requires an input of 1.36 kg of organic grass (NG feedstock), 15.37 kg of river water, electricity, and heat. Compared to the PM pathway, NG digestion requires notably less water and electricity. Atmospheric emissions from AD of NG consist of biogenic CO₂ & CH₄, NH₃, N₂O, H₂S, and water emissions. As shown in Figure 4, all input values for NG are lower than their PM counterparts, due to the lower feedstock requirement per unit of biogas produced.
Figure 4. Life Cycle Inventory (LCI) for Anaerobic Digestion (AD) of Napier Grass (NG) feedstock
3.1.2 Biogas purification
The raw biogas entering all three purification systems has the composition (dry basis) of 63.3% CH₄, 33.4% CO₂, 3.2% N₂, and 0.0005% H₂S by volume. There are other gases like O2, NH3, and Volatile Organic Compounds (VOCs) present in trace quantities. Since the purification technology inventory is identical regardless of whether PM or NG is used upstream, the flows below apply to both feedstock pathways.
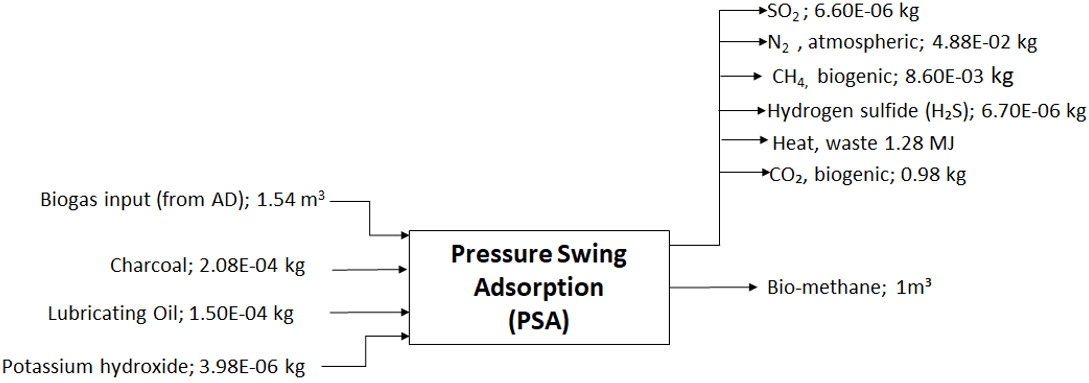
PSA requires 1.536 m³ of raw biogas per m³ of biomethane, along with charcoal, lubricating oil, potassium hydroxide, and electricity. The atmospheric emissions from PSA upgrading comprise biogenic CO₂, fugitive biogenic CH₄, N₂, H₂S, SO₂, and 1.28 MJ of waste heat, as shown in Figure 5. The final biomethane after the purification has the composition of 96% CH₄, 2% CO₂, 1% N₂, and 0.0003% H₂S by volume.
Figure 5. Life Cycle Inventory (LCI) for the Pressure Swing Adsorption (PSA) purification technique
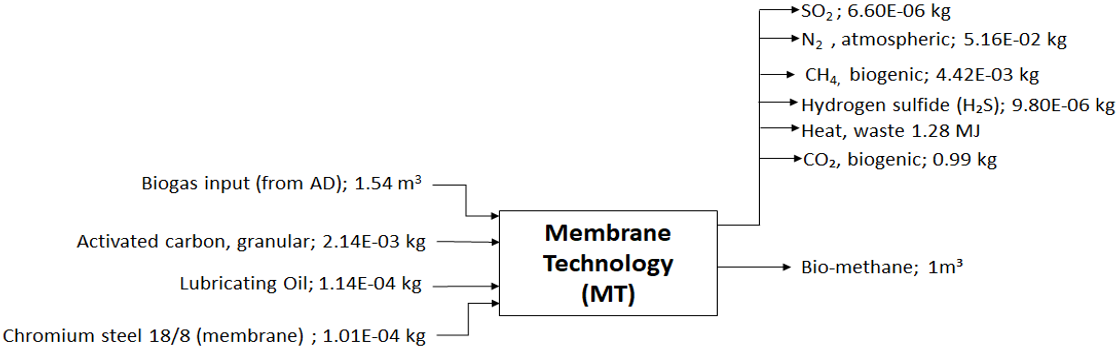
MT requires a slightly higher biogas input of 1.542 m³ per m³ of bio-methane, as shown in Figure 6. The input materials are granular activated carbon (for H₂S pre-treatment), lubricating oil, and 18/8 chromium steel, representing the membrane material. However, the most significant distinguishing feature of this method is its substantially higher electricity consumption of 0.575 kWh, more than three times that of PSA, reflecting the energy demand of multi-stage compression required to drive gas separation across the polymeric membrane. Atmospheric emissions include CO₂, fugitive biogenic CH₄ (methane slip of 0.64%, considerably lower than PSA), N₂, H₂S, SO₂, and 1.28 MJ of waste heat. The biomethane composition after the purification is measured to be the following: 97% CH₄, 1.5% CO₂, 0.8% N₂, and 0.0002% H₂S by volume.
Figure 6. Life Cycle Inventory (LCI) for the Membrane Technique (MT) purification technique
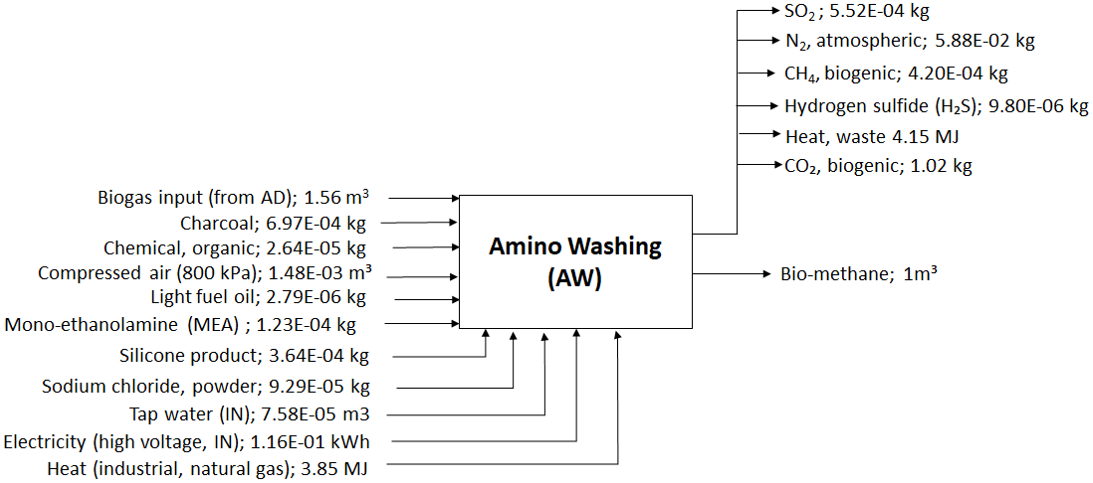
Figure 7. Life Cycle Inventory (LCI) for Amino Washing (AW) purification technique
AW requires 1.565 m³ of biogas input, along with charcoal, organic chemicals, compressed air at 800 kPa, light fuel oil, MEA, the active absorbent, silicone product, sodium chloride powder, and tap water. Electricity consumption of 0.116 kWh is the lowest of the three methods. But an additional 3.852 MJ of industrial natural gas heat is required for MEA regeneration at 140 ℃, which represents a significant thermal energy demand not present in PSA or MT. Atmospheric emissions include biogenic CO₂, waste heat, H₂S, and fugitive biogenic CH₄, corresponding to a CH₄ slip of just 0.06%, which is the lowest across all purification technologies as presented in Figure 7. And the final output of biomethane after the purification comes with the composition of 99% CH₄, 0.5% CO₂, 0.3% N₂, and 0.0001% H₂S by volume.
3.2 Life Cycle Impact Assessment and interpretation
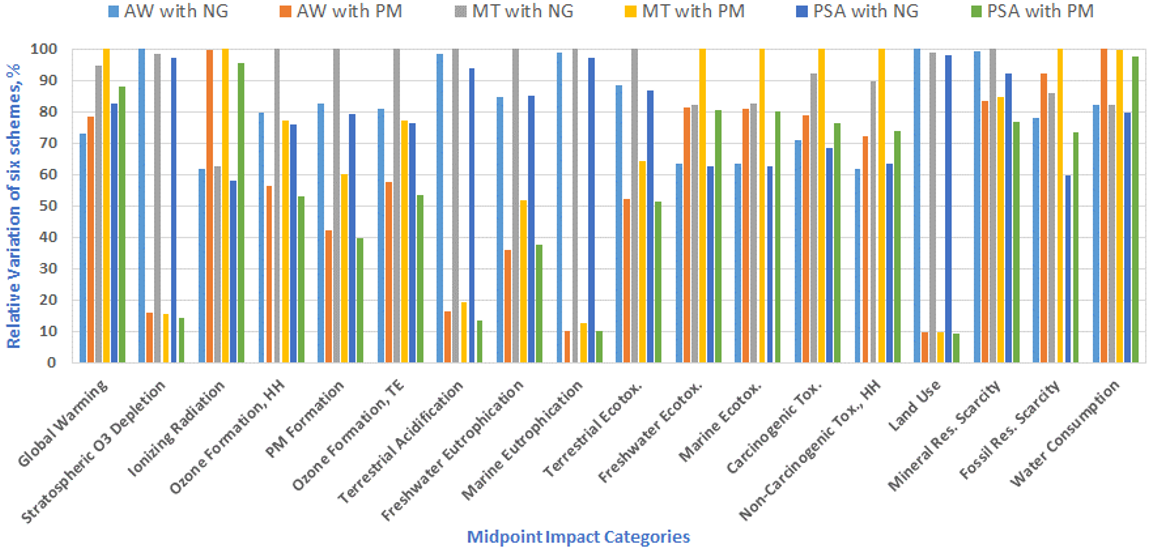
The results of LCIA with relative variation, considering the max impact values for the respective impact category as 100, are presented in Figure 8, and absolute impact scores for the midpoint impact categories for six routes of biomethane manufacturing are given in Table 1.
Figure 8. Life Cycle Impact Assessment (LCIA) of 6 different routes for biomethane with relative variation among midpoint impact categories
Table 1. Results of LCIA for various impact categories
|
Impact Category |
Unit |
AW with NG |
AW with PM |
MT with NG |
MT with PM |
PSA with NG |
PSA with PM |
|
Global warming |
kg CO2 eq |
9.97E-01 |
1.07E + 00 |
1.29E + 00 |
1.37E + 00 |
1.13E + 00 |
1.21E + 00 |
|
Stratospheric ozone depletion |
kg CFC11 eq |
5.75E-06 |
9.05E-07 |
5.66E-06 |
8.83E-07 |
5.58E-06 |
8.25E-07 |
|
Ionizing radiation |
kBq Co-60 eq |
7.58E-03 |
1.22E-02 |
7.67E-03 |
1.22E-02 |
7.12E-03 |
1.17E-02 |
|
Ozone formation, Human health |
kg NOx eq |
2.25E-03 |
1.59E-03 |
2.82E-03 |
2.18E-03 |
2.14E-03 |
1.50E-03 |
|
Fine particulate matter formation |
kg PM2.5 eq |
3.00E-03 |
1.53E-03 |
3.63E-03 |
2.18E-03 |
2.88E-03 |
1.44E-03 |
|
Ozone formation, Terrestrial ecosystems |
kg NOx eq |
2.34E-03 |
1.67E-03 |
2.90E-03 |
2.24E-03 |
2.21E-03 |
1.55E-03 |
|
Terrestrial acidification |
kg SO2 eq |
1.69E-02 |
2.80E-03 |
1.72E-02 |
3.28E-03 |
1.61E-02 |
2.29E-03 |
|
Freshwater eutrophication |
kg P eq |
1.18E-03 |
5.00E-04 |
1.40E-03 |
7.25E-04 |
1.19E-03 |
5.22E-04 |
|
Marine eutrophication |
kg N eq |
3.25E-04 |
3.36E-05 |
3.28E-04 |
4.13E-05 |
3.19E-04 |
3.30E-05 |
|
Terrestrial ecotoxicity |
kg 1,4-DCB |
1.49E+00 |
8.79E-01 |
1.69E+00 |
1.09E+00 |
1.47E+00 |
8.65E-01 |
|
Freshwater ecotoxicity |
kg 1,4-DCB |
2.24E-02 |
2.88E-02 |
2.90E-02 |
3.54E-02 |
2.21E-02 |
2.84E-02 |
|
Marine ecotoxicity |
kg 1,4-DCB |
3.02E-02 |
3.86E-02 |
3.94E-02 |
4.77E-02 |
2.98E-02 |
3.81E-02 |
|
Human carcinogenic toxicity |
kg 1,4-DCB |
1.36E-01 |
1.52E-01 |
1.77E-01 |
1.92E-01 |
1.32E-01 |
1.47E-01 |
|
Human non-carcinogenic toxicity |
kg 1,4-DCB |
7.96E-01 |
9.31E-01 |
1.15E+00 |
1.29E+00 |
8.18E-01 |
9.50E-01 |
|
Land use |
m2a crop eq |
6.67E-01 |
6.33E-02 |
6.60E-01 |
6.53E-02 |
6.53E-01 |
6.13E-02 |
|
Mineral resource scarcity |
kg Cu eq |
2.10E-03 |
1.77E-03 |
2.12E-03 |
1.79E-03 |
1.95E-03 |
1.62E-03 |
|
Fossil resource scarcity |
kg oil eq |
2.33E-01 |
2.75E-01 |
2.57E-01 |
2.99E-01 |
1.78E-01 |
2.20E-01 |
|
Water consumption |
m3 |
2.36E-02 |
2.88E-02 |
2.36E-02 |
2.88E-02 |
2.30E-02 |
2.81E-02 |
Note: LCIA = Life Cycle Impact Assessment; PSA = Pressure Swing Adsorption; PM = Press Mud; MT = Membrane Technique; AW = Amino Washing; NG = Napier Grass.
3.2.1 Global warming (kg CO₂ eq)
This is the most common impact category discussed in the alternative energy studies to analyse the benefits of reducing the causes of climate change. The characterised value ranges from 0.997 kg CO₂ eq./m³ biomethane (NG with AW purification) to 1.368 kg CO₂ eq./m³ biomethane (PM with MT purification), a 37% change across the minimum and maximum impacts. The impact of AW purification is the minimum in each feedstock, and the impact of MT is the maximum due to low leakage and high electricity consumption, respectively, for the purification pathways.
Global warming can be analysed in detail with the IPCC method. The quantified values are higher, 2.087 kg CO₂ eq/m³ biomethane (NG with AW purification) to 2.383 kg CO₂ eq/m³ biomethane (PM with MT purification) in comparison to the Recipe due to assumptions in the Recipe, cultural perspectives, and different emission factors. This method has fossil, biogenic, and CO₂ uptake estimates as distinct categories.
3.2.2 Stratospheric Ozone Depletion (kg CFC-11 eq)
The Stratospheric Ozone Depletion scores are very small across all pathways, ranging from 8.25 × 10⁻⁷ kg CFC-11 eq/m³ biomethane (PM with PSA) to 5.75 × 10⁻⁶ kg CFC-11 eq/m³ biomethane (NG with AW). Though the values are very low, the NG feedstock is 6.5 times more impactful than the PM feedstock. The main contributors are agricultural chemicals associated with cultivation, which involve halogenated compounds, followed by the Indian electricity grid. There is minimal difference within the purification technologies, suggesting that the impact is coming from the feedstock.
3.2.3 Ionising radiation (kBq Co-60 eq)
The normalisation of impact categories makes it the lowest impactful category, whose value ranges from 7.12 × 10⁻³ kBq Co-60 eq/m³ biomethane (NG with PSA) to 1.22 × 10⁻² kBq Co-60 eq/m³ biomethane (PM with MT). PM pathways are approximately 1.6 times more impactful than NG pathways because of the higher grid electricity consumption. The Indian electricity grid contains a nuclear power component, though small, whose uranium fuel cycle contributes to radiation emissions. The impact category is insignificant as the values are quite low and the variation is also very little among different pathways.
3.2.4 Ozone formation, human health (kg NOₓ eq)
The impact values of ozone formation (Human Health) were found to be in the range of 1.50 × 10⁻³ kg NOₓ eq/m³ biomethane (PM with PSA) to 2.82 × 10⁻³ kg NOₓ eq/m³ biomethane (NG with MT), with around 90% variation in the different pathways. The highest impact is coming from the MT purification due to the higher electricity consumption. The NG route is approximately 1.5 times more impactful than the PM route; the increase is due to the emissions in cultivation for the additional energy requirement. For a country like India, ground-level ozone is a serious concern due to the decreasing air quality.
3.2.5 Fine particulate matter formation (kg PM2.5 eq)
This is the most significant impact category for the given system in all 6 possible pathways. For PM with the AW method, 3/4th of the environmental burden is due to the particulate matter after normalisation. The absolute impact values range from 1.44 × 10⁻³ kg PM2.5 eq/m³ biomethane (PM with PSA) to 3.63 × 10⁻³ kg PM2.5 eq/m³ biomethane (NG with MT), a variation of 250% from the minimum impact pathways. The impact of the MT purification technique is the highest, and electricity is the main reason behind the higher emissions. The impact contribution of the AD stage of PM with AW and NG with AW is 45% and 55%, respectively, which is the largest contributor in the process emissions of PM2.5.
3.2.6 Ozone formation, terrestrial ecosystems (kg NOₓ eq)
Since the category is impacted by NOx emissions, such as human health and ozone formation, the impacts on the terrestrial ecosystem are also affected in similar patterns, and the contributing factors are also the same. The impact value ranges from 1.55 × 10⁻³ kg NOₓ eq/m³ biomethane (PM with PSA) to 2.90 × 10⁻³ kg NOₓ eq/m³ biomethane (NG with MT). The higher absolute values in the terrestrial ecosystem in comparison to human health are due to the terrestrial ecosystem exposure, which is considered for large geographic areas.
3.2.7 Terrestrial acidification (kg SO₂ eq)
In the impact category, there is high variability in the pathways, where NG pathways are 6 - 7 times higher than the corresponding PM pathways. The impact value ranges from 3.28 × 10⁻³ kg SO₂ eq/m³ biomethane (PM with MT) to 1.61 × 10⁻² kg SO₂ eq/m³ biomethane (NG with PSA). The higher impact is due to the NH₃ emissions during the grass cultivation, a dominant cause for acidification in the NG pathway. Since NG is an energy-intensive crop, it requires high nitrogen inputs for the unit agricultural land area. There is less variability within the purification technologies.
3.2.8 Eutrophication (kg P eq and kg N eq)
Freshwater and marine eutrophication impacts are due to phosphorus runoff, nitrogen emissions, and nitrate leaching. The main contributors to the eutrophication are the grid infrastructure and fuel supply chains. Similar to other impact categories, MT is the most impactful process. In marine eutrophication, the impact score of NG pathways is approximately 10 times higher than that of PM pathways. Purification has minimal impact on marine eutrophication within each feedstock group.
3.2.9 Human toxicity (kg 1,4-DCB)
In the human toxicity impact category, MT is showing the highest impact due to its high electricity demand from the coal-based Indian grid. Coal-fired power plants generate fly ash and flue gas, which include arsenic, chromium, mercury, and cadmium, and contribute to human toxicity. Also, the purification technique uses activated carbon and chromium steel; however, in small amount adds to the toxicity as their supply chains include coal-based carbon activation and extraction of chromium. As PM involves water treatment as well as industrial chemicals as inputs, the impact of NG is lower than PM in all purification techniques. The impact score of PSA and AW was found to be nearly matching in this category. PSA is performing better in carcinogenic toxicity as chemicals are used than AW, and no silicone products are used. For non-carcinogenic toxicity, AW is performing better than PSA due to lower overall material use in AW.
3.2.10 Water toxicity (kg 1,4-DCB)
The combination of PSA with NG is the best-performing scenario for freshwater as well as marine ecotoxicity, and the combination of MT with PM is the highest-impact-creating combination, and it is 60% more impactful than PSA with NG. The AD of PM is 45% more impactful than the AD of NG. The digester sludge handling and decarbonised water usage in the processing of PM are contributing to the high impact of PM. Though NG is an agricultural crop, it does not need to be farmed afresh every time after its harvest. In the case of PM, it is considered an industrial waste, and even though the agricultural impacts are not considered for sugarcane, the industrial processes are impactful on water toxicity.
3.2.11 Land use (m² a crop eq)
The obvious result in the land use environmental impact category is realised as NG is ten times more impactful than PM due to the land requirement for the cultivation of the energy crop. Since PM is an industrial waste feedstock, it doesn’t require additional land, as the land use is allocated to sugar production, and the PM is cut off after the sugarcane juice clarification. The maximum impact is coming from the feedstock, and purification technologies have minimal impacts. A variation of 2-3% is realised among purification technologies. The normalised impact value for PM makes it one of the least significant impact categories; however, the availability of land in a country like India (massive population) is already a challenge, and the impact increases the competition between food and fuel.
3.2.12 Mineral resource scarcity (kg Cu eq)
The impact value for mineral resource scarcity ranges from 1.62 × 10⁻³ kg Cu eq/m³ biomethane (PM with PSA) to 2.12 × 10⁻³ kg Cu eq/m³ biomethane (NG with MT). It is the 2nd most impactful category considering the normalisation value. However, the impact is mainly contributed to by the metals coming from the embodied electricity in the grid infrastructure, a common background process in all the pathways.
3.2.13 Fossil resource scarcity (kg oil eq)
The impact value in the category ranges from 0.178 kg oil eq/m³ biomethane (NG with PSA) to 0.299 kg oil eq/m³ biomethane (PM with MT). In the purification techniques, MT consistently performs poorly in both feedstocks, with a 36% higher impact than PSA for PM. Though the AW has a high thermal energy requirement for MEA regeneration, its impact value lies between PSA and MT because the thermal energy source is natural gas, instead of coal. The normalisation value (348–584 µPE·yr) of the impact category makes it rank 7th among the 18 impact categories.
3.2.14 Water consumption (m³)
The water consumption ranges from 2.30 × 10⁻² m³/m³ biomethane (NG with PSA) to 2.88 × 10⁻² m³/m³ biomethane (PM with AW), with PM consuming more water than NG. Though the difference is not so high, the reason is due to the requirement of decarbonised water for the dilution of the feedstock. The normalised score makes the impact category one of the least significant categories. This can be important for water-stressed regions of India, especially in Karnataka and Maharashtra.
3.3 Normalization impact score
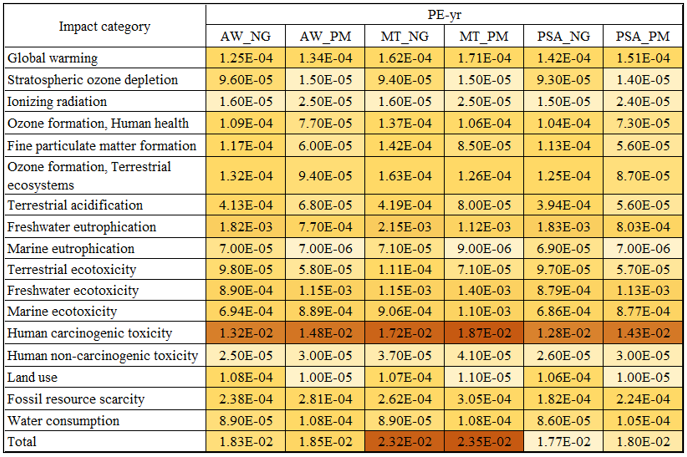
Normalization of various impact categories in terms of PE-yr is presented in Figure 9. PE-yr is the unit for converting the LCIA results of midpoint impact categories into a single comparable scale, i.e., person-equivalent year. Though an additional uncertainty is added with this step, it helps in understanding the impacts in a simplified manner. For every impact category, the average impact of a person over one year is the reference value, and the LCIA results are compared with this reference value.
From Figure 9, it can be seen that Human carcinogenic toxicity has the highest impact among the six routes of biomethane manufacturing. The heat map in Figure 9 reveals that the feedstock choice is the more important determinant compared to the purification technique for most of the impact categories, considering NG and PM feedstock. Processes involved with NG feedstock carry higher environmental burdens in land use, terrestrial acidification, ozone depletion, marine eutrophication, and particulate matter formation due to the agricultural and associated field emissions, whereas processes involved with PM feedstock shift the impact towards water consumption, human toxicity, and ionizing radiation, as there are more chances of residual and chemical loads from the sugar industry. In the global warming impact category, the impacts are similar; however, PM feedstocks are creating more burden than NG feedstocks. Among purification techniques, MT with PM feedstock is showing the highest environmental load, whereas AW with NG offers the most environmentally friendly results among the available routes in the global warming impact category. For the human carcinogenic impact category, the MT with PM is the most impactful route, and the PSA with NG is the least impactful route, slightly higher than the AW with NG. The normalisation ranks MT with PM (0.023455 PE-yr) as the least preferred and PSA with NG as the most preferred route (0.017733 PE-yr).
3.4 Hotspot analysis for global warming
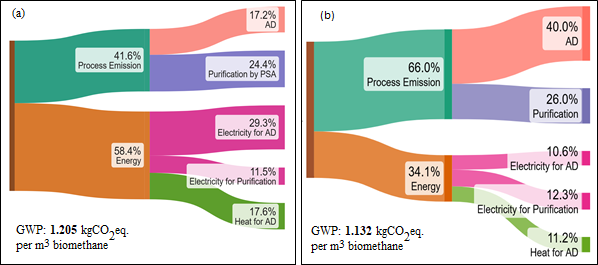
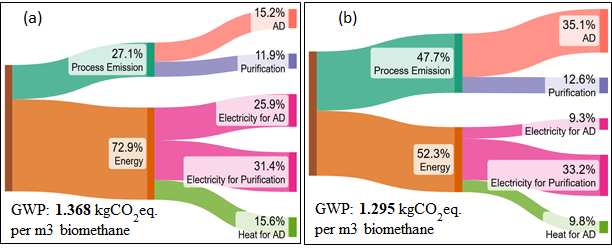
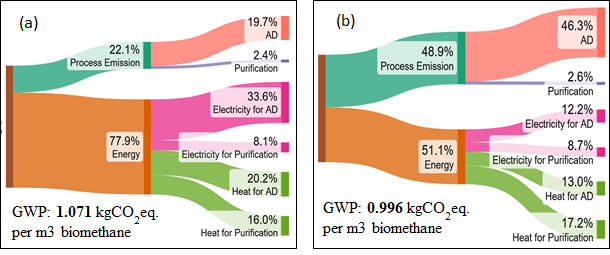
The total global warming impact of each CBG production pathway is presented in Sankey diagrams. As per the screening LCA findings, it is divided into two main categories: process emissions and energy-related emissions. Process emissions are further categorised into AD & purification. Energy-related emissions are categorised into heat and electricity, with AD & purification. The impact values are represented as a percentage of the total impact value of the specific pathway. As discussed in the LCIA section, the total GWP impact value comes out in the range of 0.997 kg CO₂ eq/m³ biomethane (NG with AW, lowest) to 1.368 kg CO₂ eq/m³ biomethane (PM with MT, highest) across the six different pathways. The Sankey diagrams for 6 different pathways are shown in Figures 10, 11, and 12.
3.4.1 Pressure Swing Adsorption purification technology
In the PSA purification technique for PM, process emissions are lower than energy-related emissions. The energy-related emissions contributed 58.4% of total GWP, whereas process emissions accounted for 41.6%. But in the case of NG, process emissions are dominated by energy-related emissions. For NG feedstock, the process emissions are double those of the emissions coming from energy sources (Figure 10). The process emissions are 66% for NG in comparison to 42% for PM. The total GWP value for PM with PSA is 1.205 kg CO₂ eq/m³ biomethane, out of which the maximum share goes to the electricity consumption in the digestion. PM feedstock is energy-intensive for the AD process, while NG feedstock requires less energy in the digestion, but the process of cultivation is making the process emissions higher. After AD, purification is the major contributor to the overall impact for both feedstocks. This is due to the highest leakage of CH₄ in this purification technique (1.25%).
Figure 10. Sankey diagram for the Pressure Swing Adsorption (PSA) purification technique for (a) Press Mud (PM) and (b) Napier Grass (NG)
3.4.2 Membrane Technique purification technology
The MT purification technique has lower process emissions than the emissions due to energy sources, as can be seen in Figure 11, wherein the process emissions have been reduced significantly for PM feedstock. For NG, the high process emission is due to the AD, where grass cultivation is the major contributor. The biogenic CH₄ leakage is lower (0.64%) in this purification technique; therefore, the share of the purification process emission is around 12% of the total impact. The dominant contributor is electricity in the purification, as this is an energy-intensive process. High-pressure compression of the raw biogas is required, which uses a high amount of electricity. Since NG feedstock is slightly more efficient than PM, the same amount of NG feedstock can produce more biogas. Therefore, the highest GWP impact, among 6 pathways, was for the PM feedstock with the MT purification technique (1.368 kg CO₂ eq/m³ biomethane).
Figure 11. Sankey diagram for the Membrane Technique (MT) purification technique for (a) Press Mud (PM) and (b) Napier Grass (NG)
3.4.3 Amino Washing purification technology
Figure 12 represents the AW purification technique using the PM and NG feedstocks, where process emission is reduced to a minimum for the purification process, as biogenic CH₄ leakage is the least for AW (0.06%). The major contributor to AW purification technology is AD (electricity consumption in PM and process emission in NG feedstock). The impact is followed by heating with natural gas and electricity. In this purification process, heat consumption is increased as thermal energy is required for MEA regeneration, which is absent in the PSA and MT purification techniques. NG feedstock with AW purification gives the minimum GWP value of 0.997 kg CO₂ eq/m³ biomethane out of all 6 pathways.
Figure 12. Sankey diagram for the Amino Washing (AW) purification technique for (a) Press Mud (PM) and (b) Napier Grass (NG)
The three uniform observations were evident from the hotspot study. The first one is related to the process emissions from the AD stage, which are feedstock-dependent and is not dependent on the purification technique. Therefore, the improvement in digester efficiency, pre-treatment of feedstocks, and leakage control, if any, will uniformly bring emission benefits for all cases. The second observation is related to electricity consumption in purification, where the consumption varies from 8% to 33% across the different pathways. As the Indian grid is currently coal-intensive, decarbonisation of the grid will improve emissions, especially for MT pathways. The third observation is the heat requirement in AW for MEA regeneration. The replacement of natural gas with the generated biogas will lead to further reduction in the emissions of AW purification.
3.5 Sensitivity analysis
The critical processes/parameters, as far as GHG emissions represented as GWP in kg CO₂ eq are concerned, for the CBG manufacturing were identified as electricity, heat, AD, and purification technologies. Within the purification technologies, electricity and heat play an important role. CH₄ leakage in the purification technique is also identified as a hotspot. Therefore, a one-factor sensitivity analysis is performed for CH₄ leakage, electricity, and heat. Since the biogas generation potential of feedstock is an important parameter, it was also taken into consideration for sensitivity analysis.
3.5.1 CH₄ leakage in the purification technique
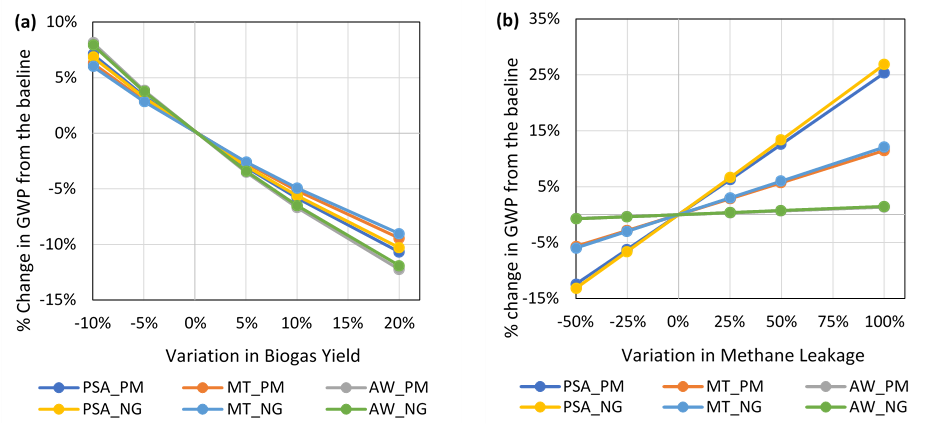
As per the Ecoinvent database version 3.11, the CH₄ leakage values for PSA, MT, and AW are 1.25%, 0.64%, and 0.06%, respectively [38]. The GWP results from these leakage values are set to be the baseline values in all six cases, three each for two feedstocks, PM and NG. The percentage variation in the CH₄ leakage, with respect to base values for the respective purification techniques, is considered to be from -50% to 100%, since the variation can be large for CH₄ emissions. Variation in GWP with the change in percentage variation in CH₄ leakage values is shown in Table 2. There is a linear relationship between the GWP variation and CH₄ leakage variation, shown in Figure 13(a). The slope of the straight-line equations shows the sensitivity of the CH₄ leakage.
Figure 13. Variation of Global Warming Potential (GWP) with change in (a) CH₄ leakage and (b) biogas yield from the baseline
Table 2. Percentage variation in GWP with the CH₄ leakage variation from the baseline, with the slope of the line equation for all purification techniques
|
Methane Leakage Variation from Baseline (%) |
GWP Variation from the Baseline GWP (%) |
|||||
|
PSA_PM |
MT_PM |
AW_PM |
PSA_NG |
MT_NG |
AW_NG |
|
|
-50% |
-6.8% |
-3.2% |
-0.3% |
-6.9% |
-3.3% |
-0.3% |
|
-25% |
-3.4% |
-1.6% |
-0.2% |
-3.5% |
-1.6% |
-0.2% |
|
25% |
3.4% |
1.6% |
0.2% |
3.5% |
1.7% |
0.2% |
|
50% |
6.9% |
3.3% |
0.3% |
7.0% |
3.3% |
0.4% |
|
100% |
13.9% |
6.6% |
0.7% |
14.1% |
6.6% |
0.7% |
|
Slope of the line equation |
0.1382 |
0.0654 |
0.0069 |
0.1399 |
0.0661 |
0.0070 |
Note: GWP = Global Warming Potential; PSA = Pressure Swing Adsorption; PM = Press Mud; MT = Membrane Technique; AW = Amino Washing; NG = Napier Grass.
It is found that the PSA systems are about 20 times more sensitive to leakages than the AW systems. If the CH₄ leakage in a PSA system is doubled, it increases GWP from the baseline by 14% (13.9% for PM and 14.1% for NG). It was observed that for AW, as the baseline leakage was just 0.06%, even a 100% change in the variation of the baseline exhibits just 1% of the variation in GWP from its baseline GWP emissions. The near-zero leakage in AW systems (0.06% baseline) also means that even larger deviations (+100%) from the baseline will have minimal absolute impact. For MT systems, leakage sensitivity is intermediate between PSA and AW, but it is still about 10 times that of AW.
The GWP emissions vary in the range from -7% to 14%, with the change in the leakage variation from the baseline considering the reference value for the European countries. There are some studies where rates of around 7- 8% are reported [39]. In such cases of high leakage, the GWP emissions will increase manifold. Any increase in uncontrolled CH₄ releases, due to equipment wear, operational pressure deviations, or inadequate monitoring, can diminish the climate benefit of biomethane relative to non-renewable sources of energy like natural gas. Therefore, it is important to monitor and control the leakages.
3.5.2 Biogas yield
Variation in the feedstock quality in real life is observed. The quality of the feedstock is judged in terms of its biogas yield. A lower biogas yield means that a larger volume of raw feedstock must be processed to deliver the same amount of biogas, increasing the associated burden of digestion energy, chemicals, and upstream feedstock handling. Conversely, a higher yield reduces the burdens for generating the same amount of biogas, resulting in less GWP. The sensitivity analysis is performed with all six cases by varying the biogas yield from its baseline value by -10% to 20%, as it depends on the feedstock quality and process parameters, which limits the variation in the yield. Similar trends are observed in all six cases. A 10% reduction in biogas yield resulted in an increase in GWP in the range of 3.67 - 4.33% across all six systems, with AW_PM showing the highest sensitivity (+4.33%) and MT_NG the lowest (+3.67%). At a 20% increase in biogas yield, GWP is reduced by 5.51–6.49% (AW_PM most sensitive and MT_NG the least) (Figure 13(b)).
Although AW systems show higher absolute percentage variations, they have slightly lower sensitivity coefficients than MT systems due to higher baseline GWP attributable to their heat demand. Biogas yield is the single most influential parameter in this LCA. A 10% improvement in feedstock quality or digestion efficiency reduces GWP by ~4% across all technologies, which is far larger than what can be achieved by comparable reductions in other parameters. The analysis supports the statement that optimisation of AD, feedstock pre-treatment, and co-digestion strategies are high-potential intervention techniques to bring the GWP improvements.
3.5.3 Heat and electricity as energy sources in digestion and purification
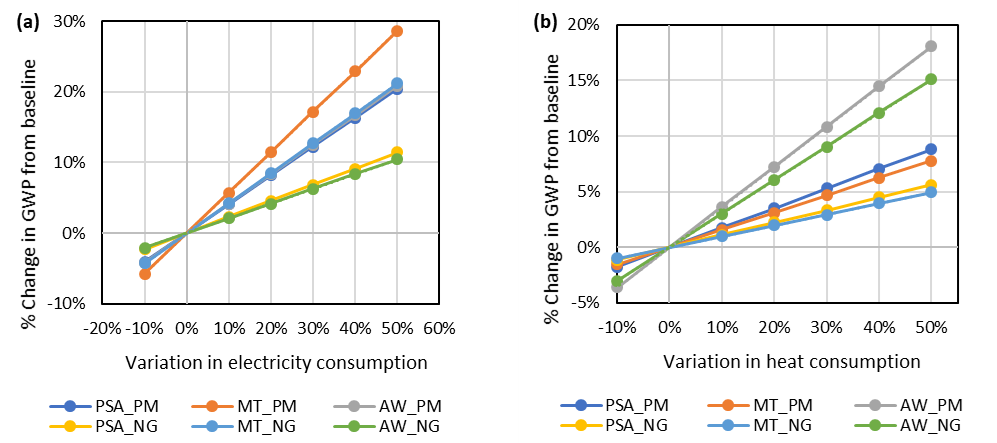
Electricity consumption (in kWh/m³) for both the digestion and purification stages was varied from −10% to +50% of baseline, as the electricity and heat consumption depend on the plant design and operational efficiency. It is to be noted that different technologies have markedly different baseline electricity demands. MT_PM purification uses 0.5745 kWh/m³ (the highest) while AW_PM purification uses only 0.116 kWh/m³. For Heat, the input (in MJ/m³) was varied from −10% to +50% of baseline. Heat is required only in the digestion stage (baseline ~3.1 MJ for PM and ~1.857 MJ for NG) for PSA and MT systems, and no heat is required for the purification of biogas. However, for AW systems, an additional heat stream is required for solvent regeneration in the purification stage (baseline of 3.852 MJ).
At a 50% increase in electricity, GWP rises in the range 5% - 16% for different systems (Figure14 (a)). MT_PM reaches a 16.43% GWP increase because its purification step is electricity-intensive. At a 50% heat increase, GWP rises in the range of 3% - 10% (Figure 14(b)). AW_PM shows higher sensitivity (+10.50%), while MT_NG exhibits lower sensitivity (+2.69%).
Figure 14. Variation of Global Warming Potential (GWP) with change in (a) electricity consumption and (b) heat consumption from the baseline
MT systems are the most electricity-sensitive. PSA systems occupy an intermediate position. AW systems, though heat-intensive, are relatively insensitive to electricity fluctuations due to their lower electricity demand in the purification stage. The electricity sensitivity of MT technology makes it highly dependent on the carbon intensity of the grid. In a renewable electricity scenario, MT systems may become competitive.
Heat in digestion supports mesophilic or thermophilic AD. In AW purification, steam or hot water regenerates the amine solvent - this is a well-known large energy cost of chemical absorption. This dual heat demand makes AW systems intrinsically more sensitive to heat variation than PSA or MT systems. PSA and MT systems, which use heat only for digestion, are relatively insensitive - a 50% heat increase causes a change in the range of 2.69% - 4.73% GWP.
Electricity is the critical parameter for MT technology and remains important for all systems. Heat is the critical parameter for AW technology. CH₄ leakage is the critical parameter for PSA technology at a larger scale, which means that if leakage management degrades over time, PSA systems will contribute the most to climate change via GWP. From a system selection standpoint, AW systems offer climate stability under heat and leakage variation, but are vulnerable to electricity supply quality. PSA systems are robust to heat changes but highly vulnerable to CH₄ slip. MT systems fall in between but carry significant electricity dependency. Feedstock quality and digestion optimisation are the most promising options available to biogas manufacturers.
Electricity matters most for MT systems (especially MT_PM, +16% GWP at +50% electricity) due to their high compression energy demand for purification. AW systems are largely insensitive to electricity changes. With the grid decarbonisation, the MT system will improve its GWP. Heat is the defining vulnerability of AW systems. AW_PM can see over 10% GWP increase at 50% more heat, driven by the amine solvent regeneration step. PSA and MT systems respond only modestly to heat changes because they use heat only in digestion.
The LCA study is performed with the two feedstocks, i.e., PM and NG. There are other categories of feedstocks available in India, which can be studied. Also, some combinations of feedstocks performed better in biogas generation. These combinations of feedstock may also be analysed from a life cycle perspective. Due to the limitation of primary data from the manufacturers, the pre-treatment of the feedstock is not included in the LCI of the study. Since there is energy involved in the pre-treatment, the type of feedstocks will have an impact on it [40, 41]. This process can be included in future studies. The CH₄ leakages are not measured at the manufacturer’s site, as there are no regulations as of now, and it incurs an extra cost for them. Hence, leakage values are taken from the secondary sources in the current study. However, the CH₄ slip has a considerable amount of impact, though being biogenic in nature. Future studies can be done for the specific plant, where the CH₄ leakages can be measured, and plant-level leakage can be considered. In addition, life cycle analysis of the use phase of the CBG in vehicles will help in the assessment of the overall benefits of using CBG, an alternate form of natural gas. The tailpipe emissions will be biogenic for the biomass feedstocks. The analysis of biogenic uptake and tailpipe emissions can be done for the overall impacts via a cradle-to-grave study in the future.
This study quantifies the environmental impacts of biomethane manufacturing using two of the major feedstocks, PM (sugarcane industry by-product) and NG (energy crop), following an overall life cycle analysis approach for the production of biomethane to be used in automobiles as an alternative to CNG. The cradle-to-gate LCA study evaluated six different routes, three distinct purification techniques for each feedstock, for their environmental impacts on 18 midpoint categories using the Recipe Midpoint method. LCIA results showed that MT is the highest impact scorer in the majority of the impact categories. For the midpoint category of global warming, the value of GWP comes out in the range of 0.997 kg CO₂ eq to 1.368 kg CO₂ eq for 1 m3 of biomethane generation. The normalisation of the impact values ranks the MT with the PM route as the least preferred, with the score of 0.023 PE-yr, and PSA with the NG as the most preferred, with the score of 0.017 PE-yr.
In the hotspot analysis, the process and energy-related emissions with GWP values were analyzed. The energy-related emissions are the major contributor to GWP for PM feedstock, with a share of 58%, 73%, and 79% for PSA, MT, and AW, respectively. Whereas, with NG as feedstock, the corresponding share of energy-related emissions was 34%, 52%, and 51% for PSA, MT, and AW, respectively. The rest is attributed to the leakage of CH₄ and other processes. In the case of NG feedstock, the process emission was found to be lower as the agricultural impacts are considered in the AD process emissions. The sensitivity analysis for energy (electricity, natural gas), CH₄ leakage in purification, and biogas yield (quality of feedstock), keeping the other parameter constant, revealed that MT is highly sensitive to electricity, and AW is for the heat due to the consumption of natural gas in the purification technique. This implies that there is a potential for improvement in the overall environmental score of the MT system with grid decarbonisation. For CH₄ leakage, the most sensitive case is with the PSA purification technique due to the high amount of leakage in comparison to MT and AW. The manufacturers with PSA purification systems should focus on controlling the leakage to reduce the environmental impact of the overall process. In the feedstock quality, all six routes are showing similar behavior, and the improvement in the feedstock quality will bring out positive results in all cases.
The detailed life cycle analysis of Biomethane production for the combination of two feedstocks and three purification techniques provided vital information on the sources of emissions, sensitivity of input data, and also suggested critical areas for improvement in the GWP performance.
[1] Mukherjee, S., Bairwa, D.H. (2025). Environmental issues arising from urbanization: A study on the ecological consequences of rapid urban growth. Journal of Humanities and Education Development, 7(3): 12-17. https://doi.org/10.22161/JHED.7.3.3
[2] Soeder, D.J. (2025). Replacing fossil fuels. In Energy Futures: The Story of Fossil Fuel, Greenhouse Gas, and Climate Change, Cham: Springer Nature Switzerland, pp. 143-183. https://doi.org/10.1007/978-3-031-83603-9_6
[3] Yadav, K., Sircar, A. (2022). Fundamentals and developments of compressed biogas in city gas distribution network in India: A review. Petroleum Research, 7(3): 409-418. https://doi.org/10.1016/j.ptlrs.2021.12.003
[4] Jameel, M.K., Mustafa, M.A., Ahmed, H.S., et al. (2024). Biogas: Production, properties, applications, economic and challenges: A review. Results in Chemistry, 7: 101549. https://doi.org/10.1016/j.rechem.2024.101549
[5] Humphrey, I., Obot, N.I., Humphrey, O.F., Afuwape, N.F. (2025). Temperature and pH optimization in mesophilic anaerobic digestion for enhanced biogas production. Biofuels, 16(6): 592-603. https://doi.org/10.1080/17597269.2024.2447159
[6] Leite, A.F., Janke, L., Harms, H., et al. (2015). Assessment of the variations in characteristics and CH₄ potential of major waste products from the Brazilian bioethanol industry along an operating season. Energy and Fuels, 29(7): 4022-4029. https://doi.org/10.1021/ef502807s
[7] Zainudeen, M.N., Kwarteng, M., Nyamful, A., Mohammed, L., Mutala, M. (2021). Effect of temperature and pH variation on anaerobic digestion for biogas production. Ghana Journal of Agricultural Science, 56(2): 1-13. https://doi.org/10.4314/gjas.v56i2.1
[8] Tang, J., Yin, J., Davy, A.J., et al. (2022). Biogas slurry as an alternative to chemical fertilizer: Changes in soil properties and microbial communities of fluvo-aquic soil in the North China Plain. Sustainability, 14(22): 15099. https://doi.org/10.3390/su142215099
[9] Sihlangu, E., Luseba, D., Regnier, T., Magama, P., Chiyanzu, I., Nephawe, K.A. (2024). Investigating methane, carbon dioxide, ammonia, and hydrogen sulphide content in agricultural waste during biogas production. Sustainability, 16(12): 5145. https://doi.org/10.3390/su16125145
[10] Santoni, F., Gislon, P., Rozzi, E., et al. (2024). Hydrogen sulphide and carbonyl sulphide removal from biogas for exploitation in high-temperature fuel cells. Waste and Biomass Valorization, 15(2): 577-597. https://doi.org/10.1007/s12649-023-02212-6
[11] Abd, A., Othman, M., Naji, S., Hashim, A. (2021). CH₄ enrichment in biogas mixture using pressure swing adsorption: Process fundamental and design parameters. Materials Today Sustainability, 11: 100063. https://doi.org/10.1016/j.mtsust.2021.100063
[12] Cavaignac, R.S., Ferreira, N.L., Guardani, R. (2021). Techno-economic and environmental process evaluation of biogas upgrading via amine scrubbing. Renewable Energy, 171: 868-880. https://doi.org/10.1016/j.renene.2021.02.097
[13] Noorain, R., Kindaichi, T., Ozaki, N., Aoi, Y., Ohashi, A. (2019). Biogas purification performance of new water scrubber packed with sponge carriers. Journal of Cleaner Production, 214: 103-111. https://doi.org/10.1016/j.jclepro.2018.12.209
[14] Ahmad, J., Nasir, R., Faheem, M., Alsaady, M., Maqsood, K., Ngamcharussrivichai, C. (2026). Biogas upgrading technologies with emphasis on membrane separation performance. Biomass and Bioenergy, 210: 109078. https://doi.org/10.1016/j.biombioe.2026.109078
[15] UN Climate Technology Center and Network. (2026). Biomethane CNG hybrid fuel. https://www.ctc-n.org/technologies/biomethane-cng-hybrid-fuel.
[16] Jain, R. (2022). Greening India's energy mix with compressed biogas (CBG). Centre for Science and Environment. https://www.cseindia.org/greening-india-s-energy-mix-with-compressed-biogas-cbg—11705.
[17] Osman, A.I., Mehta, N., Elgarahy, A.M., et al. (2021). Conversion of biomass to biofuels and life cycle assessment: A review. Environmental Chemistry Letters, 19(6): 4075-4118. https://doi.org/10.1007/s10311-021-01273-0
[18] Ferraris, R. (1980). Effect of harvest interval, nitrogen rates and application times on Pennisetum purpureum grown as an agroindustrial crop. Field Crops Research, 3: 109-120. https://doi.org/10.1016/0378-4290(80)90016-7
[19] García, S.C., Islam, M.R., Clark, C.E.F., Martin, P.M. (2014). Kikuyu-based pasture for dairy production: A review. Crop and Pasture Science, 65(8): 787-797. https://doi.org/10.1071/cp13414
[20] Zhang, X., Gu, H., Ding, C., Zhong, X., Zhang, J., Xu, N. (2010). Path coefficient and cluster analyses of yield and morphological traits in Pennisetum purpureum. Tropical Grasslands, 44: 95-102.
[21] Goorahoo, D., Cassel, F.S., Adhikari, D., Rothberg, M. (2005). Update on elephant grass research and its potential as a forage crop. In California Alfalfa and Forage Symposium, UC Cooperative Extension Agronomy Research and Extension Center, Plant Sciences Department, University of California, Davis CA.
[22] Kasulla, S., Malik, S.J., Yadav, A., Kathpal, G. (2022). Potential of biogas generation from hybrid Napier Grass. International Journal of Trend in Scientific Research and Development, 6(2): 277-281. https://doi.org/10.33564/IJEAST.2020.v05i07.030
[23] Yadav, N., Kaur, G., Jha, M.K., Kumar, S. (2025). Biogas production from different agricultural residues via thermophilic anaerobic digestion. AIJR Abstracts, 29. https://books.aijr.org/index.php/press/catalog/book/177/chapter/3484.
[24] Singh, R., Hans, M., Kumar, S., Yadav, Y.K. (2023). Thermophilic anaerobic digestion: An advancement towards enhanced biogas production from lignocellulosic biomass. Sustainability, 15(3): 1859. https://doi.org/10.3390/su15031859
[25] Garnaik, P.P., Pradhan, R.R., Chiang, Y.W., Dutta, A. (2021). Biomass-based CO2 adsorbents for biogas upgradation with pressure swing adsorption. In Climate Change and Green Chemistry of CO2 Sequestration, Singapore: Springer Singapore, pp. 231-262. https://doi.org/10.1007/978-981-16-0029-6_14
[26] Buivydas, E., Navickas, K., Venslauskas, K. (2024). A life cycle assessment of CH₄ slip in biogas upgrading based on permeable membrane technology with variable CH₄ concentration in raw biogas. Sustainability, 16(8): 3323. https://doi.org/10.3390/su16083323
[27] Atelge, M.R., Senol, H., Djaafri, M., et al. (2021). A critical overview of the state-of-the-art methods for biogas purification and utilization processes. Sustainability, 13(20): 11515. https://doi.org/10.3390/su132011515
[28] Vo, T.T., Wall, D.M., Ring, D., Rajendran, K., Murphy, J.D. (2018). Techno-economic analysis of biogas upgrading via amine scrubber, carbon capture and ex-situ methanation. Applied Energy, 212: 1191-1202. https://doi.org/10.1016/j.apenergy.2017.12.099
[29] Bureau of Indian Standards. (2025). IS 16087:2025 - Biogas (Biomethane) - Specification (Second Revision). Indian Standard, 16087. www.standardsbis.in.
[30] MoRTH, Govt. of India. (2015). G.S.R. 498 (E) Central Motor Vehicles (tenth amendment) rules. The Gazette of India. https://archive.org/details/in.gazette.central.e.2015-06-16.164547.
[31] ISO. (2006). ISO 14044:2006 - Environmental management - Life cycle assessment - Requirements and guidelines. https://www.iso.org/standard/38498.html.
[32] ISO. (2006). ISO 14040:2006 - Environmental management - Life cycle assessment - Principles and framework. https://www.iso.org/standard/37456.html.
[33] Wolf, M.A., Chomkhamsri, K., Brandao, M., et al. (2010). International reference life cycle data system (ILCD) handbook-general guide for life cycle assessment-detailed guidance. European Commission. https://doi.org/10.2788/38479
[34] Godara, R., Vijay, V., Datta, A., Jha, M.K., Gakkhar, N. (2026). Conceptual techno-economic analysis of a biomethane plant including environmental impacts: Impact of temperature phases and total solid content. Industrial Biotechnology, 22(3): 256-270. https://doi.org/10.1177/15509087251400602
[35] Hafner, S.D., Bisogni Jr, J.J. (2009). Modeling of ammonia speciation in anaerobic digesters. Water Research, 43(17): 4105-4114. https://doi.org/10.1016/j.watres.2009.05.044
[36] Jungbluth, N., Frischknecht, R. (2007). Life cycle inventories of bioenergy: Data v2.0. Switzerland. https://esu-services.ch/fileadmin/download/jungbluth-2007-17_Bioenergy.pdf.
[37] Stucki, M., Jungbluth, N. (2011). Life cycle assessment of biogas production from different substrates. ESU-services Ltd., Uster, Switzerland. https://esu-services.ch/fileadmin/download/stucki-2011-LCA_Biogas_v1.0.pdf.
[38] Kägi, T., Zschokke, M., Dinkel, F., AG, C. (2021). Life cycle inventories for biogas and biomethane processes. On behalf of FOEN. https://carbotech.ch/cms/wp-content/uploads/Technical_Report_Biogas.pdf.
[39] Vilardi, G., Bassano, C., Deiana, P., Verdone, N. (2020). Exergy and energy analysis of biogas upgrading by pressure swing adsorption: Dynamic analysis of the process. Energy Conversion and Management, 226: 113482. https://doi.org/10.1016/j.enconman.2020.113482
[40] Wang, M., Wang, J., Li, Y., et al. (2022). Low-temperature pretreatment of biomass for enhancing biogas production: A review. Fermentation, 8(10): 562. https://doi.org/10.3390/fermentation8100562
[41] Kasinath, A., Fudala-Ksiazek, S., Szopinska, M., et al. (2021). Biomass in biogas production: Pretreatment and codigestion. Renewable and Sustainable Energy Reviews, 150: 111509. https://doi.org/10.1016/j.rser.2021.111509