Oussama Adissa* | Abdelmoumène Hakim Benmachiche | Ali Boukhari | Zouhair Aouissi
© 2026 The authors. This article is published by IIETA and is licensed under the CC BY 4.0 license (http://creativecommons.org/licenses/by/4.0/).
OPEN ACCESS
An experimental and numerical investigation was undertaken on a solar collector channel integrated with rectangular winglet vortex generators (RWVGs) to examine how their positioning along the transverse direction of the channel influences the thermal-hydraulic performance factor (THPF) of a solar air collector (SAC). A three-dimensional (3D) computational fluid dynamics (CFD) analysis was performed using ANSYS Fluent, subsequent to model validation through experimental trials. Three configurations were analysed: (A) RWVGs affixed to the bottom wall, (B) RWVGs embedded at mid-channel, and (C) RWVGs mounted beneath the absorber plate, each benchmarked against an empty channel as reference. The study encompassed Reynolds numbers ranging from 528 to 1744 (based on the channel hydraulic diameter), with the angle of attack fixed at 30° and the inclination angle at 90°. The Nusselt number, friction factor, pressure drop, and THPF were systematically examined and discussed. The findings revealed that Cases A and C exhibited analogous trends in pressure drop and friction coefficient owing to their geometric similarity. Nevertheless, Case C consistently emerged as the most favourable configuration, despite Case B recording the highest Nusselt number at Re = 1744. This outcome underscores that the proximity of vortex generators (VGs) to the laminar sublayer does not inherently ensure superior heat transfer. The study thereby establishes VG placement as a critical design parameter in optimizing solar air channels under laminar flow conditions. Among the examined designs, RWVGs mounted beneath the absorber plate delivered the most advantageous performance, while it is anticipated that under turbulent regimes, and in exchangers with both bottom and top heated walls, the central configuration may ultimately prove more efficacious.
rectangular winglet, solar air collector, thermal-hydraulic performance, Nusselt number, friction factor
Renewable energy has become one of the most vital pillars for ensuring a better quality of life, as societies increasingly invest in its development and in research that enables its optimal utilization. Among the various renewable sources, solar energy stands out as one of the cleanest and most sustainable, primarily due to its wide availability, vast reserves, and the pressing need to mitigate the depletion of conventional energy resources.
One of the most prominent and straightforward ways to utilize solar thermal energy is to heat a fluid using a solar air collector (SAC), which converts solar radiation into thermal energy in a working fluid such as air. This thermal energy can then be applied in numerous fields, including heating, drying, and dehumidification systems [1-5]. SACs are generally classified into three main types [6]: flat-plate solar air collector (FPSAC), evacuated-tube solar air collector (EVTSAC), and concentrated SAC. Regardless of their type, the main objective in optimizing SACs is to enhance heat transfer performance, aiming to achieve a higher thermal-hydraulic performance factor (THPF). Methods for improvement can generally be classified as passive, active, and dynamic methods [7]. Passive methods are often preferred due to their simplicity, ease of fabrication, and low installation cost. These include treated surfaces [8-10] and vortex generators (VGs) in various forms and geometrical shapes [11], such as fins [12], ribs [13], baffles [14-16], wings [17], and winglets [18, 19].
To understand the effectiveness of these passive enhancements, numerous studies have examined specific designs and configurations of VGs and absorber surfaces. A review of the literature shows that researchers have primarily focused on VG design variables, which include angle of attack, roll angle, shape factor, and position. Some studies have relied on treated surfaces to improve the absorber plate. Li et al. [9] conducted an experimental study on different absorber surfaces in SACs-including sinusoidal corrugated plates, protrusion plates, and flat plates-under the same radiation and time conditions. Comparisons showed that heat transfer properties such as the heat transfer coefficient, pressure drop, and performance factor change significantly with the shape of the absorber plate surface. Similarly, Fan et al. [8] presented a new design of a V-shaped corrugated solar absorber applied in FPSACs. Their results demonstrated tangible and highly satisfactory improvements compared with conventional SACs, reflecting the importance of improving absorber plate design in overall performance.
Beyond absorber surface modifications, other research has focused on improving thermal efficiency through the use of baffles and fins in various positions and configurations. Daliran and Ajabshirchi [20] and Ammar et al. [21] studied the efficiency of FPSACs equipped with rectangular fins placed over the backboard of the air channel. Building on these findings, Mohammadi and Sabzpooshani [22] analysed several performance factors for single-pass SACs with baffles placed above the absorber plate, increasing the number of tabulators at different mass flow rates to achieve higher performance. Chabane et al. [23] conducted an experimental study on a new single SAC with fins attached under the absorber plate, comparing configurations with and without fins for two different mass flow rates. Aouissi and Chabane [14] performed an experimental and numerical study of rectangular baffles situated in the middle of the SAC duct, focusing on the number of baffles and the new placement for SAC optimization.
While some scholars focused on the use of baffles and fins in enhancing heat transfer by introducing flow obstruction, several other studies have investigated the use of wing and winglet VGs as heat transfer enhancement devices under various design configurations. These VGs have been applied in different locations, such as on the absorber plate or the bottom wall, and under diverse operating conditions. Skullong et al. [24] presented an experimental and numerical study on rectangular and trapezoidal winglet VGs (RWVG/TWVG) placed on the absorber plate, with an attack angle α = 30°, relative heights (BR = e/H = 0.2 and 0.48), and longitudinal pitch ratios PR = 1, 1.5, and 2, over Reynolds numbers ranging from 4100 to 25,500 with constant heat flux applied on absorber plate. In Phase 1, the highest rate of heat transfer and friction factor occurred at RWVG with a blockage ratio (BR) of 0.48 and a pressure ratio (PR) of 1, while the best thermal performance occurred at TWVG with a (BR) of 0.20 and (PR) 1.50. In Phase 2, part of the improvement involved incorporating perforations of different diameters (1, 3, 5 and 7 mm) into the VG winglets. The highest rate of heat transfer and friction factor also occurred with perforated RWVG (P-RWVG) with a diameter of 1 mm. The best thermal performance occurred with perforated TWVG (P-TWVG) and a diameter of 5 mm.
Following this, Chamoli et al. [25] numerically simulated modified winglet vortex generators (WVGs) to study their effect on flow and temperature in a solar air heater, varying tip-edge ratios (c/a) from 0 to 1 and attack angles α from 30° to 90°, over Reynolds numbers from 3500 to 16,000. The study demonstrated that both the Nusselt number (Nu) and friction factor (f) increase with the angle of attack (α) up to 60°, beyond which both parameters decrease. The maximum values of Nu and f were recorded at α = 60° and a (c/a) ratio of 1. In contrast, the highest thermal enhancement factor (TEF) was achieved with the WVG at an angle of attack of 30° and c/a = 0. Koolnapadol et al. [11] experimentally investigated RWVGs installed on the absorber plate. They examined three attack angles of 30°, 45°, and 60°, with aspect ratio AR = 10, relative wing pitches PR = Pl/H = 1.0, 1.5, and 2.0, and relative wing height BR= b/H= 0.67, across Reynolds numbers from 5290 to 22,700. The results indicated that both the Nusselt number (Nu) and friction factor (f) increased with larger attack angles, while they decreased with increasing relative wing pitches PR.
Extending the study further, Sari et al. [26] combined numerical and experimental approaches to evaluate SACs equipped with delta winglet vortex generators (DWLVGs) and baffles under three configurations: SAC without baffles or DWLVGs, SAC with six baffles alone, and SAC with six baffles plus three pairs of DWLVGs attached to the absorber plate. Their findings identified the third configuration — with a DWLVG height ratio of 0.5 — achieved the highest performance due to increased turbulence and elimination of corner vortices in SAC. Furthermore, Alnakeeb et al. [27] numerically analysed three VG shapes- rectangular, trapezoidal, and delta- placed on corrugated absorbers, testing attack angles of 15°, 30°, 45°, and 60° across Reynolds numbers between 7000 and 25,000. Results showed that rectangular VGs at Re = 7000 and an attack angle of 30° provided the optimal thermal-hydraulic performance.
Further investigations have explored various design variables in rectangular ducts. Zhou and Ye [28] experimentally evaluated the performance of various groups of WVGs, both flat and curved, with and without perforated holes. Their results revealed that curved WVGs delivered higher efficiency across all flow conditions. The study also underscored the significance of perforated holes in enhancing heat transfer, emphasizing that the hole diameter relative to the generator surface area and its location must be carefully considered and optimized. Moreover, Khanjian et al. [17] numerically examined the impact of attack angle on heat transfer and pressure drop in laminar flow within a parallel plate channel fitted with rectangular wing VGs on the duct’s bottom wall. Their simulations identified an optimal attack angle (α = 25°) for maximizing performance. Subsequently, Khanjian et al. [18] explored the impact of roll angle, ranging from 20° to 90°, on rectangular winglet pair vortex generators (RWPVGs) attached to the bottom wall in laminar flow, maintaining a constant attack angle (α = 30°). Their study revealed that varying the roll angle is not necessarily essential nor critical for achieving and maximising the best thermal-hydraulic performance.
An extensive literature review has revealed that the majority of the studies reviewed have concentrated on VG parameters including the angle of attack, roll angle, shape factor and configuration or geometry. A further examination of the literature indicates that almost all studies have been conducted using a VG mounted to the channel wall, typical of how they were originally designed. There has been significantly less effort devoted to examining how the placement of VGs in a transverse direction across the channel influences vortex formation or their ability to penetrate and modify the thermal boundary layer due to their proximity to the thermal boundary layer, with few and limited exceptions such as Aouissi and Chabane [14], who investigated mid-channel baffle placement. Motivated by this gap. This current research examines both experimentally and numerically the use of RWVGs to enhance flow characteristics within an air collector channel powered by solar energy using Ansys Fluent version 17.1. The initial part of the study was experimental, with numerical validation under the same conditions. Numerous numerical simulations have been conducted at laminar, steady flow conditions. The assumptions were justified based on the flow characteristics and geometric dimensions of the channel; the Reynolds number for the flow in the channel did not exceed 1744 and therefore is far below Re = 2300, the expected conventional transition threshold. Three VG positions are considered: z = 0 (bottom wall), z = H/4 (mid-channel), and z = H/2 (absorber plate). The ultimate objective is to determine the optimal placement that achieves the highest THPF, using RWVGs with dimensions derived from previous studies [18].
2.1 Solar air collector characteristics
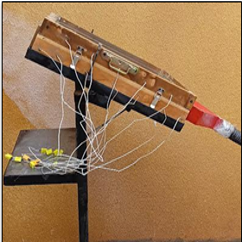
In this study, a single-channel SAC was fabricated based on the dimensions of a rectangular channel designed for a pair of RWVGs as reported by Khanjian et al. [18]. The SAC configuration, however, includes a row of four pairs of RWVGs. The dimensions and design details of the solar collector duct are presented in Table 1 and illustrated in Figure 1, respectively. The bottom surface of the SAC was insulated using three layers: a 2 mm galvanized sheet, 40 mm polystyrene, and 4 mm wood. The side walls were insulated with 40 mm thick wood panels. The top of the SAC channel adjoins the galvanized absorber plate, which is coated with a non-reflective layer, and is separated by a 40 mm air gap from the 4 mm thick glass cover. The material properties employed in the SAC construction are summarized in Table 2. The experiments were conducted in Biskra, Algeria, with the SAC installed at an inclination angle of 38°.
Table 1. Solar air collector (SAC) channel dimensions [18]
|
Parameter |
Symbol |
Value (mm) |
|
Channel height |
H |
38.6 mm |
|
Channel width |
W |
1.6 H |
|
Channel length |
L |
13 H |
|
Angle of attack |
α |
30° |
|
Inclination Angle |
β |
90° |
|
Vortex generator (VG) length |
S |
1.5 H |
|
VG height |
K |
0.5 H |
|
Distance from the inlet to VG |
R |
1.55 H |
|
VG thickness |
E |
0.052 H |
|
Distance from duct center line to VG |
N |
0.1 H |
Table 2. Thermo-physical characteristics of the elements [29]
|
Materials |
Density (ρ) [kg/m3] |
Specific Heat (CP) [J/kg‧K] |
Thermal Conductivity (λ) [W/m‧K] |
|
Galvanized |
7800 |
473 |
45 |
|
Polystyrene |
16 |
1670 |
0.037 |
|
Wood |
5100 |
1200 |
0.15 |
|
Glass |
1.2 |
1500 |
1.5 |
2.2 Rectangular winglet vortex generators’ technical characteristics
Four pairs of RWVGs were manufactured from galvanized metal. In the initial experimental setup, the RWVGs were mounted on the channel’s bottom surface. In a subsequent setup, the RWVGs were positioned at mid-channel by fastening them to small-diameter cylindrical metal rods attached to the channel walls. Detailed specifications of the RWVGs are provided in Figure 2 and Tables 1 and 2.
Figure 2. Three-dimensional (3D) view of study domain, (c) top view showing attack angle  , duct and vortex generator (VG) dimensions
2.3 Measurement instruments
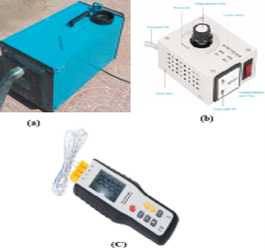
The experimental setup incorporated modern precise instruments for temperature measurement and inlet velocity control, as depicted in Figure 3. These include:
Figure 3. Used devices: (a) aspirator, (b) voltage regulator, and (c) thermocouple
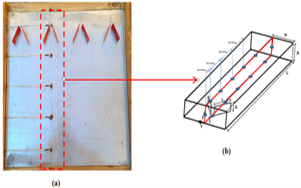
Figure 4. Thermocouple sensor positions: (a) experimental investigation and (b) schematic diagram
2.4 Experimental studied cases
Three configurations were experimentally evaluated: an empty duct, a duct containing four pairs of RWVGs mounted on the bottom wall, and a duct with four pairs of RWVGs positioned at mid-channel. Experiments were executed over three distinct days in March, carefully selected to minimize wind interference and adverse weather, thereby ensuring stable laminar flow conditions. Each configuration was tested at two different inlet velocities, with a 30-minute time interval between successive measurements. Temperature data were acquired from five equidistant points on both the absorber plate and the bottom surface along the SAC duct length, specifically at the location of the second pair of RWVGs, alongside inlet and outlet air temperatures.
The numerical simulation process involved several sequential steps: geometric modelling, mesh generation, and boundary condition specification. These procedures were performed using ANSYS Fluent software, which employs the finite volume-based (FVM) computational fluid dynamics (CFD) software. Through the latter, the Navier-Stokes and energy equations were solved under laminar flow assumptions, with air modelled as an incompressible Newtonian fluid possessing constant thermophysical properties. The SIMPLE algorithm was employed for pressure–velocity coupling. The energy, continuity, and momentum equations were solved iteratively until the solution converged, with convergence criteria set at 10-6 for the energy equation, and 10-3 for the continuity and velocity (x-y) equations. Detailed descriptions of all numerical procedures are provided in this section.
Multiple simulation runs were conducted, each requiring approximately 2 to 4 hours of computational time. Calculating the THPF and other related quantities requires determining several dimensional and non-dimensional parameters, such as:
The Reynolds number, a key non-dimensional parameter, is defined as follows:
$\operatorname{Re}=\frac{\rho V D_h}{\mu}$ (1)
where, $\rho$, $V$, and $\mu$ represent the fluid density, velocity, and dynamic viscosity, respectively. The hydraulic diameter $D_h$ of the channel is defined based on the cross-sectional area $A$ and the perimeter $P$;
$D_h=\frac{4 A}{P}$ (2)
The global Nusselt number $(\mathrm{Nu})$ is defined as a function of the heat transfer coefficient $h$, thermal conductivity $\lambda$, and hydraulic diameter $D_h$ as follows:
$N_U=\frac{h \cdot D_h}{\lambda}$ (3)
The heat transfer coefficient h , is expressed by the relation:
$h=\frac{Q}{S \Delta T_{m l}}$ (4)
where, S is the heat transfer area, Q is the heat flux, and $\Delta T_{m l}$ is the logarithmic mean temperature difference. The heat flux Q and the logarithmic mean temperature difference are given by:
$Q=\dot{m} C_P \Delta T=\dot{m} C_P\left(\mathrm{~T}_{\text {out }}-\mathrm{T}_{\text {in }}\right)$ (5)
$\Delta T_{m l}=\frac{\left(\mathrm{T}_{\text {in }}-\mathrm{T}_w\right)-\left(\mathrm{T}_{\text {out }}-\mathrm{T}_w\right)}{\ln \left(\frac{\mathrm{T}_{\text {out }}-\mathrm{T}_w}{\mathrm{~T}_{\text {in }}-\mathrm{T}_w}\right)}$ (6)
Here, m denotes the mass flow rate, Cp is the specific heat capacity at constant pressure, and Tin, Tout, and Tw represent the inlet temperature, outlet temperature, and absorber plate temperature, respectively.
To evaluate the THPF, it is necessary to calculate the friction coefficient f, which is defined as [30]:
$f=\frac{\left(\frac{\Delta P}{L}\right) D_h}{2 \rho V^2}$ (7)
where, ∆P is the pressure drop across the duct, and L is its length.
The THPF is a vital element in assessing the thermal efficiency of SACs, as it accounts for the improvement in heat transfer relative to the hydraulic performance (friction loss). THPF is defined by the following relationship [31]:
$\mathrm{THPF}=\left(\frac{N_U}{N_{U_0}}\right)\left(\frac{f}{f_0}\right)^{-\frac{1}{3}}$ (8)
3.1 Geometry, computational domain and boundary conditions
A three-dimensional (3D) numerical study was conducted on a segment of the SAC channel containing one pair of RWVGs, preserving all actual physical dimensions as illustrated in Figure 2. Four geometrical configurations were examined: (1) an empty SAC duct without RWVGs, (2) a rectangular SAC duct with RWVGs attached to the bottom wall, (3) an SAC with RWVGs positioned at mid-channel, and (4) an SAC with RWVGs affixed beneath the upper wall. Due to symmetry about the XZ-plane, only half of the domain was simulated, as shown in Figure 2. Under a steady state of laminar flow, the simulations were conducted using Reynolds numbers at the inlet that were based on the hydraulic diameter and ranged from 528 to 1744, all of which are substantially lower than the typical transition Reynolds number threshold to turbulent flow (Re ≈ 2300). With a uniform inlet temperature of Tin = 300 K, the temperature of the upper wall was fixed at Tw = 350 K, while the remaining walls, including the bottom and VG surfaces, were modelled as adiabatic.
3.2 Mesh generation
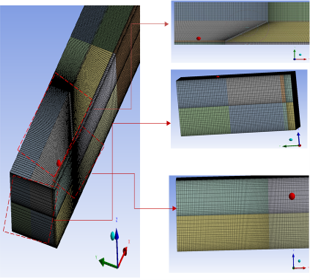
To ensure accurate and efficient control over this process and ensure convergence, the study domain was discretized into a set of grids, employing a quadratic mesh structure. Given the significant gradients in velocity, temperature, and pressure near the walls, the mesh was locally refined to enhance grid quality, as illustrated in Figure 5. The selection of an appropriate mesh followed a systematic approach: initially, the mesh density was progressively increased while monitoring the impact on key results, specifically the outlet temperature. Mesh refinement was terminated once further increases in density produced negligible changes in the results. Ultimately, the mesh with the lowest density that satisfied accuracy and convergence criteria was selected to optimize computational efficiency. An example of the mesh sensitivity analysis for case B at an inlet velocity of 0.33 m/s is presented in Table 3.
Figure 5. Different views for mesh generations
Table 3. Mesh test
|
Number of Nodes |
Number of Elements |
Simulated Outlet Temperature |
Error % |
|
1045199 |
1001580 |
310.915 |
/ |
|
1168145 |
1120976 |
310.9324 |
0.0055 |
|
1306388 |
1255516 |
310.9916 |
0.0190 |
|
1471591 |
1415808 |
310.9963 |
0.0015 |
|
1765041 |
1700160 |
310.9953 |
0.0003 |
3.3 Validation
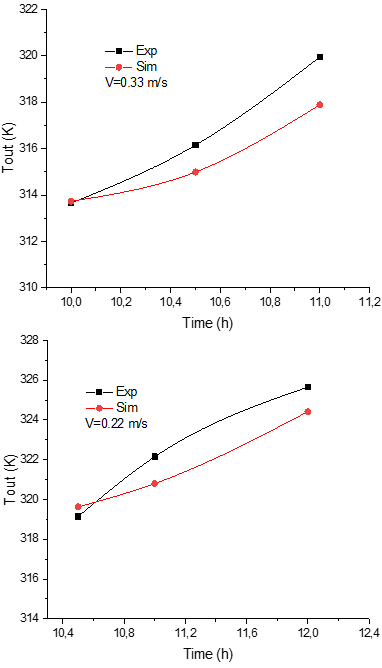
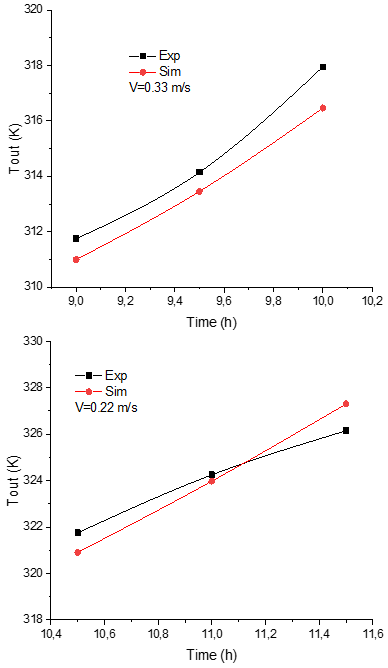
Following the experimental phase, the numerical model was validated through comparison of outlet temperature between the numerical and experimental models, as illustrated in Figures 6–8. In this segment, three cases were examined: an empty duct, a duct with RWVGs attached to the bottom wall, and a duct with RWVGs positioned at mid-channel. The validation was conducted for two distinct inlet velocities, 0.22 m/s and 0.33 m/s. Boundary conditions included a constant inlet temperature and fixed temperatures for the bottom and upper duct walls. Air was modelled as an incompressible Newtonian fluid throughout.
At all validation stages, the results exhibited strong agreement between numerical simulation and experimental models, with only minor discrepancies observed in outlet temperatures that were measured and calculated numerically. The reasons behind these discrepancies are numerous. The first reason is the variations in the production of the SAC, leading to small deviations in the values between the numerical and experimental conditions. The second reason is that measuring devices have built-in uncertainties in their quoted accuracy. Thirdly, temperature devices give point measurements, rather than being representative of the outlet temperature at all points throughout the cross-section of the collector; however, the maximum relative error remains below 2% (which is well within acceptable values). Therefore, the conclusions of the study remain valid based on these minor differences. Overall, the strong correlation between the numerical and experimental outcomes confirms the numerical model’s validity, thereby enabling its application for further investigation throughout the study.
Figure 6. Numerical and experimental outlet temperatures evolution for the day in the empty duct
Figure 7. Numerical and experimental outlet temperatures evolution for the day in case A
Figure 8. Numerical and experimental outlet temperatures evolution for the day in case B
4.1 Flow and thermal fields analysis
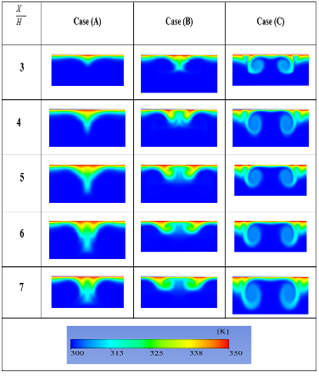
Figures 9 and 10 present the velocity contours and temperature distributions in cross-sectional planes at various distances from the channel inlet for Re = 1744. Case A exhibits the fluid is thrown towards the core of the flow between the pair of RWVGs (in the symmetry plane). Due to the VGs' position far from the thermal boundary layer and the weakness of vortex intensity under laminar flow, heat transfer occurs in the plane of symmetry (Figure 10) without direct penetration of the thermal boundary layer. In case B, opposing vortices (upper and lower) are present along the transverse direction of the channel. In this case, the vortices are more intense, and the secondary flow is strong, contributing to more homogeneous mixing of the fluid (due to the generators' positioning at the center of the flow). The thermal boundary layer is directly broken, causing heat to be drawn from the upper wall in the form of thermal vortices (Figure 10). In contrast, case C vortices form near the heat transfer region. Due to the generators' location within the thermal boundary layer, they directly thin the layer and draw heat to the flow center in the form of thermal vortices.
Figure 9. Cross-sectional velocity contours of case Re = 1744 for different distance values ($\frac{X}{H}$)
Figure 10. Cross-sectional temperature distribution (Re = 1744) for different distance values ($\frac{X}{H}$)
4.2 Pressure loss characteristics
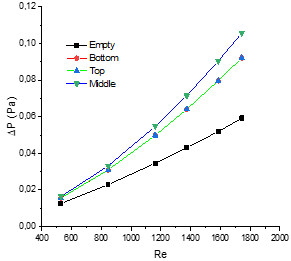
Figure 11 depicts the variation of pressure drop as a function of Reynolds number. The two cases A and C exhibit nearly identical pressure drop curves, attributable to the similarity in their overall geometries. Thus, cases A and C show that pressure drop is generally unaffected by wall temperature as the thermophysical properties of air stay approximately the same throughout the simulations. On the other hand, when flow velocity is increased, it increases vortex development; therefore, more momentum loss will occur, resulting in greater than normal pressure drop. The reference case (empty channel) displays the lowest pressure drop across all Reynolds numbers, recording a minimum value of approximately 0.012 at Re = 528. Conversely, case B incurs the highest pressure drop values for all Reynolds numbers, reaching approximately 0.1 at Re = 1744. This is due, as mentioned earlier in the analysis of Figure 9, to the formation of more intense vortices and the emergence of strong secondary flow caused by the generators' location within the high-velocity area of the main flow. The fluid's collision with the generators at this location leads to consumption of the fluid's energy and consequently, higher pressure drop.
Figure 11. Pressure drop dependence on laminar Reynolds number values
Notably, it is evident that while RWVGs enhance heat transfer, they also contribute to increased pressure drop, with the magnitude of this increase being strongly dependent on their position within the channel.
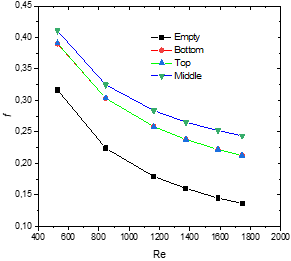
To evaluate the efficiency of the SAC channel, the friction factor was calculated, and its variation with Reynolds number is presented in Figure 12. The curves indicate that increasing the airflow velocity leads to a decrease in the friction coefficient. Additionally, the friction factor curves for the two cases A and C are nearly identical. This similarity, as previously noted in the pressure drop analysis, arises from the overall comparable geometries of these configurations. In contrast, case B exhibits the highest friction factor values, attributed to the formation of two dominant vortices near the upper and lower walls. Although the dimensions of the RWVGs were consistent across all cases, their placement significantly influenced vortex formation, resulting in increased friction losses when the RWVGs were located mid-channel.
Figure 12. Friction factor variation with the Reynolds number values
4.3 Heat transfer characteristics and thermohydraulic performance assessment
Figure 13 illustrates the variation of the average Nusselt number as a function of the Reynolds number. Across all cases, an increase in the Nusselt number was observed with rising Reynolds number, while the reference case (empty channel) consistently exhibited the lowest Nusselt numbers. Among the enhanced cases, the highest Nusselt numbers in the range from Re = 528 to Re = 1585 were recorded for case C. This enhancement is attributed to the development of thinner thermal boundary sublayers near the heated wall, which facilitates heat exchange between the absorber surface and the airflow. The role of generators near the hot boundary layer is more important in this low Reynolds number range, as weak vortices in cases A and B are unable to directly affect the hot boundary layer.
Figure 13. Nusselt number vs. Reynolds number
In the Reynolds range below 950, the Nusselt number for case A takes on intermediate values. This is because the main vortex resulting from this case is more efficient than the pair of opposing vortices resulting from case B. Because the two opposing vortices influence each other, they produce vortices along the height that are characterized by a low speed towards the wall.
Beyond Re = 950, the Nusselt number for case B initially assumes intermediate values but increases progressively, ultimately reaching the highest value observed among all studied cases at Re = 1744. This performance is explained by the formation of the strongest vortex structures and the elevated average flow velocity in the channel. Where vortices become able to directly affect the hot boundary layer and propel hot and cold air towards the flow core.
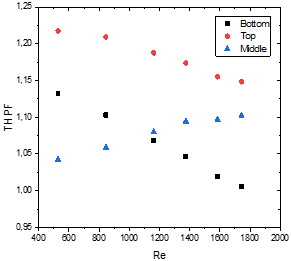
Figure 14 illustrates the variation of the global THPF with Reynolds number, taking the empty channel as the baseline reference. Overall, the results show that, the results indicate that, for most configurations, increasing the inlet velocity leads to a decrease in performance. However, the case B exhibits a different behaviour, reaching the highest THPF value of 1.10 (10%) at Re = 1744. This improvement appears to stem from the fact that the enhancement in heat transfer grows more rapidly than the accompanying increase in friction losses. The latter is mainly due to the stronger mixing generated by the formation of double vortices along the height of the channel. As a result, thinner boundary layers develop during the flow, which enhances heat transfer.
Figure 14. Variation of thermal-hydraulic performance factor (THPF) with the Reynolds number
These observations also suggest that placing the generators closer to the heated layer does not necessarily guarantee better performance compared with generators positioned in the middle of the channel for other Reynolds number ranges (turbulent flow). Therefore, the proximity of VGs to the boundary layer cannot be considered a definitive criterion for achieving higher performance.
Although the formation of vortices along the cross-section of the channel resulted in a significant pressure loss, it also led to a more efficient and extensive mixing process, such that the increase in the Nissalt number was greater than the frictional loss, as demonstrated by the study in every instance. Therefore, placing the generators in the free-flow zone case B proved effective in thinning the hot boundary layer by forming opposing double vortices that allow for more homogeneous mixing, especially at high speeds where vortices are able to directly affect the boundary layers.
Figures 13 and 14 show an overall increase of vortex intensity and subsequently, an improvement in the THPF with higher flow velocities (case B). Both figures indicate that the higher the flow velocity, the greater the chance of producing excellent results while in a turbulent-flow state. However, since the current research is restricted to a laminar-flow condition, the potential for an increased performance at turbulent-flow conditions cannot be verified and should be addressed by additional studies. Therefore, it is suggested that future research be extended to include turbulent-flow conditions.
4.4 Practical applicability and scalability
The arrangement of rectangular-wing vortex-generators placed in the middle region of a channel can easily be fitted into existing designs of flat plate SACs. While case B may result in more enhancement of heat transfer than any previous case studied, it also resulted in a much higher pressure drop, meaning that more hydraulic power will be required than through the other cases examined in this study. Therefore, the best way to determine which of these types of configurations would be the best to use is to evaluate the overall thermal-hydraulic performance, pumping power needs, and engineering feasibility of each respective configuration against each other using a balanced approach.
This present investigation examined the influence of RWVG placement on the thermo-hydraulic performance of a SAC. The results consistently demonstrated that the average Nusselt number increased monotonically with the Reynolds number across all tested configurations.
For moderate Reynolds numbers, the configuration with RWVGs mounted beneath the absorber plate (case C) provided the most effective heat transfer. This is primarily due to the breakdown of the boundary layers near the absorber plate. However, at higher Reynolds number values (Re = 1744), the configuration with RWVGs situated in the middle of the channel (case B) yielded the maximum Nusselt number. This outcome is a direct consequence of the stronger vortex generation and elevated mean velocity facilitated by the central placement.
Regarding hydraulic characteristics, the pressure drop and friction factor trends for the bottom-plate (case A) and absorber-plate (case C) configurations were nearly identical, reflecting their geometrical similarity and symmetry. In contrast, the central arrangement (case B) consistently produced the highest-pressure losses, which can be attributed to the simultaneous development of vortices near both the upper and lower channel walls. Despite this drawback, the THPF for the central configuration reached its peak value of 1.10 at Re = 1744. The findings underscore the critical role of VG positioning in enhancing heat transfer while efficiently managing hydraulic penalties. This study suggests that strategic placement of RWVGs can optimize the trade-off between thermal enhancement and pressure drop.
Based on the present numerical trends observed, it is anticipated that the central configuration would exhibit even greater efficiency under turbulent flow regimes, owing to the intensified vortex structures expected in such conditions.
|
A |
Cross section area, m2 |
|
Cp |
Specific heat of air, J/kg‧K |
|
Dh |
Hydraulic diameter, m |
|
L |
Length of the channel, m |
|
$\dot{m}$ |
Mass flow rate, Kg/s |
|
P |
Wetted perimeter, m |
|
ΔP |
Pressure drop, Pa |
|
Q |
Useful heat gain, W/m2 |
|
S |
Heat transfer surface area, m2 |
|
V |
Velocity, m/s |
|
$\Delta T_{m l}$ |
The logarithmic mean temperature difference, K |
|
h |
Heat transfer coefficient, W/m2K |
|
Dimensionless parameters |
|
|
Nu |
Nusselt number |
|
f |
Friction factor |
|
Re |
Reynolds number |
|
Subscripts |
|
|
in |
Inlet |
|
out |
Outlet |
|
w |
Wall |
|
Greek symbols |
|
|
λ |
Thermal conductivity |
|
ρ |
Density |
|
μ |
dynamic viscosity |
[1] Abene, A., Dubois, V., Le Ray, M., Ouagued, A. (2004). Study of a solar air flat plate collector: Use of obstacles and application for the drying of grape. Journal of Food Engineering, 65(1): 15-22. https://doi.org/10.1016/j.jfoodeng.2003.11.002
[2] Karim, M.A., Hawlader, M.N.A. (2006). Performance evaluation of a v-groove solar air collector for drying applications. Applied Thermal Engineering, 26(1): 121-130. https://doi.org/10.1016/j.applthermaleng.2005.03.017
[3] Chemkhi, S., Zagrouba, F., Bellagi, A. (2004). Drying of agricultural crops by solar energy. Desalination, 168: 101-109. https://doi.org/10.1016/j.desal.2004.06.174
[4] Al-Sulaiman, F.A., Zubair, M.I., Atif, M., Gandhidasan, P., Al-Dini, S.A., Antar, M.A. (2015). Humidification dehumidification desalination system using parabolic trough solar air collector. Applied Thermal Engineering, 75: 809-816. https://doi.org/10.1016/j.applthermaleng.2014.10.072
[5] Khanlari, A., Güler, H.Ö., Tuncer, A.D., Şirin, C., Bilge, Y.C., Yılmaz, Y., Güngör, A. (2020). Experimental and numerical study of the effect of integrating plus-shaped perforated baffles to solar air collector in drying application. Renewable Energy, 145: 1677-1692. https://doi.org/10.1016/j.renene.2019.07.076
[6] Zhang, J., Zhu, T. (2022). Systematic review of solar air collector technologies: Performance evaluation, structure design and application analysis. Sustainable Energy Technologies and Assessments, 54: 102885. https://doi.org/10.1016/j.seta.2022.102885
[7] Karkaba, H., Dbouk, T., Habchi, C., Russeil, S., Lemenand, T., Bougeard, D. (2020). Multi objective optimization of vortex generators for heat transfer enhancement using large design space exploration. Chemical Engineering and Processing-Process Intensification, 154: 107982. https://doi.org/10.1016/j.cep.2020.107982
[8] Fan, M., You, S., Gao, X., Zhang, H., et al. (2019). A comparative study on the performance of liquid flat-plate solar collector with a new V-corrugated absorber. Energy Conversion and Management, 184: 235-248. https://doi.org/10.1016/j.enconman.2019.01.044
[9] Li, S., Wang, H., Meng, X., Wei, X. (2017). Comparative study on the performance of a new solar air collector with different surface shapes. Applied Thermal Engineering, 114: 639-644. https://doi.org/10.1016/j.applthermaleng.2016.12.026
[10] Habeeb, G.A., Jaddoa, A.A., Alkhasraji, J.M.D. (2025). Effect of the absorber surface roughness on the performance of a solar air collector: An experimental analysis. International Journal of Heat and Technology, 43(4): 1276-1286. https://doi.org/10.18280/ijht.430407
[11] Koolnapadol, N., Promvonge, P., Skullong, S. (2020). Performance evaluation of solar receiver heat exchanger with rectangular-wing vortex generators. International Journal of Mechanical Engineering and Robotics Research, 9(1): 130-135. https://doi.org/10.18178/ijmerr.9.1.130-135
[12] Abbas, N.Y., Abbas, A.S. (2026). Synergistic thermo-hydraulic performance of channels equipped with perforated triangular pin fins and longitudinal vortex generators. International Journal of Heat and Technology, 44(2): 517-528. https://doi.org/10.18280/ijht.440207
[13] Wang, D., Liu, J., Liu, Y., Wang, Y., Li, B., Liu, J. (2020). Evaluation of the performance of an improved solar air heater with “S” shaped ribs with gap. Solar Energy, 195: 89-101. https://doi.org/10.1016/j.solener.2019.11.034
[14] Aouissi, Z., Chabane, F. (2022). Numerical and experimental study of thermal efficiency of the transversal rectangular baffles with incline angle inside of solar air collector. Energy Sources, Part A: Recovery, Utilization, and Environmental Effects, 44(4): 8921-8942. https://doi.org/10.1080/15567036.2022.2128474
[15] Romdhane, B.S. (2007). The air solar collectors: Comparative study, introduction of baffles to favor the heat transfer. Solar Energy, 81(1): 139-149. https://doi.org/10.1016/j.solener.2006.05.002
[16] Nghaimesh, S.J., Jabbar, M.A. (2024). Heat transfer enhancement simulation employing flat and curved winglet vortex generator pairs with punched holes. International Journal of Heat and Technology, 42(5): 1643-1650. https://doi.org/10.18280/ijht.420518
[17] Khanjian, A., Russeil, S., Bougeard, D., Habchi, C., Lemenand, T. (2016). Effect of the angle of attack of a rectangular vortex generator on the heat transfer in a parallel plate flow. In 2016 3rd International Conference on Advances in Computational Tools for Engineering Applications (ACTEA), Zouk Mosbeh, Lebanon, pp. 21-25. https://doi.org/10.1109/ACTEA.2016.7560105
[18] Khanjian, A., Habchi, C., Russeil, S., Bougeard, D., Lemenand, T. (2017). Effect of rectangular winglet pair roll angle on the heat transfer enhancement in laminar channel flow. International Journal of Thermal Sciences, 114: 1-14. https://doi.org/10.1016/j.ijthermalsci.2016.12.010
[19] Syaiful, Priyadi, M.U.Z., Yunianto, B., Sinaga, N. (2024). Enhancing heat transfer in rectangular channels: An experimental study on perforated concave delta winglet vortex generators. International Journal of Heat and Technology, 42(1): 132-140. https://doi.org/10.18280/ijht.420114
[20] Daliran, A., Ajabshirchi, Y. (2018). Theoretical and experimental research on effect of fins attachment on operating parameters and thermal efficiency of solar air collector. Information Processing in Agriculture, 5(4): 411-421. https://doi.org/10.1016/j.inpa.2018.07.004
[21] Ammar, M., Mokni, A., Mhiri, H., Bournot, P. (2020). Numerical analysis of solar air collector provided with rows of rectangular fins. Energy Reports, 6: 3412-3424. https://doi.org/10.1016/j.egyr.2020.11.252
[22] Mohammadi, K., Sabzpooshani, M. (2013). Comprehensive performance evaluation and parametric studies of single pass solar air heater with fins and baffles attached over the absorber plate. Energy, 57: 741-750. https://doi.org/10.1016/j.energy.2013.05.016
[23] Chabane, F., Moummi, N., Benramache, S., Bensahal, D., Belahssen, O. (2013). Collector efficiency by single pass of solar air heaters with and without using fins. Engineering Journal, 17(3): 43-55. https://doi.org/10.4186/ej.2013.17.3.43
[24] Skullong, S., Promthaisong, P., Promvonge, P., Thianpong, C., Pimsarn, M. (2018). Thermal performance in solar air heater with perforated-winglet-type vortex generator. Solar Energy, 170: 1101-1117. https://doi.org/10.1016/j.solener.2018.05.093
[25] Chamoli, S., Lu, R., Xu, D., Yu, P. (2018). Thermal performance improvement of a solar air heater fitted with winglet vortex generators. Solar Energy, 159: 966-983. https://doi.org/10.1016/j.solener.2017.11.046
[26] Sari, A., Sadi, M., Shafiei Sabet, G., Mohammadiun, M., Mohammadiun, H. (2021). Experimental analysis and exergetic assessment of the solar air collector with delta winglet vortex generators and baffles: Journal of Thermal Analysis and Calorimetry, 145(3): 867-885. https://doi.org/10.1007/s10973-020-10298-6
[27] Alnakeeb, M.A., Hassan, M.A., Teamah, M.A. (2024). Thermal performance analysis of corrugated plate solar air heater integrated with vortex generator. Alexandria Engineering Journal, 97: 241-255. https://doi.org/10.1016/j.aej.2024.04.019
[28] Zhou, G., Ye, Q. (2012). Experimental investigations of thermal and flow characteristics of curved trapezoidal winglet type vortex generators. Applied Thermal Engineering, 37: 241-248. https://doi.org/10.1016/j.applthermaleng.2011.11.024
[29] Chabane, F., Grira, F., Moummi, N., Brima, A. (2019). Experimental study of a solar air heater by adding an arrangement of transverse rectangular baffles perpendicular to the air stream. International Journal of Green Energy, 16(14): 1264-1277. https://doi.org/10.1080/15435075.2019.1671401
[30] Menasria, F., Zedairia, M., Moummi, A. (2017). Numerical study of thermohydraulic performance of solar air heater duct equipped with novel continuous rectangular baffles with high aspect ratio. Energy, 133: 593-608. https://doi.org/10.1016/j.energy.2017.05.002
[31] Layek, A., Saini, J.S., Solanki, S.C. (2009). Effect of chamfering on heat transfer and friction characteristics of solar air heater having absorber plate roughened with compound turbulators. Renewable Energy, 34(5): 1292-1298. https://doi.org/10.1016/j.renene.2008.09.016