Abdullah M. Abdulwahad | Lubna A. Hussein | Khawla Dawood Khalaf | Yasir Hassan Ali | Emad Toma Karash* | Rafal Khalid Jasim Sulaiman
© 2026 The authors. This article is published by IIETA and is licensed under the CC BY 4.0 license (http://creativecommons.org/licenses/by/4.0/).
OPEN ACCESS
Designing office buildings and classrooms to be comfortable in extremely dry conditions remains a significant challenge. In modern building design, computational methods for analyzing fluid dynamics elements are employed. ANSYS software provides a preliminary solution for modern designs, demonstrating heat distribution and transfer within different wall structures. This contributes to design methods, heat distribution, and the selection of optimal materials for achieving the best and most sustainable thermal insulation for these buildings, resulting in lower costs and higher quality before project implementation. The goal of this project is to use ANSYS Fluent software to create a precise numerical model for estimating thermal loads in multi-story buildings. In order to enhance the efficiency of heating and cooling systems, it looks at the distribution of heat and airflow throughout each floor. Additionally, it seeks to deliver precise data to assist in the construction of intelligent and energy-efficient structures while guaranteeing the thermal comfort of building inhabitants. The average temperature of lightweight silicate bricks was ≈30 ℃ with a standard deviation of ≈5 ℃, and they achieved a reduction in internal temperature of more than 35%. The correlation coefficient between conductivity and temperature rise was R ≈ 0.85. Total heat-transfer rate of 0.45 W/m2 and internal stability of 23.7 ℃ make the second model (Thermstone) the most thermally efficient, while 1.12 W/m² and internal stability of 21.4 ℃ make the first model the least efficient. The glass wall had the maximum heat transmission (1283.3 W/m2), making it the component with the biggest total heat-transfer rate in the structure. At 9.2565 W/m2, the roof, on the other hand, showed the least amount of heat transfer, demonstrating how well the thermal insulation system worked to stop total heat-transfer rate.
thermal insulation, convection, heat distribution, heat transfer, numerical simulation, building envelope
The use of thermal insulation materials throughout prehistoric times and before the Industrial Revolution demonstrates humanity's constant quest to adapt to its surroundings, particularly extreme temperatures. Early humans used natural materials such as straw, clay, and wool to protect their shelters from heat and cold. With urban development, energy consumption in the building sector has increased significantly, accounting for about one-third of global energy use, while HVAC systems represent a major portion of this demand [1-5]. Advanced numerical tools such as ANSYS Fluent based on Computational Fluid Dynamics (CFD) are widely applied to analyze heat transfer mechanisms, including conduction, convection, and radiation, while considering environmental effects such as solar radiation and wind conditions [6-9]. Thermal simulation of multi-story buildings helps evaluate temperature distribution, airflow behavior, and floor-by-floor heat loads. Accurate envelope properties, especially the U-value, are essential for reliable energy prediction and improving building efficiency. These approaches support the design of sustainable, smart, and energy-efficient buildings [9-16].
Recent studies have confirmed the effectiveness of integrating thermal simulation and CFD methods in predicting heat loads and improving high-rise building performance. Combining CFD with energy simulation provides more accurate airflow and heat distribution analysis [17]. Research also indicates that optimized windows, ventilation strategies, improved airflow distribution, and enhanced insulation systems significantly reduce heat transfer and improve indoor thermal comfort [18-23].
The results of this study, conducted on various cooling systems, indicate that achieving high cooling efficiency and minimizing uneven heat distribution within these systems requires an optimal and homogeneous airflow distribution [24]. Zhao et al. [25] also demonstrate that achieving high energy efficiency in large and tall buildings necessitates a highly accurate estimation of their heat loads. Using ANSYS software to estimate these loads provide a highly accurate model for forecasting them, particularly in areas exposed to strong sunlight and wind, and in selecting the type of glass used in window design [26, 27]. This study showed that the error rate obtained using the software, compared to initial estimates for these buildings, decreased to approximately 18%. This reduction was achieved by adjusting for the internal thermal requirements of the building's occupants [28]. This study clearly demonstrates the value of the ANSYS fundamental analysis software, providing a detailed description of the heat flow process through a comprehensive analysis that integrates static and dynamic analyses [29]. In this study, an improved Block–Gebhart (B–G) model was developed to enhance the prediction accuracy of thermally unstable environments and stratified air conditioning loads (SACL) in large-area buildings, with a particular focus on glazed structures. The results indicate that the mean relative absolute error (MAPE) for both air temperature and interior wall temperature remained within acceptable levels throughout the measurement period [30]. The Personal Comfort Model (PCM) was developed and validated using field experimental data through machine learning, and the results showed that it more accurately reflects individual thermal needs [31]. The experimental verification in this study across office, residential, and educational building models demonstrates superior performance, achieving an average absolute error of 6.8% in energy prediction and a reduction in average energy consumption of 23.7% compared to baseline standards-compliant models [32]. This study proposes a framework combining CFD, multi-zone airflow modeling, and building energy simulation. The results show that clustered buildings have up to 91% lower natural ventilation rates compared to individual buildings This study proposes a framework combining CFD, multi-zone airflow modeling, and building energy simulation. The results show that clustered buildings have up to 91% lower natural ventilation rates compared to individual buildings [33]. This study focused on using simulation software to calculate the optimal capacity of an air conditioning and refrigeration unit. The results showed a significant reduction in energy consumption, reaching approximately 12%. Furthermore, the study's results, based on computer-aided assessments, indicated a reduction in total heat load requirements of approximately 30% when the building's thermal insulation was improved [34]. These findings highlight the importance of optimizing building facades and exterior walls by considering external factors such as solar radiation and wind to reduce energy demand. The study also emphasized the use of current climate data in ANSYS modeling, achieving a 22% improvement in annual energy demand prediction accuracy [35, 36].
This paper aims to use ANSYS Fluent software to create an accurate numerical model for estimating heat loads in multi-story buildings. To improve the efficiency of heating and cooling systems, the project studies heat distribution and airflow on each floor. Furthermore, the project seeks to provide precise data to help design smart, energy-efficient structures while ensuring thermal comfort for building occupants. The results will focus on identifying heat loads and optimizing heat distribution to support the design of highly efficient air conditioning systems, with the goal of reducing overall energy consumption.
4.1 Building areas
Table 1, the building envelope areas on each floor of a three-story building. A uniform floor layout with an area of 1394.04 m² per floor was considered. The building envelope consists of 1461.18 m² of brick facades, 360.75 m² of Harlan stone cladding, and 271.49 m² of window openings per floor. Structural beams occupy 77.4 m² per floor, with a total area of 232.2 m², demonstrating a balanced architectural and structural configuration. These combined values provide a crucial foundation for using simulation software such as ANSYS to calculate thermal loads and analyze heat transfer, as they offer an accurate representation of the building's outer envelope.
Table 1. The building envelope areas on each floor of a three-story building
|
No. |
Floors |
Interior Walls Area (m2) |
Exterior Walls Area (Block) (m2) |
Exterior Walls Area (Halan Stone) (m2) |
Window Area (m2) |
Doors Area (m2) |
|
1. |
First Floor |
1394.04 |
487.06 |
120.25 |
271.49 |
77.4 |
|
2. |
Second Floor |
1394.04 |
487.06 |
120.25 |
271.49 |
77.4 |
|
3. |
Third Floor |
1394.04 |
487.06 |
120.25 |
271.49 |
77.4 |
|
Total Three Floors |
4182.12 |
1461.18 |
360.75 |
814.47 |
232.2 |
|
4.2 Material properties
Al-Halan, or natural stone, is a popular building material for multi-story structures' outer facades because of its exceptional thermal insulation and high durability. According to research and technical guidelines, the right thickness for a stone wall depends on the load and the type of application. To guarantee rigidity and mechanical and thermal stability, load-bearing walls should be between 300 and 500 mm thick [37]. As long as there is an air gap or an insulating backing layer, a thickness of 75–100 mm is adequate when utilizing stone as an external cladding for protection or ornament [38]. According to recent assessments, cutting the thickness to less than 70 mm can result in a 20% increase in total heat-transfer rate and a decrease in mechanical resistance [39]. In order to enhance structural performance and make maintenance easier, mechanical attaching systems for outside stone have also been suggested by applied research [40]. Al-Halan wall thickness in modern structures should therefore be between 100 and 300 mm for non-load-bearing external walls and between 300 and 500 mm for key structural elements [41].
The thermal characteristics of some frequently used building envelope materials, such as limestone, concrete blocks, plaster and gypsum-cement layers, float glass, and insulated air, are shown in Table 2. The information in Table 2 illustrates how solid and gaseous materials behave differently in terms of heat. Concrete blocks and limestone are less effective insulators since their thermal conductivity is comparatively higher than that of the other materials. Plaster layers can control heat transfer to a considerable extent. On the other hand, float glass needs extra insulation because it is an excellent heat conductor. The best-performing material in terms of thermal resistance is insulated air, which improves the thermal system's efficiency in the composite wall.
Table 2. The thermal characteristics of building materials used in the building envelope [42-63]
|
Property |
Halan Stone |
Concrete Block |
Gypsum Skim Coat |
Cement-Lime Skim Coat |
Float Glass |
Insulated Air |
Thermo Stone |
Lightweight Silicate Brick |
|
Density (kg/m³) |
2550 |
2100 |
1100 |
1850 |
2500 |
1.2 |
530 |
700 |
|
Compressive Strength (MPa) |
70 |
23 |
13 |
18 |
670 |
--- |
35 |
5 |
|
Tensile Strength (MPa) |
6.5 |
4.5 |
3.5 |
5.5 |
85 |
--- |
12 |
1 |
|
Elastic Modulus (GPa) |
49 |
17.5 |
5.2 |
18.3 |
66 |
--- |
16 |
4.5 |
|
Poisson’s Ratio |
0.25 |
0.16 |
0.22 |
0.17 |
0.23 |
--- |
0.18 |
0.22 |
|
Thermal Conductivity (W/m·K) |
1.62 |
1.33 |
0.33 |
0.93 |
0.95 |
0.025 |
0.096 |
0.12 |
|
Specific Heat Capacity (J/kg·K) |
875 |
925 |
1050 |
950 |
800 |
1000 |
1050 |
1000 |
|
Thermal Expansion Coefficient (1/K) |
6 × 10⁻⁶ |
10 × 10⁻⁶ |
11 × 10⁻⁶ |
10 × 10⁻⁶ |
9 × 10⁻⁶ |
2.1 × 10⁻5 |
8 × 10⁻⁶ |
6 × 10⁻⁶ |
|
Thermal Resistance (m²·K/W) |
0.21 |
0.33 |
0.037 |
0.012 |
0.007 |
0.9 |
2.08 |
1.67 |
Table 3. Roof specifications table – Iraq climate [64-71]
|
No. |
Material Type |
Thickness (mm) |
λ (W/m·K) |
R (m²·K/W) |
Notes |
|
1. |
Light Reflective Ceramic Tiles |
50 |
1.1 |
0.045 |
Light color to reduce heat absorption |
|
2. |
Cement Mortar Protection |
40 |
1.3 |
0.031 |
To protect waterproofing |
|
3. |
Waterproofing (SBS 2 layers) |
6 |
0.17 |
0.035 |
Two-layer SBS membrane (4 mm each layer) |
|
4. |
XPS Thermal Insulation |
80 |
0.030 |
2.67 |
Suitable for Iraq's climate |
|
5. |
Cement Slope Layer (1.5%) |
50 |
1.3 |
0.038 |
Drainage direction |
|
6. |
Reinforced Concrete Slab (30 MPa) |
200 |
1.8 |
0.11 |
Reinforcement according to structural design |
|
7. |
Interior Plastering |
20 |
0.9 |
0.022 |
Interior finishing |
|
|
Total Roof Thickness |
446 mm |
|
|
|
The suggested roof layers for a residential building in Iraq's climate are listed in Table 3, along with the material type and thickness chosen for each layer. In order to assess the roof's total thermal performance, Table 3 also lists the fundamental thermal characteristics of each material, such as thermal resistance (R) and thermal conductivity (λ). All dimensions (139.16 × 37.974 × 0.446 m).
4.3 Design models
4.3.1 Description of the section Halan Stone
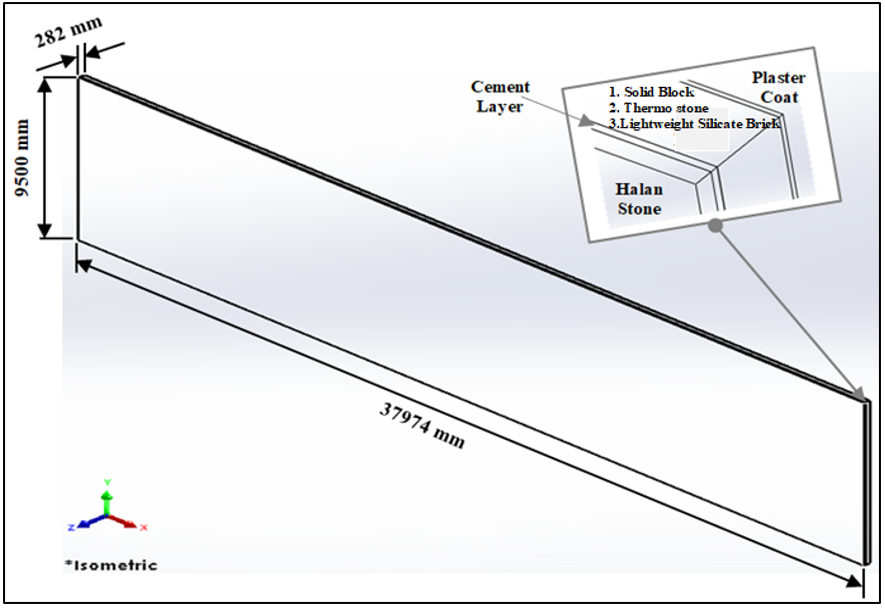
Halan Stone: 50 mm (0.05 m) thick (facing stone, veneer). The thickness of the glazing cement layer is 20 mm (0.02 m). Concrete Block (Wall Body): 200 mm (0.20 m) in thickness The Solid Block and Hollow/Lightweight Block computations are provided. Interior Plaster Coat: 12 mm (0.012 m) thick. The approximate total thickness is = 282 mm (0.282 m). All dimensions (37.974 × 9.5 × 0.282 m) (Figure 1).
Figure 1. The shape, dimensions, and cross-section of the Halan stone walls
4.3.2 Description of the section concrete block
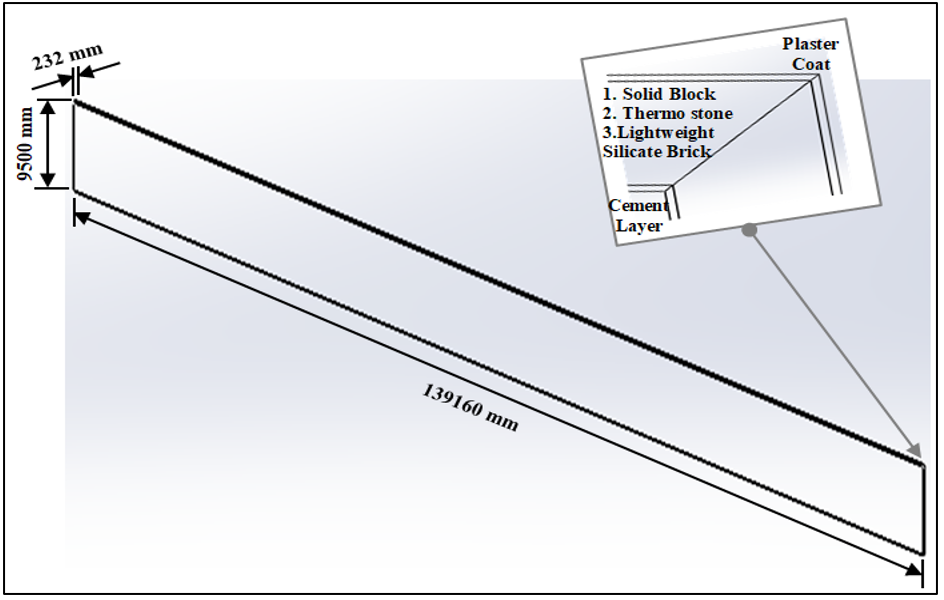
External Cement Render: Finishing and protective coat; thickness: 20 mm (0.02 m). The reinforced concrete block is a load-bearing, rolled wall body with a thickness of 200 mm (0.20 m). Internal Gypsum Skim Coat: Smooth internal finishing coat; thickness: 12 mm (0.012 m). Total wall thickness = 232 mm (0.232 m). All dimensions (139.16 × 9.5 × 0.232 m) (Figure 2).
Figure 2. The description of the section concrete block
4.3.3 Description of the section float glass
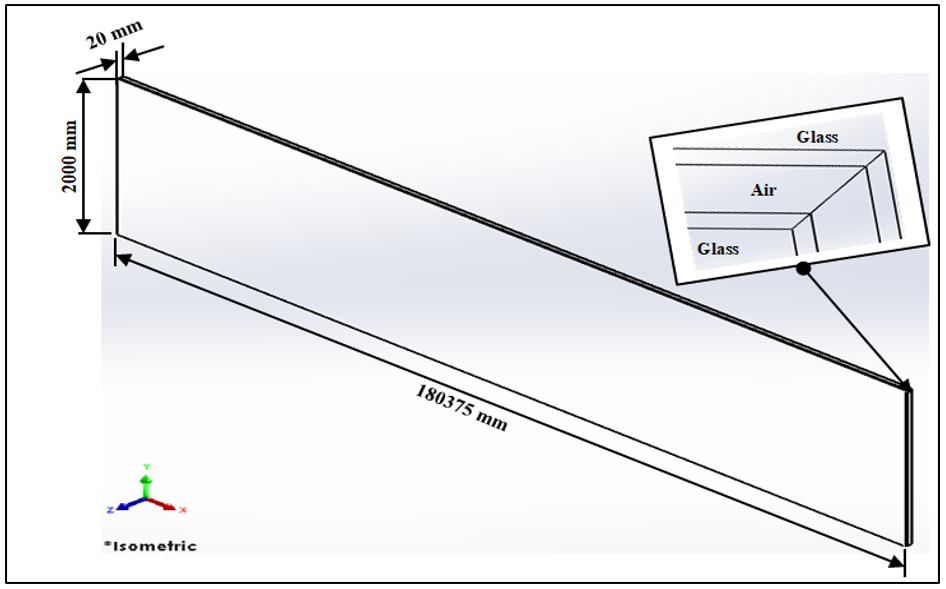
Exterior float glass: Suggested thickness: 3 mm. Air cavity/sealed gap: Suggested width: 14 mm. Interior float glass: Suggested thickness: 3 mm. Total thickness of the glass unit = 20 mm (0.02 m). All dimensions (180.375 × 2 × 0.02 m) (Figure 3).
Figure 3. The description of the section float glass
4.3.4 Description of the roof building
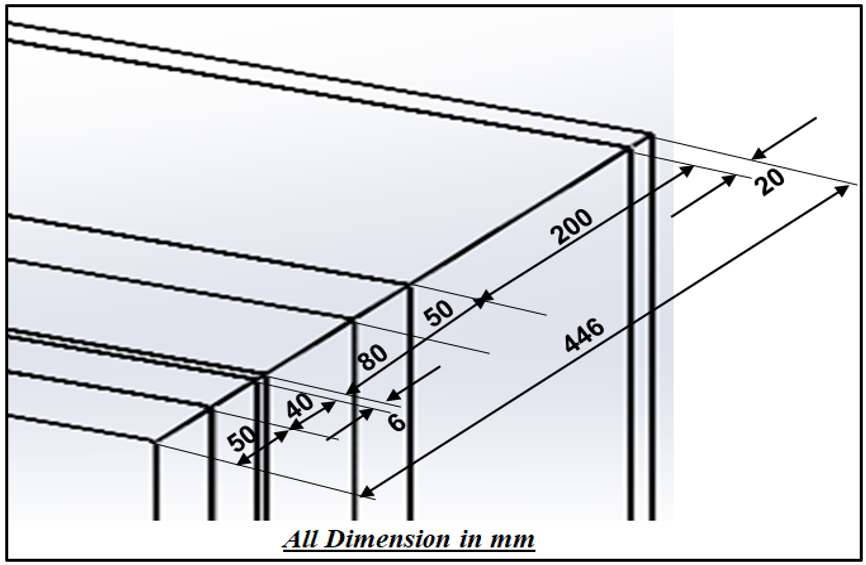
Figure 4 provides a detailed structural explanation of a seven-layer roof system, specifying the materials and thickness of each layer. The roof system has a number of integrated layers designed to provide structural, water, and thermal protection. Starting from the top, there is a 50 mm thick heat-reflective ceramic tile, followed by a 40 mm thick cement mortar layer for protection, then a waterproofing layer composed of two layers of SBS material with a total thickness of 6 mm to prevent water leakage, followed by an 80 mm thick XPS thermal insulation layer to enhance thermal insulation efficiency, then a 50 mm thick cement sloping layer with a 1.015% slope to drain rainwater, followed by a 200 mm thick reinforced concrete slab with a 30 MPa resistance as a primary structural element, and finally a 20 mm thick internal plaster layer for the interior finishing. The roof's overall thickness is therefore 446 mm.
Figure 4. A detailed structural description of a seven-layer roof system including layer materials and thicknesses
4.4 Loads applied
Based on official weather records, Plant Maps (n.d.) reports that the maximum temperature ever recorded in Mosul, Iraq, was about 48.3 ℃ [57]. 800 W/m² is the approximate peak sun irradiation in Mosul at summer noon (used to calculate solar gain through windows). The interior temperature of the building is 24 ℃. "The thermal boundary conditions used in the numerical analysis for Mosul, Iraq, are summarized in Table 4, including temperature, solar radiation, convection, and radiation parameters."
Table 4. Thermal boundary conditions used for numerical analysis of building envelope components in Mosul, Iraq
|
Parameter |
Value / Condition |
Description |
|
Location |
Mosul, Iraq |
Climatic condition |
|
Outdoor air temperature |
45 ℃ |
Maximum summer design temperature |
|
Indoor air temperature |
24 ℃ |
Indoor comfort temperature |
|
Solar irradiation |
800 W/m² |
Applied on external surfaces during peak solar condition |
|
External convection coefficient (ho) |
25 W/m²·K |
Natural/forced convection due to outdoor air and wind effect |
|
Internal convection coefficient (hi) |
8 W/m²·K |
Indoor air convection |
|
Wind speed |
3 m/s |
Typical summer wind condition |
|
Solar load application |
External wall, roof, and glazing surfaces |
Solar heat flux applied on exposed surfaces |
|
Glass absorptivity |
0.30 |
Fraction of solar radiation absorbed by glazing |
|
Glass transmittance |
0.60 |
Fraction of solar radiation transmitted through glazing |
|
Long-wave radiation |
Included |
Surface radiation exchange with surroundings |
|
External surface emissivity |
0.9 |
Thermal radiation property of building materials |
|
Internal surface emissivity |
0.9 |
Indoor radiation exchange condition |
|
Analysis type |
Steady-state heat transfer |
Conduction through wall, roof, and glazing components |
"These boundary conditions were applied consistently for all numerical models representing building envelope components under Mosul summer climate conditions."
5.1 Results of the first model
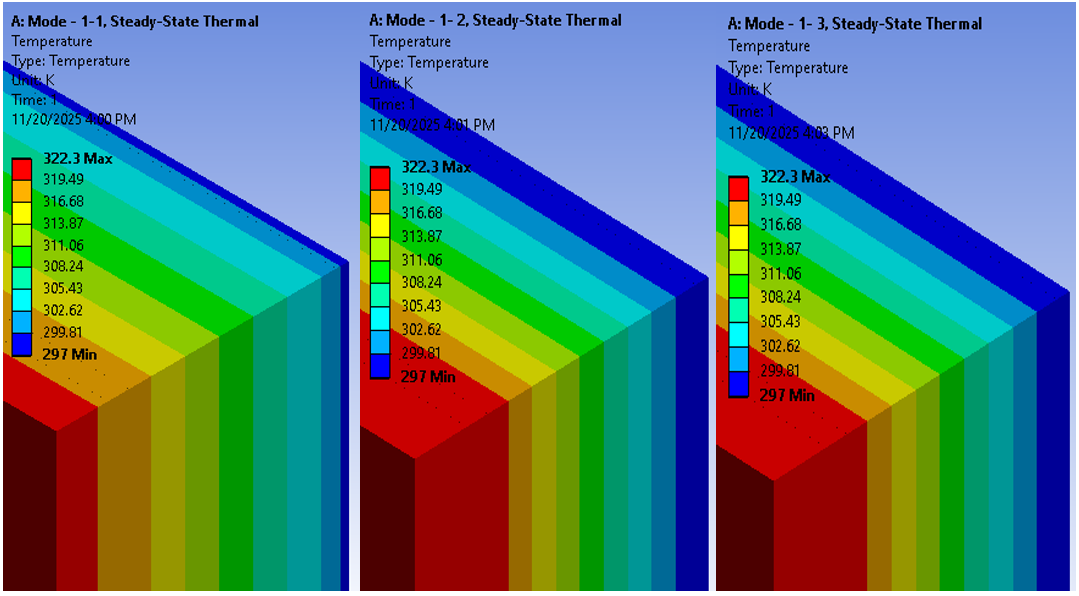
In Figure 5, the first model, the third wall layer was a 20 cm thick solid block with a thermal conductivity of approximately 1.4 W/m·K. The temperature on its inner surface, after the outer surface was exposed to 35 ℃, was approximately 29 ℃. The temperature differences between the layers were minimal due to poor insulation, with the temperature distribution recorded as approximately 35, 32, 30, and 29 ℃ across the four layers.
In the second model, the third layer was replaced with Thermo stone, which has a low thermal conductivity (0.35 W/m·K). Under the same conditions, the outer surface remained at 35 ℃, but the temperature after the third layer dropped significantly to 24 ℃. The temperature distribution recorded was 35, 31, 27, and 24 ℃, demonstrating an improvement in insulation of approximately 25% compared to the first model. The third model, using lightweight silicate brick with a thermal conductivity coefficient of 0.22 W/m·K, exhibited the highest thermal performance, with the internal temperature dropping to only 21 ℃. The results demonstrate that the third design achieved a heat transfer rate exceeding 35% compared to the other designs. The use of materials with relatively low thermal conductivity and lightweight properties contributed to improved thermal insulation and reduced heat transfer. The thermal distribution diagrams show that the average temperature ranged between approximately 28 and 30 ℃, indicating that the thermal insulation properties reduce and improve temperature regulation within the wall, leading to improved overall building thermal performance. This is one of the most important benefits of using materials with good thermal insulation to maintain thermal balance within a building. The average temperature is approximately 27 ℃, which is slightly lower than the average due to higher peak values near the outer surface. The mode represents the most frequent temperature within the range (25–27 ℃), indicating moderate heat diffusion within the wall.
The temperature range reaches approximately 15 ℃ between the highest value at the outer surface and the lowest value at the inner layers, confirming the poor resistance to heat transfer. The standard deviation is relatively high (≈5 ℃), reflecting significant dispersion in the temperature values. The skewness coefficient is positive, indicating a tendency for the data towards higher values due to heat leakage from the outside. Finally, the correlation coefficient shows a strong positive relationship between a high material conductivity and increased heat diffusion within the wall.
Figure 5. Numerical results of temperature distribution in all wall systems
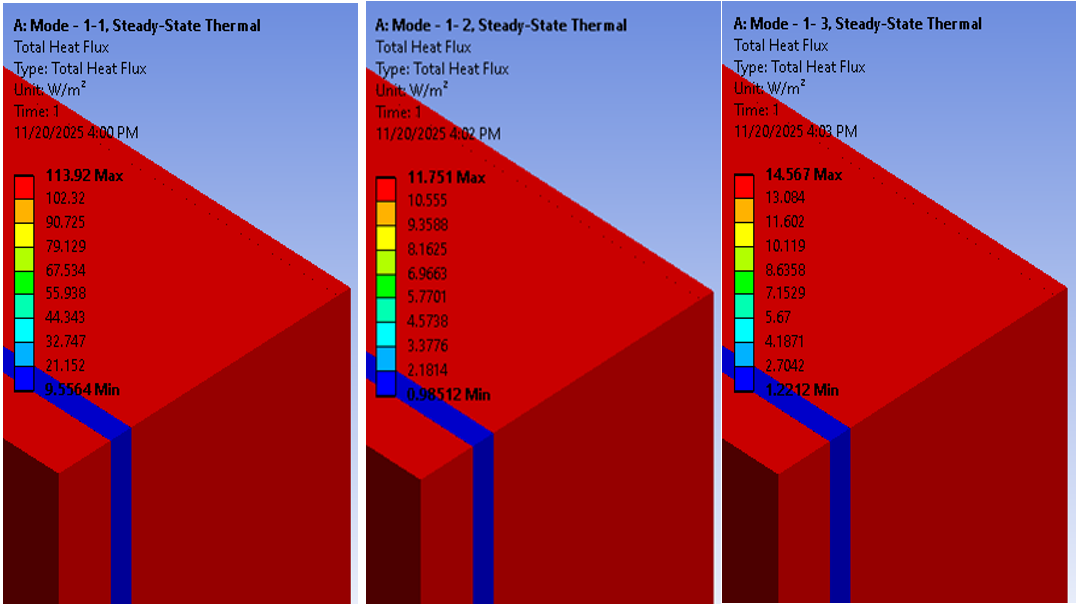
Figure 6. The heat flux results at all walls
In Table 3 and Figure 6, the following is shown: In the first model, which uses solid blocks in the third layer, the maximum heat flux reached 113.92 W/m² and the minimum value was 9.0564 W/m², indicating high heat transfer through the wall due to poor insulation and the high thermal conductivity of the solid blocks. The heat flux distribution was slightly gradual due to the lower resistance to heat transfer.
In the second model, after replacing the third layer with Thermostone, the maximum heat flux decreased to 11.751 W/m² and the minimum value reached 0.9851 W/m², demonstrating a significant improvement in resistance to heat transfer and a reduction in total heat-transfer rate of over 85% compared to the first model. The third model, which used lightweight silicate brick in the third layer, recorded a maximum heat flux of 14.567 W/m² and a minimum of 1.2242 W/m². The results showed that Thermostone exhibited the best thermal insulation properties among the studied models, thanks to its low thermal conductivity and minimal heat flow. Lightweight silicate blocks ranked second, demonstrating good results, while conventional solid blocks showed the weakest performance.
Statistical analysis confirmed that the first model exhibited the greatest thermal fluctuations and poor durability, while Thermostone demonstrated the least variability and high stability in its thermal characteristics. Furthermore, the low conductivity of the material resulted in reduced heat transfer and increased thermal insulation efficiency.
5.2 Results of the second model
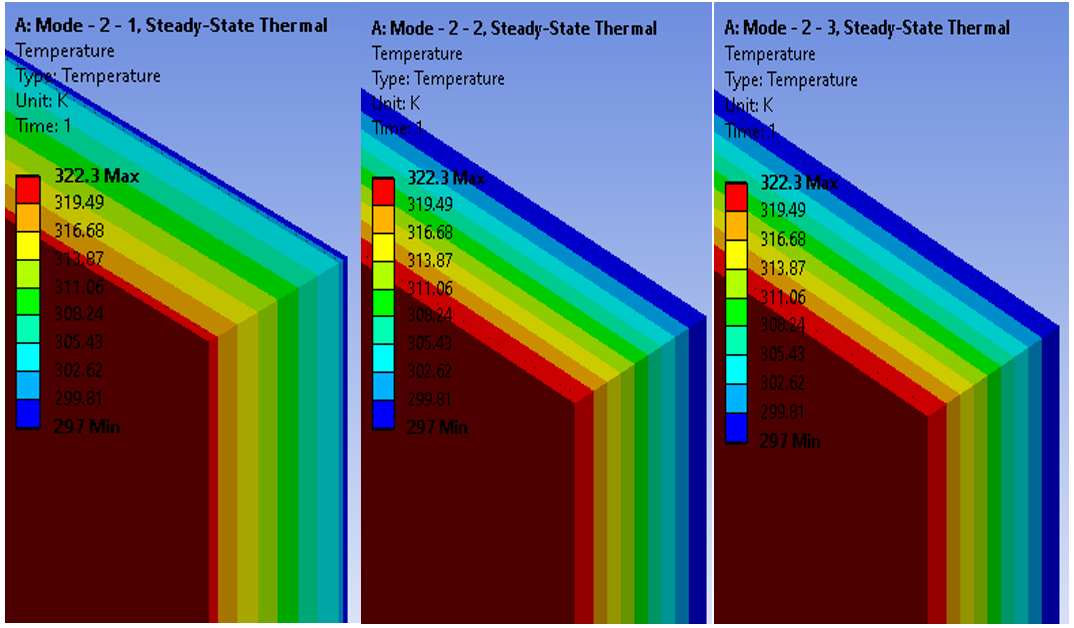
The results obtained from Figure 7, show the heat distribution through the three wall types. The first type exhibited distinct cooling zones, suggesting that its large size is the primary reason for its poor thermal conductivity. The second type showed average performance due to its unique porous properties, which enhance insulation and thus increase thermal insulation. The third type exhibited the most uniform heat distribution, indicating an ideal balance between thermal insulation and heat transfer. All three designs reach a similar maximum temperature of approximately 322.3 ℃, assuming they are subjected to the same thermal stress. The differences in color distribution are attributed to the varying thermal properties of each material. It was observed that the second model, after the first, exhibits very uniform heat transfer, while the first model shows outstanding supportive internal thermal memory, and the second model falls between the two models together.
Figure 7. Numerical temperature distribution results across all wall configurations
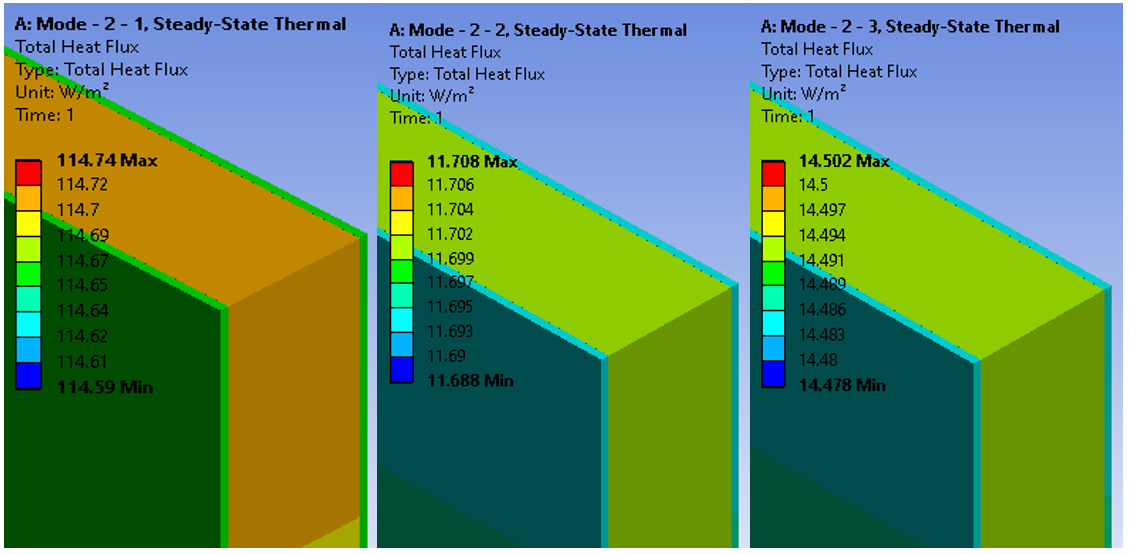
Figure 8 shows a comparison of the total heat that radiates of three obstruction samples under loyal warm sampling environments: a compact block, a Thermostone block, and a thin silicate block. The divergent heat transfer patterns indicate dissimilarities in their heat generation rate and insulation adeptness. The compact block exhibits the best peak heat that radiates at 114.74 W/m², displaying better heat permeability and lower padding adeptness on account of its extreme mass and good heat generation rate. The color lines current toward yellow and a combination of red and yellow, displaying meaningful heat dissipation through the obstruction. The Thermostone block registers a much lower peak heat that radiates of 11.708 W/m², emphasize allure superior padding. The rotating green and sad colors display that heat transfer is restricted apiece block's teased construction, which holds air bubbles that decrease the thermal generated power. The thin silicate block exhibits a peak heat that radiates of 14.502 W/m² above Thermostone but much inferior to the compact bulk, including an equalized thermal accomplishment accompanying good covering and even warm disposal. The color disposal displays smooth heat transfer from the outside related to adequate adeptness in lowering heat deficit. The color slope allocation discloses that the heat way in dependable blocks is direct and rapid, while in Thermostone it is slow and opposing, and in Silicate Block it exhibits moderate and equalized transfer. In addition, Figure 8 indicates that warm permittivity is obviously decreased in lightweight fabrics on account of lower bulk and generated power.
Figure 8. Wall heat flux results
5.3 Results of the third model
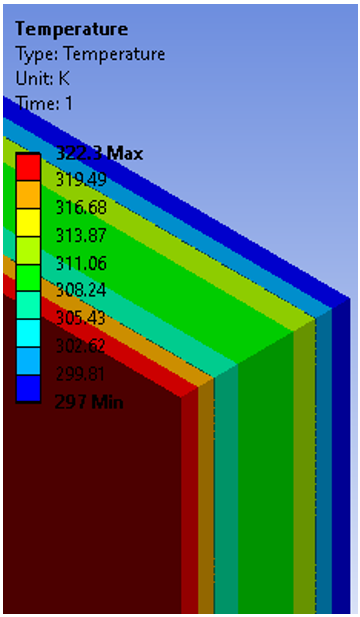
Figure 9 shows the heat allocation through a three-hide obstruction: an outer 3 mm dense mirror plate, understood by a 14 mm dense compressed air sheath. “The glazing cavity was represented as a sealed air gap of 14 mm thickness, assuming no pressurization; hence, the term compressed air layer is not applicable in this model”, and before a central 3 mm dense glass plate. Itemized heat dispersion through the divider: The external face of the glass (3 mm slice) shows the capital hotness in Figure 9, about 322 K, signifying exposure to an abundant heat beginning (cosmic, change of possession, radiation). Inside the jar itself, the hotness drops kind of to about 316–319 K due to the heat generation rate. As the condensed air coating begins (14 mm dense), the hotness remarkably decreases to about 311–313 K. his reduction is greater than that observed in the bottle because air has a low thermal conductivity. Inside this tier, a pale azure-green slope indicates a continuous hotness decline from 311 K to nearly 305–308 K. This domain shows the most solid warm drop, indicating air's insulating possessions that slow heat transfer. Forthcoming the end of the air coating and near trade the central glass, the hotness drops to nearly 300–302 K, signifying that a meaningful portion of the warmth has self-indulgent through the middle tier. As the central cup pane (4 mm) starts to move, the slope shifts repeated to a dark sky hue, and the heat persists to belittle through the jug, arriving the lowest profit written in Figure 9, at 297 K on the central side. The hotness decrease inside the inner mirror is less distinct distinguished to the air tier, consistent accompanying mirror being a greater leader than air but lower than metals. The total difference between the highest level of performance or physical object (322 K) and the hostile point (297 K) is approximately 25 K, indicating the effectiveness of the jug-air-jar composite wall in restricting heat transfer, specifically on account of the compacted air layer.
Figure 9. Numerical temperature field results of all wall models
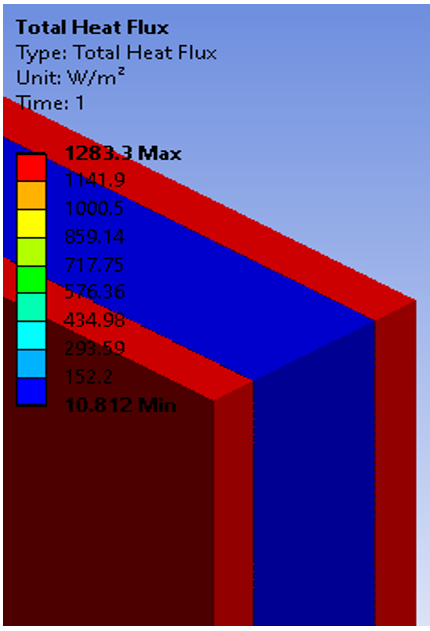
Figure 10 decorates the total heat flow allocation across an obstruction composed of the following three coatings: a 4 mm dense external glass covering, followed by a 16 mm dense shortened air layer, and therefore a 4 mm dense central jug shell. Figure 9 shows that the maximum heat flow, nearly 1283.3 W/m², is reduced on the exposed jug surface. This indicates an extreme level of joint outside heat exchange. As the heat transfer happens inside the outer jug, the alteration evenly decreases to between 1141 and 1000 W/m², reflecting the restricted heat generation rate of the mirror. Upon reaching the concentrated air tier, an important and evident drop in flux happens, accompanying principles dropping to betwixt 859 and 434 W/m². This region performs ignorant, vulgar, and green, professing that the air acts as an effective insulator, considerably restricting heat transfer distinguished to the jar. It is also apparent that the preeminent supporter decrease influx is reduced precisely in this place coating on account of the very depressed thermal generated power of the air. Towards completely of the air coating, the flow drops to even lower levels, arriving at an inferior 300 W/m², reflecting a solid deficit of heat strength before arriving at the inner jar. Inside the central jar, the decrease continues, although less distinct, as far as the heat flow reaches allure lowest advantage noticed in the drawing: 10.8 W/m² clever. This suggests that most of the heat has been thwarted and prevented from escaping inwards. The diagram clearly shows that the distribution of heat flow through the wall is not linear. It decreases sharply within the air layer due to its high insulation, while the transitions are much smoother within the glass layer. This distribution confirms that the composite wall (glass-air-glass) is highly efficient in reducing heat transfer, with the compressed air layer playing the most significant role in reducing the intensity of heat flux entering the building.
Figure 10. Results of heat flux for all walls
5.4 Results of the fourth model
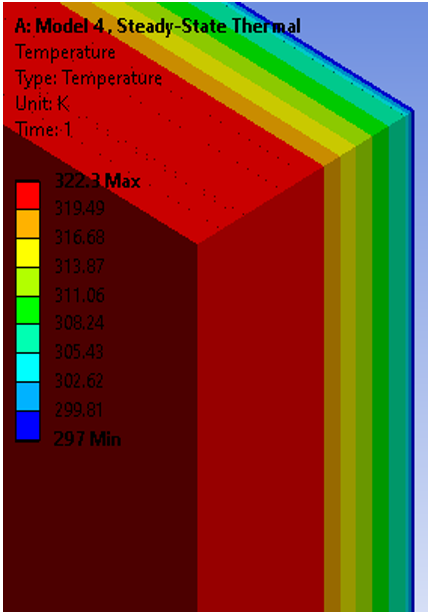
Figure 11 illustrates that, both in a steady state and under a thermal load, the convective surface's maximum temperature reached 322.3 K, then progressively dropped to 297 K at the opposite end, resulting in a 25.3 K temperature differential throughout the 448 mm roof thickness. Starting at about 322.3 K, the first layer (50 mm reflective ceramic tiles) is the most convective. The heat resistance of the 40 mm cement mortar in the second layer causes the temperature to drop to roughly 319.5 K. At the waterproofing layer (8 mm SBS), the temperature drops to about 316.7 K. Because the thermal insulation layer (80 mm XPS) has a lower thermal conductivity, a more noticeable reduction in temperature is seen there, where it falls to about 311–308 K. The temperature then rises to about 305 K in the 50 mm sloping cement layer. Because of the increased thickness and heat conduction through the reinforced concrete slab (200 mm), it progressively drops to about 300 K. Lastly, the temperature at the inner surface of the internal plaster layer (20 mm) drops to a minimum of about 297 K.
Figure 11. Numerical simulation results of temperature distribution across the roof structure using ANSYS
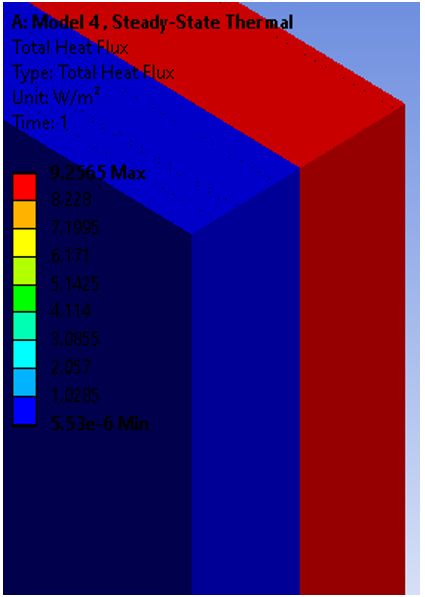
Figure 12. Comprehensive thermal analysis of heat flux in all wall models
In addition to confirming that the thermal insulation layer (XPS) experiences the largest temperature drop, this even and gradual distribution shows that heat transfer through the layers is nearly one-dimensional and that it is effective in minimizing heat transfer and preserving temperature stability in the interior space following thermal loading.
From Figure 12, a peak of 9.2565 W/m² was observed in the total heat flux values at the outermost surface that was immediately exposed to the convection after the convection was applied to the building's roof and the temperature had stabilized. This flux steadily dropped across the layers, settling at the deepest surface with a minimum of 5.53 × 10⁻⁶ W/m². This suggests that the 448 mm roof thickness has a consistent gradient in heat transfer. The heat flow in the external tiers, consisting of 50 mm porcelain slabs and 40 mm cement thick, remained approximately extreme, related to direct trade with the heat source. A step-by-step decrease in flow was noticed as it went through the 8 mm thick airtight tier. Ultimate significant decline happened in the 80 mm dense XPS waterproofing covering, place the force of the flow decreased remarkably on account of the material's lower heat generation rate. The reduction then proceeds through the reinforced concrete slab (200 mm) and the cement screed layer (50 mm) before reaching its lowest value at the inside plaster layer (20 mm). These findings show that the XPS thermal insulation layer is the most important factor in lowering heat flux and preserving stable thermal conditions inside the building, and that the roof is very effective at limiting heat transfer to the interior once it reaches a stable state.
Table 5 uses consistent terminology where heat flux is given as heat-flux density (W/m²), total heat transfer is reported in kW, and thermal resistance in m²·K/W. At 113.92 W/m² and a total flux of 41.097 kW, the Halan Stone had the highest flux density in Model-1. In Model-2, the concrete block recorded 114.74 W/m² and a greater total flux of 151.686 kW because of its enormous area (1322.02 m²).
With a total flux of 462.95 kW and the maximum heat flux density of 1283.3 W/m², Model-3 demonstrated exceptionally strong heat transfer through the glass. The Model-4 building's roof, on the other hand, had the lowest heat flux density of 9.2565 W/m² and a total flux of 7.788 kW while having an area of 841.39 m², indicating the effectiveness of the roof insulation system.
Table 5. The heat flux results for all walls
|
Parts |
Area (m2) |
Heat Flux Density (W/m2) |
Total Heat-Transfer Rate (KW) |
||
|
Model -1 |
1 |
Halan Stone |
360.753 |
113.92 |
41.097 |
|
2 |
Thermo Stone |
11.751 |
4.239 |
||
|
3 |
Lightweight Silicate Brick |
14.567 |
5.255 |
||
|
Model -2 |
1 |
Concrete Block |
1322.02 |
114.74 |
151.686 |
|
2 |
Thermo Stone |
11.708 |
15.478 |
||
|
3 |
Lightweight Silicate Brick |
14.502 |
19.172 |
||
|
Model -3 |
Glass Wall |
360.75 |
1283.3 |
462.95 |
|
|
Model -4 |
Building Roof |
841.39 |
9.2565 |
7.788 |
|
The statistical indicators (Mean, Standard Deviation, Mode, Skewness, And Correlation Coefficient) were calculated based on the nodal results extracted from ANSYS. A total of 65408 nodal points and 8911 elements were used for each model. The variables considered were temperature and heat flux distributions across the wall domain.
The average temperature of lightweight silicate bricks was ≈30 ℃ with a standard deviation of ≈5 ℃, and they achieved a reduction in internal temperature of more than 35%. The correlation coefficient between conductivity and temperature rise was R ≈ 0.85.
The following inferences can be made from the development of five Solid Works models, the application of thermal loads using ANSYS, and the subsequent assessment of the outcomes:
This study recommends the following future research projects that serve and complement this topic:
[1] Yuan, T., Zhu, N., Shi, Y., Chang, C., Yang, K., Ding, Y. (2018). Sample data selection method for improving the prediction accuracy of the heating energy consumption. Energy and Buildings, 158: 234-243. https://doi.org/10.1016/j.enbuild.2017.10.006
[2] Najaf Khosravi, S., Mahdavi, A. (2021). A CFD-based parametric thermal performance analysis of supply air ventilated windows. Energies, 14(9): 2420. https://doi.org/10.3390/en14092420
[3] Yu, J., Leng, K., Wang, F., Ye, H., Luo, Y. (2020). Simulation study on dynamic thermal performance of a new ventilated roof with form-stable PCM in Southern China. Sustainability, 12(22): 9315. https://doi.org/10.3390/su12229315
[4] Othayq, M.M. (2025). CFD investigation on the thermal comfort for an office room. Buildings, 15(15): 2802. https://doi.org/10.3390/buildings15152802
[5] Shan, X., Luo, N., Sun, K., Hong, T., Lee, Y.K., Lu, W.Z. (2020). Coupling CFD and building energy modelling to optimize the operation of a large open office space for occupant comfort. Sustainable Cities and Society, 60: 102257. https://doi.org/10.1016/j.scs.2020.102257
[6] Şahin, Y. (2019). Numerical analysis of thermal performance of triple-glazed windows using ANSYS Fluent. İzmir Institute of Technology.
[7] Mouneer, T.A., Aly, M.H., Mina, E.M. (2022). Experimental investigation and CFD modelling for indoor air thermal conditions in worship buildings in Egypt: Church and Masjid. Engineering Research Journal, 175: 398-341. https://doi.org/10.21608/erj.2022.260163
[8] Mirković, M., Petojević, Z., Gospavić, R., Todorović, G. (2016). CFD simulation of thermal performances of building structure with expanded polystyrene (EPS) as thermal insulation. In Proceedings of 3rd International Conference on Electrical, Electronic and Computing Engineering ICETRAN 2016, Zlatibor, Serbia.
[9] Akeiber, H.J. (2025). Computational fluid dynamics modeling of air conditioning systems for energy-efficient buildings. Al-Rafidain Journal of Engineering Sciences, 3(1): 474-504. https://doi.org/10.61268/v3bw9g08
[10] Ansari, I., Suman, A.S. (2022). CFD simulation of HVAC system in a building using ANSYS-Fluent. SMART MOVES Journal IJOSCIENCE, 8(7): 1-7. https://www.researchgate.net/publication/362541011_CFD_Simulation_of_HVAC_System_in_a_Building_using_ANSYS_-_Fluent.
[11] Ahmad, A.H., Abu Bakar, A.F., Osman, S.A. (2025). CFD analysis of thermal conditions and airflow patterns in commercial laundry facility using ANSYS fluent simulation. Journal of Advanced Research in Fluid Mechanics and Thermal Sciences, 126(2): 106-126. https://doi.org/10.37934/arfmts.126.2.106126
[12] Moradi, A., Kavgic, M., Costanzo, V., Evola, G. (2023). Impact of typical and actual weather years on the energy simulation of buildings with different construction features and under different climates. Energy, 270: 126875. https://doi.org/10.1016/j.energy.2023.126875
[13] Lucchino, E.C., Gennaro, G., Favoino, F., Goia, F. (2022). Modelling and validation of a single-storey flexible double-skin façade system with a building energy simulation tool. Building and Environment, 226: 109704. https://doi.org/10.1016/j.buildenv.2022.109704
[14] Bruno, R., Bevilacqua, P. (2022). Heat and mass transfer for the U-value assessment of opaque walls in the Mediterranean climate: Energy implications. Energy, 261: 124894. https://doi.org/10.1016/j.energy.2022.124894
[15] Midhat, Y.F., Aljubury, I.M.A. (2023). Numerical simulation of the thermal performance of a tubular solar air heater. Journal of Engineering, 29(11): 143-166. https://doi.org/10.31026/j.eng.2023.11.09
[16] Shan, X., Xu, W., Lee, Y.K., Lu, W.Z. (2019). Evaluation of thermal environment by coupling CFD analysis and wireless-sensor measurements of a full-scale room with cooling system. Sustainable Cities and Society, 45: 395-405. https://doi.org/10.1016/j.scs.2018.12.011
[17] Domínguez-Torres, C.A., Suárez, R., León-Rodríguez, A.L., Domínguez-Delgado, A. (2024). Parametric energy optimization of a ventilated facade with windows in Mediterranean climates. Renewable Energy, 227: 120398. https://doi.org/10.1016/j.renene.2024.120398
[18] Iavorschi, E., Milici, L.D., Atănăsoae, P., Ungureanu, C. (2025). An experimental and numerical investigation of a passive façade and proposals for improving its energy performance. Energies, 18(2): 359. https://doi.org/10.3390/en18020359
[19] Cojocaru, A., Isoperscu, D.N., Maxineasa, S.G., Petre, S.G. (2022). Characteristics of ventilated façades and façade anchors for passive house buildings. Bulletin of the Polytechnic Institute of Iaşi, 68(4): 21-31. https://doi.org/10.2478/bipca-2022-0028
[20] Gautam, R.K., Agarwal, N. (2022). Optimizing thermal comfort for office room using CFD analysis. In Technology Innovation in Mechanical Engineering: Select Proceedings of TIME 2021, Singapore, pp. 727-743. https://doi.org/10.1007/978-981-16-7909-4_67
[21] Tang, M., Rogaume, T., Batiot, B., Bensabath, T., Bourbigot, S. (2024). Reduced scale test bench for investigating the upward flame heat impact on external thermal insulation composite system facades. Journal of Fire Sciences, 42(6): 514-533. https://doi.org/10.1177/07349041241259989
[22] Kumar, S., Kanchwala, H., Furquan, M. (2024). Evaluation of insulation effectiveness for thermal comfort in summers: Experimental and CFD numerical study. Journal of Building Performance Simulation, 17(6): 718-741. https://doi.org/10.1080/19401493.2024.2401919
[23] Palka Bayard de Volo, E., Pulvirenti, B., Jahanbin, A., Guidorzi, P., Semprini, G. (2023). Numerical analysis on the optimisation of thermal comfort levels in an office located inside a historical building. Applied Sciences, 13(5): 2954. https://doi.org/10.3390/app13052954
[24] Şanlı, A., Tan, H., Demircan, T. (2025). CFD analysis of the effects of blowing nozzle geometry and angles on air distribution and thermal comfort in wall-type air conditioning systems. Proceedings of the Institution of Mechanical Engineers, Part C: Journal of Mechanical Engineering Science, 240(14): 09544062261436112. https://doi.org/10.1177/09544062261436112
[25] Zhao, G., Yang, J., Li, Z., Zhao, J. (2026). CFD-based optimization of air conditioning airflow organization and thermal environment of atrium–corridor spaces in an office building. Buildings, 16(9): 1817. https://doi.org/10.3390/buildings16091817
[26] Guo, H., He, K., Xu, Y., Lei, Y. (2026). A co-simulation methodology for integrating data-driven thermal sensation models with building energy control. Energy and Buildings, 353: 116745. https://doi.org/10.1016/j.enbuild.2025.116745
[27] Wang, R., Ma, Y., Jiang, H., Li, B., Lu, S. (2026). An integrated evaluation method for multiple flexible regulation strategies of air conditioning load accounting for demand response costs. Building Simulation, 19: 789-808. https://doi.org/10.1007/s12273-026-1408-1
[28] Zhang, T., Kitagawa, H., Asawa, T., Trihamdani, A.R. (2026). Quasi-dynamic coupling method between CFD and building energy simulations for studying PCM-based radiant floor cooling systems. Building and Environment, 292: 114280. https://doi.org/10.1016/j.buildenv.2026.114280
[29] Li, J., Wang, Y., Zhai, Z., Ding, Y. (2026). Reconstructed 3D temperature field of microclimate by deep neural network (DNN) based on high-fidelity numerical simulation. Indoor and Built Environment, 35(5): 631-647. https://doi.org/10.1177/1420326X261418727
[30] Miao, Y., Huang, C., Zhu, J., Yang, T., Zou, Z., Wang, F. (2026). Prediction of thermal environment and stratified air-conditioning load in existing large spaces based on unsteady-state Block-Gebhart model. Building and Environment, 291: 114267. https://doi.org/10.1016/j.buildenv.2026.114267
[31] Zhao, T., Wang, H., Wu, Y., Gao, W., Guo, Y., Su, Y. (2026). Cooperative control strategy for local and overall thermal environment: Optimizing thermal comfort and energy efficiency in offices. Building and Environment, 299: 114669. https://doi.org/10.1016/j.buildenv.2026.114669
[32] Liu, J.Y. (2026). A GAN-physical simulation coupled framework for joint optimization of building energy prediction and spatial configuration. Scientific Reports, 16: 17286. https://doi.org/10.1038/s41598-026-48460-z
[33] Liu, W., Zhang, X., Weerasuriya, A.U. (2026). A CFD-CONTAM-BES framework incorporates wind pressure, air temperature, and indoor air circulation to estimate energy consumption of high-rise buildings. Sustainable Cities and Society, 147: 107514. https://doi.org/10.1016/j.scs.2026.107514
[34] Kim, J., Park, S., Song, D. (2026). Effects of building thermal performance and HVAC control on indoor comfort and energy use. Case Studies in Thermal Engineering, 79: 107763. https://doi.org/10.1016/j.csite.2026.107763
[35] Kwame, A.B., Troy, N.V., Hamidreza, N. (2020). A multi-facet retrofit approach to improve energy efficiency of existing class of single-family residential buildings in hot-humid climate zones. Energies, 13(5): 1178. https://doi.org/10.3390/en13051178
[36] Kim, J., Hong, T., Jeong, K., Lee, M. (2020). Empirical validation of building energy modeling for multi-zones commercial buildings in cooling season. Applied Energy, 261, 114374. https://doi.org/10.1016/j.apenergy.2019.114374
[37] Chen, L., Zheng, Y., Yu, J., Peng, Y., Li, R., Han, S. (2024). A GIS-based approach for urban building energy modeling under climate change with high spatial and temporal resolution. Energies, 17(17): 4313. https://doi.org/10.3390/en17174313
[38] Coohom. (2024). Thickness of stone wall: Practical guide for home designers. https://www.coohom.com/article/thickness-of-stone-wall-practical-guide-for-home-designers.
[39] DFL Stones. (2024). Stone wall cladding: How thick is stone cladding? https://www.dfl-stones.com/th/news/stone-wall-cladding-how-thick-is-stone-cladding.html.
[40] Li, M., Zhao, P., Gao, S. (2024). Thermal performance analysis and optimization design of building exterior wall insulation layers. International Journal of Heat & Technology, 42(1): 50-60. https://doi.org/10.18280/ijht.420106
[41] Zhang, C., Qiu, J., Guan, X., Hou, P., Huang, W. (2018). Research on thermal performance of external thermal insulation composite concrete wall block. International Journal of Heat and Technology, 36(1): 277-281. https://doi.org/10.18280/ijht.360137
[42] Olymp. (2023). Architectural wall constructions: Stone wall systems and structural requirements. https://olymp.in/en/news/steny-arkhitekturnye-konstruktsii/111.
[43] Pestre, T., Antczak, E., Brachelet, F., Pallix, D. (2022). Multiphysical characteristics of limestones for energy-efficient and sustainable buildings components. Journal of Materials in Civil Engineering, 34(4): 04022024. https://doi.org/10.1061/(ASCE)MT.1943-5533.0004158
[44] Wang, L., Aslani, F., Mukherjee, A. (2022). Development of 3D printable self-sensing cementitious composites. Construction and Building materials, 337: 127601. https://doi.org/10.1016/j.conbuildmat.2022.127601
[45] AlQdah, K.S. (2021). Effect of using natural and local environment contents on the thermal conductivity of building materials; case in Medina, Saudi Arabia. Case Studies in Thermal Engineering, 28: 101597. https://doi.org/10.1016/j.csite.2021.101597
[46] Reyna-Ruiz, C., Gómez-Soberón, J.M., Rojas-Valencia, M.N. (2025). Characterization of physical, mechanical, and thermal properties of stabilized blocks. Buildings, 15(16): 2891. https://doi.org/10.3390/buildings15162891
[47] Najm, W.M., Shareef, Z.Q., Yahya, I.Z.A., Khalaf, K.D., Ali, Y.H., Karash, E.T. (2026). Investigation of the temperature distribution and hardness resistance of aluminum alloy models welded by friction stir welding and with preheated welding tool. International Journal of Heat & Technology, 44(2): 679-689. https://doi.org/10.18280/ijht.440221
[48] Hamadalla, M.W., Jumaah, O.M., Mohamed, S.J., Karash, E.T., Khaleel, M.H. (2023). Enhanced performance of vapor compression air conditioners using TiO₂ nanoparticle-oil additives. International Journal of Heat and Technology, 41(6): 1554-1560. https://doi.org/10.18280/ijht.410617
[49] Parcesepe, E., De Masi, R.F., Lima, C., Mauro, G.M., Pecce, M.R., Maddaloni, G. (2021). Assessment of mechanical and thermal properties of hemp-lime mortar. Materials, 14(4): 882. https://doi.org/10.3390/ma14040882
[50] Meliță, L., Calotă, R., Amăreanu, M. (2024). Silica aerogel-incorporated cement and lime plasters for building insulation: An experimental study. Buildings, 14(8): 2300. https://doi.org/10.3390/buildings14082300
[51] Vidales-Barriguete, A., Barreira, E., Gomes Dias, S. (2024). Assessment of the thermal properties of gypsum plaster with plastic waste aggregates. Materials, 17(7): 1663. https://doi.org/10.3390/ma17071663
[52] Rahnavard, R., Jordão, S. (2026). Structural behaviour of laminated glass beams: Standard vs prestressed. ce/papers, 9(1): 161-170. https://doi.org/10.1002/cepa.70264
[53] Ashby, M.F., Johnson, K. (2023). Materials and Design: The Art and Science of Material Selection in Product Design (4th ed.). Butterworth-Heinemann.
[54] Lee, J.S., Lee, S. (2025). Assessing urban solar glare from glass curtain walls: Effects of street orientation and building form on sustainable design and public safety. Sustainable Cities and Society, 135: 106984. https://doi.org/10.1016/j.scs.2025.106984
[55] Haidar, G., Kravchenko, I., Ferrantelli, A. (2026). Optimizing the thermal performance of double skin Façades in a cold climate with phase change materials and cavity ventilation. Energy and Buildings, 358: 117248. https://doi.org/10.1016/j.enbuild.2026.117248
[56] Arasteh, H., Maref, W., Saber, H.H. (2026). Computational fluid dynamics analysis of energy and optical performance in fenestration systems incorporating solid-solid phase change materials. Journal of Energy Storage, 142: 119563. https://doi.org/10.1016/j.est.2025.119563
[57] Zhang, X., Su, L., Jiang, J., Zhang, S., Huan, C., Ai, Z. (2026). Cooling effect of dynamic airflow with coordinated supply air velocity and temperature. Building and Environment, 288: 113945. https://doi.org/10.1016/j.buildenv.2025.113945
[58] Viskadourakis, Z., Angelopoulos, P.M., Orfanou, M., et al. (2025). Low thermal conductivity plaster–perlite microsphere composites as potential thermal insulation materials in building construction. International Journal of Thermophysics, 46(7): 101. https://doi.org/10.1007/s10765-025-03572-y
[59] Ulusu, İ., Kurnuç Seyhan, A. (2023). Effect of expanded perlite aggregate plaster on performance under high temperatures. Buildings, 13(2): 384. https://doi.org/10.3390/buildings13020384
[60] Neto, R.E.O., de Oliveira, D.R., de Araújo, R.V., de Souza, G.F. (2021). Durability behavior of mortars containing perlite tailings. Sustainability, 13(16): 9203. https://doi.org/10.3390/su13169203
[61] Alexa-Stratulat, S.M., Taranu, G., Toma, A.M., et al. (2024). Effect of expanded perlite aggregates and temperature on the strength and dynamic elastic properties of cement mortar. Construction and Building Materials, 438: 137229. https://doi.org/10.1016/j.conbuildmat.2024.137229
[62] Cojocaru, A., Isopescu, D.N., Maxineasa, S.G. (2023). Perlite concrete: A review. IOP Conference Series: Materials Science and Engineering, 1283(1): 012003. https://doi.org/10.1088/1757-899X/1283/1/012003
[63] Burgos, L.R. (2020). Mechanical characterization of Raw-Perlite Solid Bricks for use in construction. Revista de la Construcción, 19(1): 170-179. https://doi.org/10.7764/rdlc.19.1.170-179
[64] Jeong, Y.S. (2014). Experimental study on the thermal conductivity of thermal insulation materials used in residential buildings. Advanced Materials Research, 1025: 535-538. https://doi.org/10.4028/www.scientific.net/AMR.1025-1026.535
[65] Shear, N., Litt, N. (2012). Typical Thermal Conductivity of Building Materials. In Spon's Mechanical and Electrical Services Price Book 2013, pp. 813-813. https://www.taylorfrancis.com/.
[66] Salih, S.A., Khalil, W.I., Ali, A.A. (2014). Development insulation performance of concrete masonry units. Tikrit Journal of Engineering Sciences, 21(2): 52-61.
[67] Athukorala, N., Jayasinghe, M.T.R., Shea, A. (2025). Thermal characteristics of commercially manufactured expanded polystyrene composite lightweight concrete. Next Materials, 8: 100854. https://doi.org/10.1016/j.nxmate.2025.100854
[68] Liu, M., Gou, Z. (2026). Real-time occupant-centric HVAC optimization via fast deep-learning field prediction. Building and Environment, 293: 114313. https://doi.org/10.1016/j.buildenv.2026.114313
[69] Mahlia, T.M.I., Taufiq, B.N., Masjuki, H.H. (2007). Correlation between thermal conductivity and the thickness of selected insulation materials for building wall. Energy and Buildings, 39(2): 182-187. https://doi.org/10.1016/j.enbuild.2006.06.002
[70] Anand, J., Sailor, D.J., Baniassadi, A. (2021). The relative role of solar reflectance and thermal emittance for passive daytime radiative cooling technologies applied to rooftops. Sustainable Cities and Society, 65: 102612. https://doi.org/10.1016/j.scs.2020.102612
[71] Halwatura, R.U., Jayasinghe, M.T.R. (2008). Thermal performance of insulated roof slabs in tropical climates. Energy and Buildings, 40(7): 1153-1160. https://doi.org/10.1016/j.enbuild.2007.10.006