Dewa Ayu Anom Yuarini*![]() | Putu Perdana Kusuma Wiguna
| Putu Perdana Kusuma Wiguna![]() | Gede Mekse Korri Arisena
| Gede Mekse Korri Arisena![]() | I Gede Arie Mahendra Putra
| I Gede Arie Mahendra Putra![]() | Nur Ainun Harlin Jennie Pulungan
| Nur Ainun Harlin Jennie Pulungan![]()
© 2026 The authors. This article is published by IIETA and is licensed under the CC BY 4.0 license (http://creativecommons.org/licenses/by/4.0/).
OPEN ACCESS
Used cooking oil (UCO) is a household waste that poses environmental risks when improperly disposed of, yet offers potential as a renewable feedstock for biodiesel production. This study aims to quantify current and projected household-generated UCO in North Denpasar District, estimate biodiesel (B100) potential, and analyze its village-level spatial distribution using Geographic Information Systems (GIS). A household survey of 357 respondents was conducted across 11 villages, determined using Slovin’s formula and purposive sampling, from which annual UCO generation per household was derived. Population growth was projected using a geometric model with an annual growth rate of 1.25%. Spatial analysis and mapping were performed using GIS, while spatial autocorrelation was examined using Moran’s I, Local Indicators of Spatial Association (LISA), and Getis–Ord Gi* hotspot analysis. The results show that household UCO production in 2025 reached 233,015 L/year, varying from 8,949 L/year to 46,038 L/year across villages. Total UCO availability is projected to increase by 13.2% to 263,838 L/year by 2035, corresponding to a biodiesel potential of 211,070 L/year. Global Moran’s I (-0.146) indicates weak spatial autocorrelation, with LISA and Gi* analyses identifying only one statistically significant localized cluster (p ≤ 0.05). This study provides the first village-level spatial database and ten-year projection of household UCO potential in North Denpasar, offering a practical basis for targeted waste-to-energy planning and urban biodiesel initiatives.
biodiesel B100, household used cooking oil, waste-to-energy, GIS mapping, Denpasar, circular economy, projection
Energy demand in developing countries continues to increase in line with industrial expansion and population growth, intensifying the need for alternative and renewable energy sources. In Indonesia, the National Industrial Development Master Plan (RIPIN) 2015–2035 identifies the industrial sector as a key driver of national economic growth, thereby requiring a reliable and sustainable energy supply. One of the most promising alternatives is biodiesel, which offers several advantages over fossil fuels, including lower emissions, higher cetane numbers, improved combustion efficiency, and biodegradability, making it an environmentally friendly renewable energy source [1].
Among various biodiesel feedstocks, used cooking oil (UCO), also known as waste frying oil, represents a readily available and low-cost raw material, particularly from household cooking activities. Its utilization contributes not only to national energy security but also to environmental protection by reducing pollution caused by improper disposal. When discharged into drainage systems and waterways, UCO increases chemical oxygen demand (COD) and biological oxygen demand (BOD), disrupts aquatic ecosystems, and degrades soil structure by obstructing water infiltration [2, 3]. Consequently, the conversion of UCO into biodiesel offers combined environmental and economic benefits. Recent studies, however, emphasize that despite its advantages, UCO valorization faces multiple challenges related to feedstock quality variability, decentralized generation, and inefficient collection systems, particularly in urban areas of developing countries [4, 5].
Unlike UCO generated by restaurants and food service establishments, household-derived UCO exhibits distinct characteristics that complicate its recovery and utilization. Household UCO is typically produced in small quantities per unit, spatially dispersed across residential areas, and stored under varying conditions that affect its quality and suitability for biodiesel production [5, 6]. These characteristics result in higher transaction and collection costs and require spatially informed planning approaches to design efficient recovery systems at the urban scale [5].
Denpasar City, the capital of Bali Province, is a significant contributor to UCO generation due to its high population density and intensive domestic cooking activities. A study conducted by Universitas Udayana reported that approximately 98% of households in Denpasar generate waste cooking oil, with an average cooking oil consumption of 10.74 L per week and a conversion rate of 39.2% into waste oil [7]. This translates into an estimated potential of approximately 293,192 L of UCO per month at the city scale. Without adequate collection and management systems, such volumes pose substantial environmental risks; conversely, they also represent a considerable opportunity for household-based biodiesel production. Similar urban case studies in developing countries have demonstrated that household UCO can form a viable renewable energy feedstock when supported by appropriate spatial planning and policy interventions [6, 8].
North Denpasar District constitutes one of the key urban zones in Denpasar, characterized by relatively high population density and household activity, suggesting a substantial potential for UCO generation. Nevertheless, detailed quantitative information on the availability of household-derived UCO in this district remains limited, particularly with respect to its spatial distribution and long-term dynamics. Existing studies tend to focus on aggregate quantity estimation, while high-resolution spatial mapping, long-term projections, and the integration of Geographic Information Systems (GIS) to support the planning of practical UCO collection and logistics systems remain insufficiently explored [8, 9]. Accurate, spatially explicit data are therefore critical to support renewable energy planning and urban waste management policies.
Accordingly, this study aims to: (1) analyze the potential volume of household-generated UCO in North Denpasar District over the next ten years; (2) estimate the potential yield of biodiesel (B100); and (3) map the spatial development of biodiesel potential using GIS. The findings are expected to support local government strategies for waste-to-energy initiatives, enhance household-level environmental awareness, and contribute to sustainable energy planning in Bali through the application of circular economy principles [10].
2.1 Study area
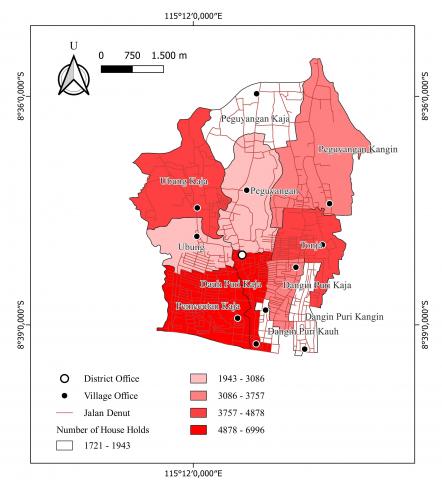
This research was conducted in the North Denpasar District, Denpasar City, Bali Province, Indonesia. Geographically, North Denpasar borders Abiansemal and Mengwi sub-districts of Badung Regency to the north, East Denpasar to the east, West Denpasar to the west, and central Denpasar to the south. North Denpasar District covers 31.42 km² (3.142 ha) and consists of 11 administrative villages: Ubung, Ubung Kaja, Peguyangan, Peguyangan Kaja, Peguyangan Kangin, Dauh Puri Kaja, Dangin Puri Kaja, Dangin Puri Kauh, Dangin Puri Kangin, Tonja, and Pemecutan Kaja [11].
According to the Statistics Bureau of North Denpasar [11], the district’s population reached 85.043 people, with an average density of 5.411 inhabitants km⁻² and an annual growth rate of 1.25%. The spatial extent of the study area is presented in Figure 1.
Figure 1. Study area map in the North Denpasar District
2.2 Instrument and materials
The research utilized a combination of field instruments, spatial datasets, and computational tools to support data collection and analysis. A Global Positioning System (GPS) device was employed to determine the geographic coordinates of sampled households and to record spatial reference points across the study area. Field documentation, including photographs and short video clips, was conducted using a digital camera through the Open Camera mobile application. A personal computer (PC) was used for data entry, statistical tabulation, spatial analysis, and preparation of maps and figures, while a printer was used for producing hard copies of maps and reports.
Spatial and base data were derived from several sources. A topographic base map of Denpasar City with a scale of 1:25,000 obtained from the Geospatial Information Agency (BIG) served as the administrative and spatial reference. In addition, high-resolution QuickBird satellite imagery (0.6 m spatial resolution, recorded in 2024) obtained from Google Satellite was used to delineate village boundaries and validate field locations. These instruments and data sources collectively supported accurate spatial representation and analytical processing in the study.
2.3 Data collection and sampling
Primary data were obtained through a household survey to estimate the average generation of UCO per household. The total number of households (N) in North Denpasar District in 2025 was 39,752, based on official population statistics. The minimum sample size was calculated using Slovin’s formula with a margin of error (e) of 5%. The Slovin’s formula ensures quick and effective sample size computation for survey-based studies [12]. The Slovin’s formula analysis resulted in a required sample size of approximately 396 households. Due to field constraints, a total of 357 households were successfully surveyed, which remains statistically acceptable for regional-level estimation.
The 357 household samples were distributed proportionally across the 11 villages in North Denpasar District based on the number of households in each village, ensuring adequate representation of spatial and demographic variability within the study area. The Slovin formula given in Eq. (1) [12, 13]. Table 1 shows the sampling design. Figure 2 shows the distribution of households per village in North Denpasar District.
$n=\frac{N}{\left(1+N \cdot e^2\right)}$ (1)
where, n is the number of samples, N is the total household population, and e is the allowable error (0.05).
Table 1. The sampling design
|
No. |
Village |
Households (HH) |
Proportion (%) |
Samples (nᵢ) |
|
1 |
Ubung |
2,318 |
5.83 |
21 |
|
2 |
Ubung Kaja |
4,878 |
12.27 |
44 |
|
3 |
Peguyangan |
3,086 |
7.76 |
28 |
|
4 |
Peguyangan Kangin |
3,757 |
9.45 |
34 |
|
5 |
Peguyangan Kaja |
1,943 |
4.89 |
17 |
|
6 |
Dauh Puri Kaja |
5,269 |
13.26 |
47 |
|
7 |
Dangin Puri Kaja |
3,750 |
9.43 |
34 |
|
8 |
Dangin Puri Kauh |
1,721 |
4.33 |
15 |
|
9 |
Dangin Puri Kangin |
1,940 |
4.88 |
17 |
|
10 |
Tonja |
4,094 |
10.30 |
37 |
|
11 |
Pemecutan Kaja |
6,996 |
17.60 |
63 |
|
Total |
39,752 |
100 |
357 |
Figure 2. The household’s distribution per village in North Denpasar District
The sampling design combined stratified proportional sampling at the village level with purposive criteria at the household level. Each household was selected based on predefined targeting households involved in daily cooking activities that generate UCO. The questionnaire collected data on household size, frequency of oil use, and average volume of used oil produced per month.
Each household location was georeferenced using GPS to enable spatial mapping. Spatial analysis was conducted using an areal-based approach rather than point-based interpolation. Household UCO generation estimates were aggregated at the village level and assigned to administrative polygons in Quantum Geographic Information System (QGIS). This approach was selected due to the administrative relevance of village boundaries for waste management planning and policy implementation. Additional demographic data, such as the number of households and population per village, were obtained from local government records and field verification to support analysis and projection modeling.
2.4 Data analysis
Data analysis consisted of three main stages: population projection, biodiesel conversion estimation, and spatial mapping. The potential of UCO generation was projected for a 10-year period (2025–2035) using the geometric population growth model [14, 15], assuming a constant annual growth rate of 1.25%. The projection formula is expressed as given in Eq. (2):
$P_t=P_0(1+r)^t$ (2)
where, $P_t=$ population in year $t,~P_0=$ base population, and $r=$ annual population growth rate (0.0125).
The biodiesel yield (B100) was then estimated from UCO volume based on a conversion ratio of 5 L of UCO → 4 L biodiesel, equivalent to 80% efficiency [16, 17]. The formula used as Eq. (3):
$B=0.8 \times J$ (3)
where, B = biodiesel potential (L) and J = total UCO volume (L).
2.5 Spatial autocorrelation analysis
To statistically examine the spatial distribution of household UCO production, a spatial autocorrelation analysis was conducted using GeoDa (an open-source software developed by the Center for Spatial Data Science at the University of Chicago) [18]. The analysis was performed at the village level, using total annual household UCO production as the primary attribute.
Spatial relationships among villages were defined using a contiguity-based spatial weights matrix (Queen Contiguity) [19], which considers villages sharing common boundaries or vertices as neighbors. The spatial weights matrix was row-standardized prior to analysis.
Global spatial autocorrelation was assessed using Moran’s I to evaluate whether the overall spatial distribution of UCO production exhibits clustering, dispersion, or randomness [20, 21]. Local spatial autocorrelation was further examined using Local Indicators of Spatial Association (LISA) to identify clusters and spatial outliers [22, 23]. In addition, Getis–Ord Gi* hotspot analysis was applied to detect statistically significant concentrations of high or low values [24], in this case, UCO values. Statistical significance for all spatial analyses was evaluated using a random permutation approach with a significance threshold of p ≤ 0.05.
2.6 Research workflow
The research procedure was designed to ensure systematic data acquisition, analysis, and validation. The workflow consisted of seven main stages:
(1) Preliminary survey to identify study sites and household sampling points;
(2) Data collection, including household interviews and GPS-based spatial recording;
(3) Data tabulation and analysis using statistical and geometric projection models;
(4) Calculation of UCO and biodiesel potential based on conversion ratios;
(5) Development of thematic maps;
(6) Spatial autocorrelation analysis;
(7) Preparation of reports and dissemination of findings.
3.1 Current potential of used cooking oil in North Denpasar
The analysis revealed that households in North Denpasar District collectively produce approximately 233,015 L/year UCO, equivalent to 186,414 L of biodiesel (B100) after conversion. The estimation was derived from survey data combined with population statistics and conversion assumptions. Among the eleven administrative villages, Pemecutan Kaja recorded the highest potential with 46,038 L/year, while Dangin Puri Kauh produced the lowest with 8.949 L/year. The distribution of UCO generation across villages in 2025 is presented in Table 2. The distribution of UCO generation per village is illustrated in Figure 3. This map shows a clear clustering of high-UCO-producing villages in central and northern zones, reflecting denser residential patterns.
Table 2. Village-level used cooking oil (UCO) production in North Denpasar in 2025
|
No. |
Village |
Average UCO per Household (L/year) |
Total UCO Output (L/year) |
Average UCO per Capita (L/year) |
|
1 |
Ubung |
5.30 |
12,285 |
1.25 |
|
2 |
Ubung Kaja |
6.35 |
30,990 |
1.35 |
|
3 |
Peguyangan |
6.00 |
18,516 |
1.24 |
|
4 |
Peguyangan Kangin |
4.37 |
16,423 |
0.84 |
|
5 |
Peguyangan Kaja |
7.87 |
15,301 |
1.64 |
|
6 |
Dauh Puri Kaja |
6.19 |
32,602 |
1.71 |
|
7 |
Dangin Puri Kaja |
6.08 |
22,804 |
1.65 |
|
8 |
Dangin Puri Kauh |
5.20 |
8,949 |
1.27 |
|
9 |
Dangin Puri Kangin |
5.90 |
11,452 |
1.21 |
|
10 |
Tonja |
4.31 |
17,655 |
1.16 |
|
11 |
Pemecutan Kaja |
6.58 |
46,038 |
1.59 |
|
|
Total |
64.15 |
233,015 |
14.91 |

Figure 3. Map of potential used cooking oil (UCO) availability in North Denpasar in 2025
This pattern correlates with population size and household density, where more densely populated areas tend to yield higher UCO volumes [25]. The estimated household UCO generation rate of approximately 5.86 L per household per year in North Denpasar falls within a reasonable empirical range when compared to other household-level studies in developing contexts. For example, a household survey in Malaysia found that average UCO generation was approximately 1.27 kg per household per month, which corresponds to about 15.24 L per household per year, assuming similar oil densities and usage patterns [26].
Additionally, larger-scale assessments of UCO management note substantial quantities of UCO generated when aggregated across urban populations, supporting the notion that per-household volumes on the order of several liters per year are plausible for dense city districts [27]. Although direct comparisons across studies are complicated by methodological differences in data collection and conversion assumptions, the observed generation rate in this study is consistent with other reported estimations and does not appear to be an outlier. This comparative context suggests that the level of household UCO generation estimated here is neither implausibly high nor unusually low, providing additional confidence in the robustness of the survey-based estimates and their use in spatial modeling and biodiesel potential assessments.
3.2 Biodiesel B100 production potential
Using a conversion factor in which 5 L of UCO yields 4 L (80% conversion rate) of Biodiesel B100, the total production potential for North Denpasar in 2025 is estimated at 186,414 L/year. The potential of B100 production in each village in North Denpasar is presented in Table 3.
Table 3. Village-level production of biodiesel B100 potential in North Denpasar in 2025
|
No. |
Village |
B100 Potential (L/month) |
B100 Potential (L/year) |
|
1 |
Ubung |
819 |
9,828 |
|
2 |
Ubung Kaja |
2,066 |
24,792 |
|
3 |
Peguyangan |
1,234 |
14,813 |
|
4 |
Peguyangan Kangin |
1,095 |
13,139 |
|
5 |
Peguyangan Kaja |
1,020 |
12,241 |
|
6 |
Dauh Puri Kaja |
2,173 |
26,082 |
|
7 |
Dangin Puri Kaja |
1,520 |
18,243 |
|
8 |
Dangin Puri Kauh |
597 |
7,159 |
|
9 |
Dangin Puri Kangin |
763 |
9,162 |
|
10 |
Tonja |
1,177 |
14,124 |
|
11 |
Pemecutan Kaja |
3,069 |
36,831 |
|
|
Total |
15,533 |
186,414 |
Figure 4. Map of potential B100 production in North Denpasar in 2025
This conversion efficiency is within the typical range reported in transesterification studies involving household UCO feedstocks. Spatial variability in biodiesel B100 production potential is illustrated in Figure 4. This map highlights the geographic clustering of household waste generation, supporting the proposal to establish centralized collection hubs in high-density zones.
This finding highlights that household-level UCO can become a strategic renewable-energy resource [28]. Biodiesel derived from UCO not only reduces waste disposal in urban drainage systems but also cuts greenhouse gas emissions compared to fossil diesel.
Pemecutan Kaja supplied the highest biodiesel potential (36,831 L/year), while Dangin Puri Kauh provided the lowest (7,159 L/year). This uneven distribution highlights the need for differentiated collection strategies-centralized depots in high-yield villages and integrated community-based collection in low-yield areas. The mean biodiesel potential per village is 16,947 L/year, indicating that even medium-population areas produce meaningful amounts of renewable fuel.
3.3 Ten-year projection of used cooking oil and biodiesel potential from 2025 to 2035
The next decade presents a critical opportunity to assess how demographic expansion and household cooking behavior will influence the renewable energy potential of North Denpasar. Using a geometric population growth rate of 1.25% per year as the basis for projection, the analysis indicates that UCO generation will increase steadily in line with the district’s expanding household population from 2025 to 2035. This trajectory reinforces UCO as a dependable long-term feedstock and underscores its strategic significance in sustaining biodiesel B100 production within North Denpasar’s evolving energy framework.
Accurately projecting the future contribution of UCO to North Denpasar’s renewable energy supply necessitates consideration of household consumption patterns and population growth. As the number of households increases, the quantity of UCO generated is expected to rise proportionally. Analysis at both district and village levels enables the formulation of more effective strategies for collection, processing, and distribution. By integrating demographic trends with UCO generation, a robust framework is established for estimating biodiesel B100 potential over the forthcoming decade.
Based on the growth model, total UCO production is projected to rise from 233,015 liters in 2025 to 263,838 liters in 2035, reflecting a decade-long increase of 13.2%, consistent with household expansion trends. Village-level projections show differential contributions, with Pemecutan Kaja maintaining the highest UCO potential at 36,831 L, while Dangin Puri Kauh records the lowest at 7,159 L by the end of the projection period.
Intermediate villages such as Peguyangan Kaja, Peguyangan Kangin, and Tonja remain stable contributors within the range of 14.000–21.000 L throughout the projection window. These quantitative forecasts align with current demographic structures, indicating that spatial production patterns will remain largely consistent over time.
Applying the 80% conversion efficiency commonly achieved under base-catalyzed transesterification, the biodiesel B100 production potential follows the same upward trend. Total biodiesel output increases from 186,414 liters in 2025 to 211,070 liters in 2035, mirroring the steady growth in UCO supply. The projected values are summarized in Table 4. Figure 5 shows the projected trajectory of total UCO production and total B100 potential in Northern Denpasar from 2025 to 2035.
Table 4. Projection of used cooking oil (UCO) production and biodiesel B100 potential in North Denpasar for 2025–2035
|
Year |
Households |
UCO Production (L/year) |
B100 Potential (L/year) |
|
2025 |
39,752 |
233,015 |
186,414 |
|
2026 |
40,247 |
235,931 |
188,744 |
|
2027 |
40,751 |
238,908 |
191,126 |
|
2028 |
41,262 |
241,951 |
193,561 |
|
2029 |
41,782 |
245,060 |
196,048 |
|
2030 |
42,310 |
248,237 |
198,590 |
|
2031 |
42,846 |
251,483 |
201,187 |
|
2032 |
43,391 |
254,799 |
203,839 |
|
2033 |
43,944 |
258,186 |
206,549 |
|
2034 |
44,506 |
261,644 |
209,315 |
|
2035 |
45,010 |
263,838 |
211,070 |

Figure 5. The projected trajectory of total used cooking oil (UCO) production and total B100 potential in Northern Denpasar

Figure 6. Projected used cooking oil (UCO) production potential in North Denpasar in 2035
High-yield villages like Pemecutan Kaja, Ubung, and Dauh Puri Kaja continue to dominate biodiesel potential, each exceeding 28,000-40,000 L/year by 2035. Meanwhile, Dangin Puri Kauh and Dangin Puri Kangin remain the lowest contributors, supplying 8,000-12,000 L/year of B100. The proportional relationship between demographic expansion and renewable fuel output demonstrates the scalability and reliability of household UCO as a feedstock. Figure 6 shows the projected UCO production potential in North Denpasar in 2035.
Although numerical trends form the foundation of this projection, spatial modeling deepens the interpretation of future potential. The projected distribution of UCO in 2035 remains concentrated in the southern and western parts of the district, while Figure 6 shows a similar spatial pattern for UCO potential. The 2035 UCO projection map clearly shows that production will remain concentrated in the southern and western parts of the district, where population density and cooking activity are highest.
Similarly, Figure 7 shows the 2035 biodiesel B100 projection map. Figure 7 reveals that these same areas constitute the strongest feedstock corridors for future biodiesel production. This stability in spatial structure suggests that long-term planning for collection networks, processing hubs, and feedstock logistics can be undertaken with confidence, as the core high-output zones are unlikely to shift significantly over the next decade.
The ten-year projection confirms that household-generated UCO in North Denpasar represents a consistent, quantifiable, and expandable renewable energy resource. The combination of reliable demographic growth, stable cooking behavior, and favorable conversion efficiency strengthens the potential for developing decentralized biodiesel initiatives. These findings provide a strong foundation for policy planning, investment strategies, and community-based sustainability programs aimed at integrating UCO-derived biodiesel into the district’s future energy landscape.

Figure 7. Projected biodiesel B100 production potential in North Denpasar in 2035
3.4 Spatial autocorrelation analysis of household used cooking oil production
Global Moran’s I analysis indicates a weak and negative spatial autocorrelation for annual household UCO production in North Denpasar (Moran’s I = –0.146), suggesting the absence of a strong global clustering pattern at the village scale. This result implies that villages with similar UCO production levels are not systematically clustered in space, and the overall spatial distribution tends toward randomness.
LISA analysis further reveals that only Ubung village exhibits statistically significant local spatial autocorrelation at the 5% significance level (p ≤ 0.05), while no villages are significant at the 1% or 0.1% levels. The identified village is classified as a Low–High (LH) cluster, indicating relatively lower UCO production compared to its neighboring villages. The majority of villages show no significant local spatial dependence. Figure 8 shows the LISA cluster map of village-level annual household UCO production in North Denpasar District.

Figure 8. LISA cluster map of village-level annual household used cooking oil (UCO) production in North Denpasar District
Consistent with the LISA results, the Getis-Ord Gi* hotspot analysis identifies only one statistically significant hotspot (p ≤ 0.05), while no significant coldspots are detected. This finding confirms that the spatial concentration of household UCO production is highly localized rather than widespread across the study area.
The convergence of Moran’s I, LISA, and Gi* results suggests that household UCO generation in North Denpasar is not primarily driven by spatial proximity among villages. Instead, UCO production appears to be influenced more strongly by village-specific household characteristics, cooking practices, and consumption behavior. Given the limited number of spatial units (11 villages), the detection of a single significant local cluster is statistically reasonable and indicates localized heterogeneity rather than systematic spatial spillover effects. Figure 9 shows the statistical significance map (p-values) of Getis–Ord Gi* analysis for annual household UCO production in the North Denpasar District.
The spatial distribution provides a practical basis for designing differentiated UCO collection strategies in North Denpasar. Villages identified as consistently high-yield areas, particularly Pemecutan Kaja and Dauh Puri Kaja, are suitable locations for piloting community-based UCO collection points. Concentrating initial infrastructure in these areas would maximize collection efficiency, reduce logistical costs, and enable rapid accumulation of feedstock for biodiesel production.

Figure 9. Statistical significance map (p-values) of Getis–Ord Gi* analysis for annual household used cooking oil (UCO) production in North Denpasar District
In contrast, villages with lower UCO output, such as Dangin Puri Kauh and Peguyangan Kangin, may not justify standalone collection facilities. In these areas, UCO collection can be integrated into existing household waste management and recycling systems, such as waste banks or community-based solid waste programs. This integrated approach minimizes additional operational costs while maintaining household participation.
To enhance participation across all villages, supportive policy instruments are required. These include small financial incentives, price guarantees for collected UCO, or non-monetary rewards linked to existing community programs. Public awareness campaigns emphasizing environmental benefits and safe disposal practices are also necessary, particularly in villages with lower awareness and participation levels.
The spatially explicit results of this study demonstrate that UCO collection systems should not be uniformly implemented across the district. Instead, a phased and location-specific approach, informed by spatial analysis, offers a more effective pathway for supporting circular economy initiatives and future biodiesel production in urban areas.
This study provides the first village-level spatial database and ten-year projection of household-generated UCO potential in North Denpasar District, Indonesia. By integrating household survey data, demographic projection, and GIS, the study quantifies current and future UCO availability and visualizes its spatial distribution at a fine administrative scale.
In 2025, household UCO production in North Denpasar reached 233,015 L/year, with substantial inter-village variation ranging from 8,949 L/year in Dangin Puri Kauh to 46,038 L/year in Pemecutan Kaja. Based on an annual population growth rate of 1.25%, total UCO production is projected to increase to 263,838 L/year by 2035. Correspondingly, biodiesel (B100) potential is estimated to rise from 186,414 L/year to 211,070 L/year over the same period.
Spatial autocorrelation analysis using Moran’s I, LISA, and Getis–Ord Gi* indicates weak global spatial dependence and highly localized clustering, with only one village showing statistically significant spatial association. These results suggest that household UCO generation is not governed by broad spatial patterns but rather by village-specific household behaviors and consumption characteristics.
From a policy perspective, the findings support targeted and spatially informed waste-to-energy strategies. High-output villages such as Pemecutan Kaja, Dauh Puri Kaja, Ubung, and Ubung Kaja are suitable locations for piloting community-based UCO collection points and localized awareness programs. In contrast, villages with lower and more dispersed UCO generation may benefit from integration with existing municipal waste recycling systems and incentive-based household participation schemes.
This study demonstrates that household-derived UCO represents a stable and gradually expanding renewable energy feedstock. The village-level spatial framework and long-term projections developed in this study provide a practical foundation for refined waste management planning and decentralized biodiesel development in urban areas of developing countries.
This work was supported by the Research and Community Service Institution (LPPM) of Udayana University under the “Penelitian Unggulan Udayana 2025” program. Contract Number: SP DIPA-139.03.2.693389/2025. Publication assistance in reputable journals by the Directorate General of Research and Development of the Ministry of Higher Education, Science and Technology of the Republic of Indonesia, based on letter number 0488/C/DT.06.01/2025.
[1] Mizik, T., Gyarmati, G. (2021). Economic and sustainability of biodiesel production—A systematic literature review. Clean Technologies, 3(1): 19-36. https://doi.org/10.3390/cleantechnol3010002
[2] Silalahi, F.T.R., Simatupang, T.M., Siallagan, M.P. (2020). Biodiesel produced from palm oil in Indonesia: Current status and opportunities. AIMS Energy, 8(1): 81-101. https://doi.org/10.3934/energy.2020.1.81
[3] Chhetri, A.B., Tango, M.S., Budge, S.M., Watts, K.C., Islam, M.R. (2008). Non-edible plant oils as new sources for biodiesel production. International Journal of Molecular Sciences, 9(2): 169-180. https://doi.org/10.3390/ijms9020169
[4] Kumar, A., Bhayana, S., Singh, P.K., Tripathi, A.D., Paul, V., Balodi, V., Agarwal, A. (2025). Valorization of used cooking oil: Challenges, current developments, life cycle assessment and future prospects. Discover Sustainability, 6(1): 1-31. https://doi.org/10.1007/s43621-025-00905-7
[5] Hidalgo-Crespo, J., Alvarez-Mendoza, C.I., Soto, M., Amaya-Rivas, J.L. (2022). Towards a circular economy development for household used cooking oil in Guayaquil: Quantification, characterization, modeling, and geographical mapping. Sustainability, 14(15): 9565. https://doi.org/10.3390/su14159565
[6] Banga, S., Pathak, V.V. (2023). Biodiesel production from waste cooking oil: A comprehensive review on the application of heterogenous catalysts. Energy Nexus, 10: 100209. https://doi.org/10.1016/j.nexus.2023.100209
[7] Darmansyah, A.P., Auvaria, S.W., Agustina, E. (2024). Analysis of community perceptions of used cooking oil processing on a household scale to realize SDGs. ASPIRASI: Publikasi Hasil Pengabdian Dan Kegiatan Masyarakat, 2(5): 284-298. https://doi.org/10.61132/aspirasi.v2i5.1091
[8] Casas, L.C., Orjuela, A., Poganietz, W.R. (2024). Sustainability assessment of the valorization scheme of used cooking oils (UCOs): The case study of Bogotá, Colombia. Biomass Conversion and Biorefinery, 14(14): 15317-15333. https://doi.org/10.1007/s13399-023-03800-1
[9] Yoko, B., Furqon, F. (2025). Circular economy breakthrough: Converting used cooking oil into sustainable biodiesel. Journal of Economics and Policy, 18(1): 36-49. https://doi.org/10.15294/jejak.v18i1.14724
[10] Elgharbawy, A.A., Sadik, W.A., Ali, A. (2021). Biodiesel production from waste cooking oil: A review. Renewable Energy Reviews, 135: 110-125.
[11] Denpasar City Central Statistics Agency. (2025). Kota Denpasar dalam Angka (Denpasar City in Figures). Denpasar City: Denpasar City Central Statistics Agency. https://denpasarkota.bps.go.id/id/publication/2025/02/28/a743ae15cbf31f6b287a264a/kota-denpasar-dalam-angka-2025.html.
[12] Mukti, B.H. (2025). Sample size determination: Principles and applications for health research. Health Sciences International Journal, 3(1): 127-143. https://doi.org/10.71357/hsij.v3i1.63
[13] Susanti, A., Soemitro, R.A.A., Suprayitno, H., Ratnasari, V. (2019). Searching the appropriate minimum sample size calculation method for commuter train passenger travel behavior survey. Journal of Infrastructure & Facility Asset Management, 1(1): 47-60. https://doi.org/10.12962%2Fjifam.v1i1.5232
[14] Pelagalli, C., Faccio, S., Casari, P. (2025). Mathematical modeling and simulation of logistic growth. Applied Sciences, 15(8): 4409. https://doi.org/10.3390/app15084409
[15] Safii, M., Setiana, R. (2024). Population prediction using multiple regression and geometry models based on demographic data. MATRIK: Jurnal Manajemen, Teknik Informatika dan Rekayasa Komputer, 24(1): 129-140. https://doi.org/10.30812/matrik.v24i1.4121
[16] Milojević, S., Stopka, O., Kontrec, N., Orynycz, O., Hlatká, M., Radojković, M., Stojanović, B. (2025). Analytical characterization of thermal efficiency and emissions from a diesel engine using diesel and biodiesel and its significance for logistics management. Processes, 13(7): 2124. https://doi.org/10.3390/pr13072124
[17] Mufidah, Z., Tiguna, A.H., Haryanto, A. (2024). Stability of pure biodiesel (B100), biodiesel mixture (B40), and petroleum diesel (B0) due to storage. Jurnal Teknik Pertanian Lampung (Journal of Agricultural Engineering), 13(3): 900-913. https://doi.org/10.23960/jtep-l.v13i3.900-913
[18] She, B., Hu, T., Zhu, X., Bao, S. (2019). Bridging open source tools and Geoportals for interactive spatial data analytics. Geo-spatial Information Science, 22(3): 185-192. https://doi.org/10.1080/10095020.2019.1645497
[19] Guo, H., Tang, Y., Guo, J. (2025). Spatial heterogeneity of traditional villages in Southern Sichuan, China: Insights from GWR and K-Means clustering. Land, 14(9): 1817. https://doi.org/10.3390/land14091817
[20] Guo, S., Yan, X. (2025). Investigation of industrial structure upgrading, energy consumption transition, and carbon emissions: Evidence from the Yangtze River economic belt in China. Sustainability, 17(10): 4383. https://doi.org/10.3390/su17104383
[21] Anggani, N.L., Amrullah, H.M., Gemilang, D.S.A. (2023). Moran I autocorrelation study for level spatial pattern analysis. Jurnal Indonesia Sosial Teknologi, 4(9): 1285-1291. https://doi.org/10.59141/jist.v4i9.686
[22] Asparian, A., Wisudariani, E., Syukri, M., Putri, C.I. (2024). Spatial autocorrelation analysis to identify hotspots of stunting cases in Kerinci regency. Jurnal Bidan Cerdas, 6(1): 1-10. https://doi.org/10.33860/jbc.v6i1.3480
[23] Guerri, G., Crisci, A., Messeri, A., Congedo, L., Munafò, M., Morabito, M. (2021). Thermal summer diurnal hot-spot analysis: The role of local urban features layers. Remote Sensing, 13(3): 538. https://doi.org/10.3390/rs13030538
[24] Kumar, S., Parida, B.R. (2021). Hydroponic farming hotspot analysis using the Getis–Ord Gi* statistic and high-resolution satellite data of Majuli Island, India. Remote Sensing Letters, 12(4): 408-418. ttps://doi.org/10.1080/2150704X.2021.1895446
[25] Matušinec, J., Hrabec, D., Šomplák, R., Nevrlý, V., Redutskiy, Y. (2022). Cooking oils and fat waste collection infrastructure planning: A regional-level outline. Clean Technologies and Environmental Policy, 24(1): 109-123. https://doi.org/10.1007/s10098-021-02087-y
[26] Kamaruzaman, N.H.I., Halim, N.A., Malek, N.H.A., Idris, N.S.U. (2022). Households awareness and practices on used cooking oil recycling in Felda Lepar Hilir 1, Pahang. IOP Conference Series: Earth and Environmental Science, 1102(1): 012073. https://doi.org/10.1088/1755-1315/1102/1/012073
[27] Santander-Bossio, M., Silva-Ortega, J., Cantero-Rodelo, R., Torres-Salazar, P., Rivera-Alvarado, J., Moreno-Rocha, C., Milánes-Batista, C. (2025). From waste to energy: Cooking oil recycling for biodiesel in Barranquilla, Colombia. Sustainability, 17(14): 6560. https://doi.org/10.3390/su17146560
[28] Yılbaşı, Z. (2025). Biofuels, e-fuels, and waste-derived fuels: Advances, challenges, and future directions. Sustainability, 17(13): 6145. https://doi.org/10.3390/su17136145