AL Hatem Satta Seham Ismail*![]() | Eris Elianddy Bin Supeni
| Eris Elianddy Bin Supeni![]() | Azizan As'arry
| Azizan As'arry![]() | Zuhri Mohamed Yusoff
| Zuhri Mohamed Yusoff![]()
© 2025 The authors. This article is published by IIETA and is licensed under the CC BY 4.0 license (http://creativecommons.org/licenses/by/4.0/).
OPEN ACCESS
The advancement of gas turbine (GT) technology is critical for developing innovative strategies to enhance the performance and efficiency of gas turbine power plants (GTPPs), especially in response to the rising global demand for electrical power. Environmental factors, particularly in hot and arid regions, significantly impact gas turbine output. Key external variables such as ambient air temperature and humidity directly affect turbine characteristics, often leading to substantial reductions in both power output and efficiency during high-temperature periods. In this study, the Six Sigma DMAIC method (Define, Measure, Analysis, Improve, and Control) was used to solve problems and enhance processes of GTPP. Also, Aspen HYSYS simulation software was utilized to model and analyze real operational data obtained from the AL-Taji Power Plant, located in Baghdad, Iraq, where ambient temperatures can reach up to 50℃. The research focused on the integration of inlet air fogging technology with the gas turbine (GT) system to improve performance under high-temperature conditions. The study results showed that net power increase from (56.7 MW) to (74.9 MW) (23.4%) with fogging system and decrease specific fuel consumption (SFC) (34.7%), heat rate (HR) (36%) respectively, also decline emissions CO2 (4248 kg/h), which indicates that the fog system in the gas turbine power plant is economically feasible in terms of fuel consumption, energy requirements and greenhouse gas emissions.
gas turbine power plant (GTPP), Six Sigma DMAIC, Aspen HYSYS software, SFC, HR
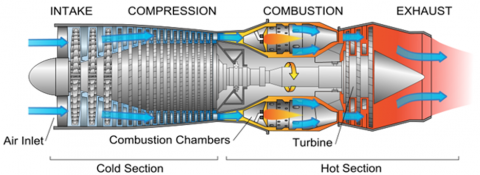
The gas turbines (GTs) in power plants are heat engines that generate power when the fuel burns to produce hot flue gases for working the turbines. Every GT consists of three main parts: an air compressor, a combustion chamber, and a turbine [1]. A generator is connected to the turbine shaft, which turns an electrical generator shaft to provide electrical energy (Figure 1) [2, 3]. This illustrates that GTs are essential in power generation processes. GTs are among the most significant solutions used for electricity generation, especially during peak hours, due to their rapid startup compared to steam turbines, which require initial setup and preparation. GTs also offer several other advantages [4, 5]. The fact that the efficiency of GTs in hotter climes quickly declines as the surrounding air temperature rises is a significant disadvantage.

Figure 1. Schematic diagram of the GT [2, 3]
This research used the Six Sigma DMAIC method to enhance the efficiency and capacity of the GT power plant (GTPP) during the hot summer months, after comparing it with other methods. The Define, Measure, Analysis, Improve, and Control, which are five crucial phases or stages, were used to solve problems and enhance processes in manufacturing [6-8]. The DMAIC approach's primary actions in the case study, the DMAIC Tool, were illustrated in Figure 2.

Figure 2. DMAIC tool box [6]
The main problem with simple cycle GT units is their low thermal efficiency as a result of their influence on the surrounding climatic conditions. Hence, the aim of this study is to determine the effect of the fogging system on enhancing the performance of GTPP by conducting simulations using Aspen Hysas. The current study seeks to study and compare the effect of the air inlet cooling system for various ambient temperatures on the processes of GT due to not enough studies between GT and fogging systems, which is considered one of the guaranteed and economical ways to cool the air entering the GT in order to improve its performance.
In hot climates, cooling the inlet air to the compressor is recognized as one of the most effective techniques for enhancing GT performance [9]. Consequently, numerous studies have been conducted to explore various methods for improving GT efficiency under high ambient temperature conditions. Omidvar [10] evaluated several approaches and concluded that inlet air cooling is the most effective strategy for increasing GT efficiency. Among the techniques assessed, the use of evaporative cooling with wetted media demonstrated significant potential in enhancing overall plant performance and thermal efficiency [11]. When the ambient temperature reaches 50℃, net power generation and thermal efficiency decrease by about 3% and 10%, respectively [12]. According to the study, the GT power product every day was enhanced by the use of an inlet cooling system [13]. Additionally, they examined the effects of the research on the region's temperature and moisture content on the GT's operation. GT power and efficiency were found to rise by 14.77% and 4.88%, respectively, when a chiller with vapor-compression was added to a CCPP [14]. The thermal efficiency of the turbine cycle is decreased by the high ambient temperature, which raises fuel consumption, greenhouse gas (GHG) emissions, and maintenance and operating costs. Such circumstances frequently lead to equipment failure and downtime during GT operation because the power plant's intake air is not adequately cooled. The aforementioned surrounding temperature requirement has a crucial impact on the power output, efficiency, specific fuel consumption (SFC), and net heat rate (HR) of GTPP. The popular and effective air intake cooling method known as "FOGGING" is pumping water into a GT's inlet duct [15]. Fog occurs when there is a 2.5℃ difference between the air temperature and the dew point. To put it another way, fog begins to form when water vapor condenses into tiny liquid droplets that float airborne [16]. By pumping water directly into the compressor, the fogging system improves net power by lowering the ambient air temperature until it reaches the wet bulb temperature. A popular and effective method of air intake cooling is intake fogging, which is the injection of water into a GT's input duct. In order to create a fine mist of water droplets, or fog, in the air intake, a nozzle manifold, which is frequently positioned close to the air filters, injects lease possible or the same amount of water as is required to saturate the air intake under particular environmental circumstances. By lowering the inlet air temperature of the compressor, performance, capacity of GT, SFC, and HR losses are all restored [17]. This decrease in HR means that reduction in CO2 emissions (30 kton/year), hence enhancing the environment [18]. This technique's efficacy is dependent on temperature and air humidity; it often yields the greatest advantages in hot, dry areas but does not in moist, tropical settings as well. Pressure, humidity, and ambient temperature are significant variables that can either enhance or degrade a GT unit's effectiveness. Cooling the input air less than 15℃ can cause AIC to raise GT output over the rated capacity [19]. The goal of this study is to demonstrate that computer-aided simulation may be used to choose the best parameters for an enhanced power plant. A high-pressure fogging device is incorporated into the simulation configuration to lower the air temperature intake into the GT unit. This study examined the effectiveness of GT in conjunction with fogging cooling to meet International Standardization Organization (ISO) operating requirements during the sweltering summer. Data gathered from the power plant, and Aspen-HYSYS software simulation are used in the research [20].

Figure 3. Scheme of GT incorporated fogging system with the filters [21]
In order to compare the properties of GT and its equipment "with" and "without" a cooling unit and assess the impact of altering the compressor entrance's conditions, this study provides some crucial insights that can aid in creating an accurate simulation. the effect of factors like inlet air temperature on fuel consumption, output power, heat rate, and thermal efficiency. GTPP necessity for such a technology to boost power output under the operating conditions was demonstrated by the study illustrating how fogging system technology produces extremely tiny water droplets through the compressor's input, as shown in Figure 3 [21]. The Aspen HYSY software simulation was used in this study.
2.1 Methodology
It is the first time in this study to use the Six Sigma DMAIC method with Aspen HYSYS software to optimize the inlet cooling system and enhance the performance of GTPP by using a fogging system. The research employed the five phases of the Six-Sigma DMAIC methodology: Define, measure, analyze, improve, and control with their tools to increase the efficiency of GTPP and power output. Considering that these tools might vary from case to case, each phase consists of many processes that employ pertinent engineering tools.
2.2 Material
This study, which is actually a case study, was conducted within the AL Taji Power Plant company, which generates and distributes electricity in the Iraq -Baghdad, Iraq. The Gas-Turbine Unit (GTU) that is the subject of this case study is (PG6111FA), which was manufactured by General Electric ("GE Energy"), is described in this part, as shown in Figure 4 [22]. A description of the key characteristics of the GT operation is provided in Table 1 [23]. An 18-speed axial compressor (stages) compresses the ambient air after it has been filtered by the input mixing air chamber assembly during GTU operation. The compressor's pressurized air enters the annular zone, which surrounds the six combustion chambers. The air passes through the metering holes in the lining of each combustion chamber and then reaches the combustion zone through the gap between the inner lining and the outer casing. Each of the six combustion chambers receives fuel from fuel injectors, which then mix it with inflammation and ignition. Prior to accessing the three-stage turbine section, the hot gases expand from the combustion chambers and go through six separate transition compartments that are attached to the inner lining of the combustion chambers' discharge side. The pressure drops and the jet's kinetic energy increases with each extra row of nozzles. The kinetic energy of the jet increases with each extra row of nozzles, but the pressure simultaneously decreases. The turbine rotor uses some of the jet's kinetic energy to drive the blades of the following row of spinning devices. The third stage's blades pass through, and the exhaust gases are then collected by a diffuser and exhaust casing. The gases are then sent to the waste-heat recovery boiler for processing. Following its passage through the reduction gear, the shaft revolves, driving the generator rotor, which generates power [23].
Figure 4. Typical GT cross section [22]
Table 1. The standard references parameters for GT GTU (PG6111FA) [23]
|
No. |
Characteristic |
Meas. Unit |
Value |
|
1 |
Power at the generator terminals |
kW |
80000 |
|
2 |
Atmospheric pressure |
Kgf/cm² |
1.013 |
|
3 |
Compressor inlet temperature |
℃ |
15 |
|
4 |
Relative humidity at the compressor inlet |
% |
60 |
|
5 |
The pressure of the fuel before the gas module |
Kgf/cm² |
25.9-30.8 |
|
6 |
The number of stages in the compressor |
pcs |
18 |
|
7 |
The number of stages in the turbine |
pcs |
3 |
|
8 |
Air flow |
m³/s |
166 |
|
9 |
Compression ratio |
|
15.8 |
|
10 |
Air temperature after the compressor |
℃ |
385 |
|
11 |
Flue gas temperature |
℃ |
603 |
|
12 |
The temperature of the combustion chamber |
℃ |
1325 |
2.3 Applications of the Six Sigma DMAIC approach with rising ambient temperatures
When the air temperature rises during the hot summer causes decreases in mass flow rate in GTPP, as result un sufficient in power output is happing and decreases in supplying electric energy to the customers, so it is necessary to discover this issues and analyses the data with find the suitable solve with improving the processes of GTPP by application Six Sigma DMAIC method.
2.3.1 Define phase
The Six Sigma and DMAIC methodologies begin with the "define" step. Establishing the project's boundaries and scope is the goal of this phase [24]. Finding the objectives of the project and the voice of the customer (VOC), or the needs of the client or the business, is important (Table 2) [7, 8]. However, the Six Sigma team must be established before these project components are defined. The team for this improvement project consisted of three individuals: the improvement project leader, an experienced operator from the energy product from GTPP, and a production energy engineer. The next step in the DMAIC "define" stage was to state the project's scope. Jirasukprasert et al. [24] recommend that a Six Sigma project be chosen in light of business problems pertaining to failing to meet consumer expectations. A major and favorable influence on clients should be the main goal of the initiatives that are selected. Given these suggestions, the project's selected task was to reduce or eliminate the increase in ambient temperature, especially during hot days, which reduces the mass flow rate of air, power output, and efficiency of GTPP.
Table 2. A project charter [8]
|
Project Title |
Defect in the Efficiency and Power Output of GTPP During Hot Days |
|
Background and research for selecting the project |
The increase in ambient temperature during the hot days in some countries causes a lack in supplying electric power to customers from GTTP due to the decrease in the density of the air, mass flow rate, as a result to decrease in the efficiency and capacity of GTPP |
|
Project objective |
To reduce the increase in ambient temperature through the hot days by applying the Six Sigma DMAIC method, and enhance the power output and the efficiency of GTPP |
|
Voice of customer (VOC) |
Improvement of the supply of electric power to satisfy the customers and companies during the hot days (summer) |
|
Project boundary |
Focusing on reducing the ambient temperature to enhance the efficiency and capacity of GTPP |
|
Team member |
Produce energy engineer, an experienced operator in GT, the Leader of the enhancement project |
|
The benefit expectation |
The savings in cost, time, and the environment due to the satisfaction of customers and the company |
|
Expected customer benefits |
Increased confidence in the companies that produce electrical energy continuously, which saves efforts, money, and time |
The next stage to identify is the SIPOC diagram (Supply Input Processes Output Customer) in order to have a better understanding of the issue with the GTPP process for providing clients with energy power. The SIPOC diagram for GTPP processes is shown in Figure 5 [7].

Figure 5. SIPOC Diagram of GTPP processes [7]
The basic idea of a GT is that a compressor compresses a working gas, such as air, and then uses the fuel's combustion energy to heat it. Both the temperature and the pressure are elevated in the working gas. The turbine changes the energy of the flow of gas into the rotating energy to drive the shaft, taking advantage of the contact between the gas and the blades. Before being released into the atmosphere, this generates mechanical power. GT uses some of its mechanical energy to spin or drive the shaft of the compressor and the rest to create electricity [16].
2.3.2 Measure phase
Establishing trustworthy metrics to aid in tracking progress toward the goal or goals is part of the "measure" phase of this methodology [25]. The goal of this paper was to lessen the high ambient temperature, which caused a decrease in the capacity of GT, Air mass flow rate, and GTPP efficiency. Specifically, the "measure" step in this study indicated the process of defining and choosing useful measurements to identify the main flaws that needed to be fixed. The quantity with less power output on hot days was one of the measures that was established. To compare the "before and after" states, two additional metrics were employed: GT operational parameters and GT (ISO 3977).
Data collection and parameters. The actual and genuine ISO condition data utilized in this calculation came from the manufacturer's operating volume, which was given to the client. and the logbook, which documents the GT unit's daily analog and digital readings, also includes actual temperature data that was used in other computations. In our calculations, the ambient temperature was at typical standard values for GT (ISO 3977), despite the ambient pressure being 101.3 kPa (14.7 psia) and T1 = 15℃ + 273 = (288k) (Table 3).
Table 3. Standard reference conditions for GTPP (ISO 3977)
|
Operation Parameters |
Value |
Unite |
Operation Parameters |
Value |
Unite |
||
|
1 |
The power out put from GTPP |
80000 |
kw |
11 |
Lower Heat value LHV |
28.431 |
kJ/kg |
|
2 |
The Air ambient Temperature |
15 |
℃ |
12 |
Isentropic Efficiency of Compressor |
88 |
% |
|
3 |
The surrounding air Pressure |
1.015 |
bar |
13 |
Isentropic Efficiency of Turbine |
90 |
% |
|
4 |
The outlet temperature of CompT2 |
385 |
℃ |
14 |
Air specific heat |
1.005 |
kJ/kg k |
|
5 |
Total mass flow rate of air.ma |
197 |
kg/s |
Capacity (cpa) |
|||
|
6 |
Gas flow. Rate. mg |
7.7 |
kg/s |
15 |
Gas specific heat |
1.15 |
kJ/kg k |
|
7 |
Pressure Ratio |
15.8 |
Capacity (cpg) |
||||
|
8 |
Turbine Inlet Temp. T3 |
1325 |
℃ |
16 |
Heat capacity ratio |
1.4 |
|
|
9 |
Pressure of the Inlet fuel |
25,30 |
bar |
for air gamma ya |
|||
|
10 |
Temperature of the Inlet fuel |
25 |
℃ |
17 |
Heat capacity ratio for gas gamma yg |
1.3 |
The temperature increases of more than 15℃ reduce the GTPP's capacity (power production) because the compressor will not have adequate air mass. In the area of Iraq, especially in the hot summer, air temperatures can reach 45 to 50℃ and sometimes much higher. Furthermore, Table 4 presents the data gathered at different temperatures, which were used in a Pareto chart (Figure 6) [25].
Table 4. Different air temperatures and parameters GTPP
|
Ambient Temp. |
Turbine Inlet Temp. ($\mathrm{T}_3$) |
Total Mass Flow Rate of Air |
Gas Flow Rate |
P2/p1 |
Exhaust Temp. |
|
(T1) ℃ |
℃ |
(ma).kg/S |
(mg). kg/S |
(T4) ℃ |
|
|
15 |
1325 |
197 |
7.7 |
15.8 |
652 |
|
25 |
1335 |
190 |
7.75 |
15.8 |
657 |
|
35 |
1350 |
175 |
7.78 |
15.8 |
666 |
|
50 |
1365 |
155 |
7.8 |
15.8 |
675 |

Figure 6. Pareto chart for different ambient temperatures (T1 °C![]() the drop of mass flow rate of air with rising of ambient temperature [25]
the drop of mass flow rate of air with rising of ambient temperature [25]
2.3.3 Analysis phase
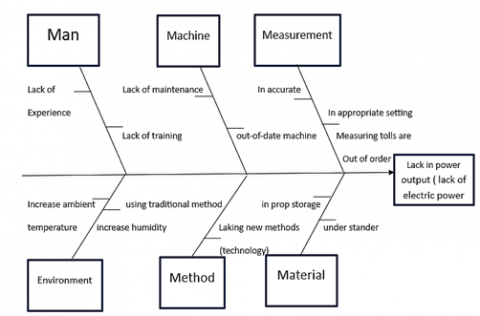
The system is analyzed during this phase of the DMAIC improvement model to find strategies for closing the performance gap between the intended target or objectives and the present performance [8]. In order to do this, the data is analyzed in this phase, and then the underlying cause of the issue is identified and comprehended through an inquiry and understand the root cause of the problem (Figure 7) [26]. The next step is to identify and rank the opportunities for improvement. The tasks conducted during the analysis stage can be carried out by utilizing particular methodologies and strategies that are often used in this stage of DMAIC [8]. In the analysis stage, methods and strategies, including process mapping, brainstorming, cause-and-effect diagrams, DOE, hypothesis testing, statistical process control (SPC) charts, and simulation, are typically employed [27]. The choice of the most successful strategies will often depend on the project's type and methodology [8].
The performance of GTPPs is influenced by the ambient conditions [28]. These conditions (Temperature, Pressure Density, and Mass flow rate, etc.) vary with time and place. Both air density, air mass flow, and power output are greatly reduced on hot days due to high temperature and low air mass flow [29]. The relationship between mass flow rate and density with ambient temperature is as follows [30].
$\begin{gathered}m=P_1 V_1 / R T_1 \\ \rho=P / \mathrm{RT} \text { and } \rho=m / \mathrm{v} \therefore P / R T \alpha ~ m / v\end{gathered}$
m: mass flow rate, $\boldsymbol{\rho}$: density, $\boldsymbol{P}$: air pressure, $\mathbf{v}$: volume, $\boldsymbol{T}$: ambient temperature, $\boldsymbol{R}$: constant of the air.
These changes significantly affect GTPP performance [27]. Therefore, the power output decreases, and SFC increases when the ambient temperature increases. Changes in the flow rate of the air mass entering a GT affect the performance of the whole system, including changes in the air pressure, humidity, and temperature, all of which affect the air density (Figure 7) [26, 27].
Figure 7. Cause-and-effect diagram related to the lack in power output of GTPP [26, 27]
The equations of flow energy in a steady state and its derivatives. Ibrahim et al. [29] stated that every component of the GT engine functions stably together. The following equations were obtained by applying the equations of flow energy in steady state for an ideal turbine cycle to a steady flow process and adjusting it to assume that the compressor and turbine processes that zero heat addition is zero (q follows the first law of thermodynamics for an open system as the following [30]:
$\begin{gathered}h_1+\frac{v_1^2}{2}+g z_1+w=h_2+\frac{v_2^2}{2}+g z_2+q \\ \text { since, } w=q+\left(h_2-h_1\right)+\frac{\left(v_2-v_1\right)^2}{2}+\left(z_2 g-\right. \left.z_1 g\right)\end{gathered}$ (1)
$\boldsymbol{w}=\boldsymbol{h}_{\mathbf{2}}-\boldsymbol{h}_{\mathbf{1}}=\operatorname{Cpa}\left(\boldsymbol{T}_{\mathbf{2}}\right)-\operatorname{Cpa}\left(\boldsymbol{T}_{\mathbf{1}}\right)=\boldsymbol{C}_{\boldsymbol{p}}\left(\boldsymbol{T}_{\mathbf{2}}-\boldsymbol{T}_{\mathbf{1}})\right.$ (2)
Considering that all work and heat energy units will be in kJ/kg, the mass flow is constant, and the system's total energy input equals its total energy output.
The GT work net equations [30]:
Work of the compressor:
$w c=\acute{h}_2-h_1=\operatorname{Cpa}\left(\acute{T}_2-T_1\right)$ (3)
Work of the turbine:
$w t=\acute{h}_3-\acute{h}_4={Cpg}\left(\acute{T}_3-\acute{T}_4\right)$ (4)
The work net:
$\begin{gathered}{ Wnet }=w t-w c={Cpg}\left(\acute{T}_3-\acute{T}_4\right)-{Cpa}\left(\acute{T}_2-T_1\right)\end{gathered}$ (5)
The GT heat addition and efficiency equations [30]:
The additional heat:
${\text { Qin }=\acute{h}_3-{\acute{\acute{h}}_2}}=heat\ \acute{Comb.}-heat\ Com ={Cpg}\left(\acute{T}_3-\acute{T}_2\right)$ (6)
Thermal efficiency:
$\eta t h=\frac{W n e t}{Q i n}=\frac{{Cpg}\left(\acute{T}_3-\acute{T}_4\right)-{Cpa}\left(\acute{T}_2-T_1\right)}{{Cpg}\left(\acute{T}_3-\acute{T}_2\right)}$ (7)
The power output equation:
The units that follow from ignoring the flow mass in the S.S.F.E.E. equations and their derived formulas will be in kJ/kg since the flow is constant. Taking into account the mass flow, multiply it by the network to determine the power output.
$p_{{output }}=W_{{net }} \times \mathrm{m}$ (8)
The isentropic efficiency equations [30]:
One metric used to gauge the extent of energy loss in steady-flow devices is isentropic efficiency. It entails contrasting a device's real performance with the performance that would be attained for the identical inlet and exit state under idealized conditions.
$\begin{gathered}\eta C=\frac{ { Ideal\ Com.work }}{{ Actual\ Com.work }} \\ \eta C=\frac{{ma\ cpa}\left(T_2-T_1\right)}{{ma\ cpa}\left(\acute{T}_2-T_1\right)}\end{gathered}$
Compressor isentropic efficiency:
$\eta C=\frac{\left(T_2-T_1\right)}{\left(\acute{T}_2-T_1\right)}$ (9)
$\begin{aligned} \eta T & =\frac{{ Actual\ Tur.work }}{{ Ideal\ Tur.work }} \\ \eta T & =\frac{m g {cpg}\left(\acute{T}_3-\acute{T}_4\right)}{m g {cpg}\left((\acute{T}_3-T_4\right)}\end{aligned}$
Turbine isentropic efficiency:
$\eta T=\frac{\left(\acute{T}_3-(\acute{T}_4\right)}{\left(\acute{T}_3-T_4\right)}$ (10)
The calculations for actual compressor temperature ($\acute{T}_2$) [29]:
From given Table 5:
$T_1=25^{\circ} \mathrm{C}=25+273=298 k^0$ and pressure ratio $\left(\frac{\boldsymbol{P}_{\mathbf{2}}}{\boldsymbol{P}_{\mathbf{1}}}\right) =15.8, T_2$ can be calculated is entropically: $\acute{T}_2$
$T_2=T_1\left(\frac{\boldsymbol{P}_{\mathbf{2}}}{\boldsymbol{P}_{\mathbf{1}}}\right)^{\frac{\gamma-\mathbf{1}}{\gamma}} T_2=298 \times(15.8)^{o \cdot 28}=645 k^0$
The calculation $\acute{T}_2$ using: Eq. (9),
$\begin{gathered}\left.\acute{T}_2=\left(T_2-T_1\right)+\left(\eta C \times T_1\right) / \eta C=(645-298)+0.88 \times 298\right) / 0.88 =692 . k^0\end{gathered}$
2.3.4 The calculations actual turbine outlet temperature ($\acute{T}_4$) [30]
It is necessary to assume $P_2$ = P3 and P1 = P4 since the process is isentropic (there is no loss in the pressure isentropically, the pressure entering the compressor is equal to the pressure leaving the turbine).
From given Table 5:
$T_3=\acute{T}_3=1335^{\circ} \mathrm{C}$ and pressure ratio $\left(\frac{P_3}{P_4}\right)=\left(\frac{P_2}{P_1}\right)=15.8$
$\frac{T_3}{T_4}=\left(\frac{P_2}{P_1}\right)^{\frac{\gamma-1}{\gamma}} \frac{P_3}{P_4}=\frac{P_2}{P_1}, T_3=\acute{T}_3$
$T_4$ can be calculated isentropically: $T_4=\acute{T}_3/\left(\frac{\boldsymbol{P}_{\mathbf{2}}}{\boldsymbol{P}_{\mathbf{1}}}\right)^{\frac{\boldsymbol{\gamma}-\mathbf{1}}{\boldsymbol{\gamma}}}=T_4 =(1335+273) k^0 /(15.8)^{0.23}=855 k^0$. The calculation of actual turbine outlet temperature($\acute{T}_4$) using Eq. (10):
$\begin{gathered}\acute{T}_4=\acute{T}_3-\eta T x\left(\acute{T}_3-T_4\right) \\ \acute{T}_4=1608-(0.90) \times(1608-855)=930 k^0 \\ \text { Since, } T_1=298 k^0, \acute{T}_2=692 k^0, \acute{T}_3=(1335+273) =1608 k^0, \acute{T}_4=930 k^0 \\ W c=\acute{h2}-h 1=C p a\left(\acute{T}_2-T_1\right)=1.005 \times(692-298) =396 \mathrm{~kJ} / \mathrm{kg} \\ W t=\acute{h3}-\acute{h4}=C p g\left(\acute{T}_3-\acute{T}_4\right)=1.15 \times(1608-930) =779 \mathrm{~kJ} / \mathrm{kg} \\ W n e t=w t-w c =C p g\left(\acute{T}_3-\acute{T}_4\right)-C p a\left(\acute{T}_2-T_1\right)\end{gathered}$ (11)
$W \text { net }=W t-W C=C p g\left(\acute{T}_3-\acute{T}_4\right)-C p a\left(\left(\acute{T}_2-T_1\right)=779-396=\right.\mathbf{3 8 3 ~ k J} / \mathrm{kg}$
Power output $=Wnet × m=383 \times 190=72.7 \mathrm{MW}$.
Real specific W net $=$ Power output $/$ total mass flow rate.
Real specific W net = 72.7 / 398 = 182 kJ/kg.
2.3.5 The equations of thermal efficiency above (5.6,7) [29]
At $T_1$ = 25°C thermal efficiency of the turbine.
$\begin{aligned} & \eta t h=W \text { net } / Q i=C p g\left(\acute{T}_3-\acute{T}_4\right)-C p a\left(\left(\acute{T}_2-T_1\right) / C p g\left(\acute{T}_3-\right.\right. \left.\acute{T}_2\right) \\ & \eta t h=383 / 1.15(1608-692)=362 / 1048=36.4 \% \\ & \text { Cp air }=1.005, \mathrm{Cp} \text { gas }=1.15 \mathrm{kJ} / \mathrm{kg}\ \mathrm{k} \\ & \text { SFC }=3600 \times \mathrm{mf} / \text { power output }=3600 \times 7.75 / 72.7=0.385 \\ & \mathrm{~kg} / \mathrm{kW} . \mathrm{h} \\ & \text { HR }=\text { SFC } \times \mathrm{LHV}=0.385 \times 28.580=11.003 \mathrm{~kJ} / \mathrm{kW} . \mathrm{h}\end{aligned}$
The values of SFC and HR are shown in the Figure 8 and Figure 9.
where, SFC: Specific fuel consumption HR: Heat rate.
Emission fuel = fuel consumption × emission factor of CO2 (11) [31].
Emission fuel = 0.385 kg/KWh × 34.260 kWh = 13.190 kg/hour

Figure 8. SFC increases with rising ambient temperatures T1 (℃)

Figure 9. HR rises with the increase of ambient temperature T1 (℃)
Table 5. Parameters and working results for GTPP
|
T1 (℃) |
T3 (℃) |
T4 (℃) |
Total Mass Flow Rate (ma kg/s) |
Power Output (MW) |
SFC (kg/kW.h) |
HR (kJ/kW.h) |
|
15 |
1325 |
652 |
197 |
77.5 |
0.357 |
10.150 |
|
25 |
1335 |
657 |
190 |
72.7 |
0.385 |
11.003 |
|
35 |
1350 |
666 |
175 |
66.5 |
0.400 |
11.400 |
|
50 |
1365 |
675 |
155 |
56.7 |
0.495 |
14.181 |
2.3.6 Improve phase
The enhanced step of the DMAIC seeks to explore ways to lessen and address the root cause or causes after they have been identified [26]. According to experience and common sense dictated the exists a correlation between (ambient temperature and mass flow rate of GTPP). To do this and in order to analyze the experiment’s results, a two-way analysis of variance (ANOVA) was used. ANOVA is a statistical model for comparing differences among means of more than two cases [26]. However, if there are two sources of data, the variables that need to be evaluated in this case are the mass flow rate and the ambient temperature, necessitating the use of two-way ANOVA, a statistical method for analyzing the effects of two factors [30]. Four different GTPP temperature parameters—15, 25, 35, and 50℃—were used to analyze the two aforementioned components. The goal of improving the performance of GTPP is especially in the hot session. The members of the improvement team, the production engineer and production operator in particular, had process expertise and experience that was used to determine these characteristics. Two elements (the ambient temperature and the mass flow rate) were then used in the experiment, each of which had four levels. However, by employing turbine inlet air conditioning (TIAC) to lower the surrounding temperature and raise the mass flow rate and power output, the enhancing of GTPP's efficiency and performance are enhanced while boosting electric power during the hot season [31]. The Fogging system, a proven method for increasing GT production and efficiency, particularly in hot and dry climates, will be the main focus of GT intake air-cooling (TIAC) (Figure 10) [32].

Figure 10. Schematic diagram of the fogging unit incorporates to GT [31]
By implementing a fogging system in the GTPP at an ambient air temperature of 50℃ (typical of hot summer conditions), and using Aspen HYSYS simulation software [33], enhancements in air mass flow rate, power output, and overall efficiency were demonstrated, as shown in Table 6.
Fogging system. The selection of fogging system technology is critical due to its ability to generate extremely fine water droplets at high pressure, which are introduced at the compressor’s inlet. As illustrated in Table 7, the fogging system is modeled using a combination of mixer and separator units. When hot ambient air enters the mixer, demineralized water is injected through high-pressure nozzles by a high-pressure pump, producing a fine mist or fog. The heated air mixes with the fog, increasing its humidity and achieving near-saturation before exiting the mixer. The saturated air then flows into the separator, where any unevaporated water is removed. As shown in Figure 11, residual water that fails to evaporate is discharged from the bottom of the separator [32, 33]. This process increases both the mass flow rate and density of the inlet air, resulting in higher turbine output power and reduced compressor power consumption.
Table 6. The variation of parameters of GTPP without and with the fogging system
|
Items |
Without Fogging |
With Fogging |
Units |
|
The outlet temperature of compressor $T_2$ |
475 |
407 |
℃ |
|
Turbine inlet temperature $T_3$ |
1365 |
1330 |
℃ |
|
Exhaust temperature $T_4$ |
675 |
654 |
℃ |
|
Compressor work Wc |
427 |
388.9 |
kJ/kg |
|
Turbine work Wt |
793 |
777 |
kJ/kg |
|
Net power output |
56.7 |
74.9 |
MW |
|
Thermal efficiency |
35 |
36.5 |
% |
|
SFC |
0.495 |
0.371 |
kg/kW.h |
|
HR |
14.181 |
10.500 |
kJ/kW.h |
|
Total mass flow rate |
155 |
193 |
kg/s |
Table 7. Operation of fogging system parameters [32]
|
Operating Parameters |
Value |
Unit |
|
The energy of the Pump |
39.17 |
kw |
|
The temperature of the water |
20 |
℃ |
|
The pressure for Fogging |
100 |
bar |
|
The rate of water mass flow |
5 |
kg/s |
Additionally, despite the use of fogging, the relative humidity of the air exiting the cooler is maintained below 60%. The performance of the fogging system was simulated using Aspen HYSYS software, based on real operational data collected during peak summer conditions, and the results were thoroughly evaluated.

Figure 11. Schematic fogging system [31]
The current study was conducted under conditions and limitations of steady state flow energy, ignoring the mechanical losses of GT, using methane gas only as a fuel, and the humidity was less than 60% etc. Future studies will focus on enhancing the performance of GT under different conditions, in coastal areas, and with different types of fuel by using advanced technology systems.
2.3.7 Control phase
The objective of the control phase is to manage ongoing operations and institutionalize process or product innovations in order to preserve and maintain the advantages of process improvement [34]. The processes may then be monitored using design controls to make sure the enhanced processes have stayed under control. In the case of this improvement project, the organization studied the institutionalized improvements made by including the optimum parameters for the GTPP (decreasing ambient temperature by turbine inlet air colling TIAC [35], or fogging inlet cooling, and increasing mass flow rate, power output, and thermal efficiency, especially on hot days). Figure 12 and Figure 13 are used to control and sustain the enhancement of the project for customer satisfaction. This has enabled the company to maintain the gains made [36].

Figure 12. GT thermal efficiency function of the ambient temperature

Figure 13. GT power output as a function of the ambient temperature
This study shows that the goal of enhancing the performance of GTPP during peak periods and high air temperatures is not only to raise their thermal efficiency and increase energy production, but also to reduce SFC and HR, which is important from an economic point of view, as well as to decline the percentage of emission of CO2 gas and preserve the environment (greenhouse gas emissions).
GT plants should function more efficiently and ideally in accordance with the International Organization for Standardization (ISO), (T1 = 15℃ (288), $k^{\circ}$ the air pressure = 101.3 kPa (14.7 psia), and humidity 60%). But the plant hasn't been working as efficiently as it should because of the city's atmospheric conditions, which are greater than what ISO requires. To enhance the performance of GT plants in high temperature locations, it is crucial to retrofit an air cooler that will reduce the compressor inlet temperature to or close to the design temperature before compression [35]. Because GTs are air-breathing engines, their performance can be affected by anything that changes the mass flow and/or density of the air intake to the compressor, as stated in. The GE Performance Features of GTs [36]. There are several systems designed to reduce the temperature of the incoming air, including the mechanical, chiller, refrigerant cycles, fogging system, and evaporative intake air cooler. To increase GTPP's efficiency and power generation, the fogging system was selected because of its easier-to-use and lower maintenance costs. In gas power plants, the addition of an intake air cooler decreases the compressor inlet temperature, which in turn lowers the turbine inlet temperature. Besides that, there are many research to affecting the processes of the compressor (pressure ratio, flow efficiency) of gas turbine due to compressor operation impacts overall gas turbine efficiency and reliability, for example, Natural gas composition [37]. This study focused on the cooling system to enhance GTPP production; as a result, the net power output, plant efficiency, and gross work productivity of the turbine are all increased. This research used the DMAIC problem-solving technique and Six Sigma concepts to successfully enhance the operations and performance of GTPPs. Following the analysis conducted during the DMAIC's analyze and improve phases, the improvement project presented in this study discovered that rising temperatures during the hot season reduce mass flow rates, which results in a loss of power output and GTPP efficiency. As a result, customers will not be able to get enough electricity. Thus, using the analyses in this study, to demonstrate that work net, capacity, and efficiency of GTPP decline as the ambient temperature rises through a number of stages, including the following at various ambient temperatures, in addition to those displayed in Table 5. Real data acquired from plants in the hot summer was simulated using the Aspen HYSYS software program. The results of the simulation were obtained for a GTPP both with and without the air-cooling equipment. The findings indicate that when the ambient temperature was extremely high, 50℃, the input air temperature decreased while the fogging cooling system was used (Table 9).
When ambient temperature $\mathrm{T}_1$ = 50℃ = 50+273 = 323$\mathrm{k}^{\circ}$, the work net, power output, and efficiency of GTPP calculations.
The results of calculations for work net, power output, and thermal efficiency for (GTPP) are shown in the analysis phase, with different air temperatures shown in Table 8, Figure 12, and Figure 13.
This study is also primarily concerned with simulating the high-pressure fogging air intake cooling system of a GTPP. By utilizing Aspen HYSYS software and real-world operational data to simulate the GT with and without a cooling system, performance was evaluated. When a GT is simulated to run at 50℃ ambient air temperature without a cooling system, it is found that ambient air temperature increases SFC and HR while lowering net power production and thermal efficiency (Table 6). However, the temperature of the surrounding air decreased when a high-pressure fogging air intake cooling system was installed on the GT. This reduced SFC and HR while increasing net power production and thermal efficiency, as an illustration. A fogging cooling system was selected to improve the GTPP's operating parameters, efficiency, and power production since it is less costly to maintain and easier to operate. Besides that, there are" two main benefits led to the choice for using Aspen HYSYS software to represent high-pressure fogging. First, it was possible to immediately connect the plant cycle model with the first high-pressure fogging simulations created in ASPEN. Second, when applied to future projects, ASPEN's optimization capacity will help create designs that save the most energy [32].
Table 8. Resulting (Turbine working parameters) work net (w net), mass flow rate (ma), and power output from GTPP during different ambient temperatures
|
T1 (℃) |
T3 (℃) |
T4 (℃) |
Wc (kJ/kg) |
Wt (kJ/kg) |
W (net) |
Total Mass Flow Rate (ma kg/s) |
Power Output (MW) |
Thermal Efficiency (Σth %) |
|
15 |
1325 |
652 |
380 |
773.9 |
393.9 |
197 |
77.500 |
36.8 |
|
25 |
1335 |
657 |
396 |
779 |
383 |
190 |
72.7 |
36.4 |
|
35 |
1350 |
666 |
407 |
786 |
379 |
175 |
66.5 |
36 |
|
50 |
1365 |
675 |
427 |
793 |
366 |
155 |
56.7 |
35 |

Figure 14. The effect of fogging system technology on the processes of GT
Table 9. Improving results obtained without and with fogging system at 50℃ air ambient temperature by using simulation with Aspen HYSYS software
|
Working Parameters |
Without Fogging System |
With Fogging System |
Unit |
|
Ambient Temp. $T_1$ |
50 |
20 |
℃ |
|
compressor exit Temp. $T_2$ |
475 |
407 |
℃ |
|
Turbine Inlet Temp. $T_3$ |
1365 |
1330 |
℃ |
|
Exhaust Temp. $T_4$ |
675 |
654 |
℃ |
|
Compressor work wc |
427 |
388.9 |
kJ/kg |
|
Turbine work wt |
793793 |
777 |
kJ/kg |
|
Net power out put |
56.7 |
74.9 |
MW |
|
SFC |
0.495 |
0.371 |
kg/kW.h |
|
HR |
14.181 |
10.500 |
kJ/kW.h |
|
Total mass flow rate |
155 |
193 |
kg/s |
|
Efficiency thermal |
35 |
36.5 |
% |
The outcomes were used to assess how adding high-pressure fogging equipment improves plant performance (Table 9). The operational settings for the fogging unit are summarized. The reality. demonstrates how power plants in the study area, both with and without a fogging system, reduce the unit's capacity for a basic cycle at an ambient temperature of 50℃, 20% relative humidity, and 101.3 KPa of air pressure. As a result, the increase of net power output and the efficiency of GTPP before fogging system before 56.7 MW, 35% and after 74.9 MW, 36.5%, respectively, also the decrease of SFC and HR before fogging 0.495 kg/kW.h, 14.181 kJ/kW.h after fogging 0.371 kg/kW.h, 10.500 kJ /kW.h, respectively, also decline emission fuel before fogging 16,958 kg /h at 50℃, to 12,710 kg/h at 20℃ after fogging, which saved emission 4,248 kg/h. An evaluation of the effectiveness of adding a fogging unit is conducted by comparing it to a basic power plant (Figure 14).
Also, there are many studies to enhance GTPP production and decline CO2 emissions without using a cooling system, for example, Waste-heat integration/thermal recovery to improve overall plant output and flexibility [38, 39]. But the current study used a fogging cooling system to enhance GTPP production on hot days.
3.1 The simulation
The Aspen HYSYS software was used to simulate and evaluate real data collected from a plant in a hot summer.
3.2 The procedure of GT modelling with the fogging system
The GT unit was modelled in Aspen HYSYS both with and without the integration of fogging devices to evaluate performance under varying conditions. The modelling process began by selecting appropriate process components and defining a suitable thermodynamic property package, which serves as the foundation for accurately replicating the physical and thermodynamic behaviour of the system. For this application, a fogging component was created to represent the working fluids involved in the GT cycle. The chosen property package, aligned with GT operating conditions, was then associated with this component list to define the system's fluid behaviour. In modelling the fogging system, the mixer and separator blocks were used to represent the injection and separation of water droplets in the air intake stream. These units simulate the effect of fogging on increasing air density and mass flow rate into the compressor. Additionally, a complete process flowsheet was developed and is presented in the current study to illustrate the configuration of the GT cycle, including the fogging system and core components such as the compressor, combustor, and turbine.
3.2.1 The procedure of simulation
The following presumptions (Component List-1) are used in the modeling of the GT with the fogging system:
1. The component of inlet air contains 2.9% water, 76.6% nitrogen, and 20.3% oxygen by mass.
2. All parameters are constant (mass flow rate of intake, temperature, pressure, and relative humidity).
3. Pure methane CH4 is the fuel component that is utilized in GTPP.
4. No mechanical loss.is assumed.
5. The temperature and pressure at which the natural gas is supplied are 25℃ and 30 bars, respectively.
6. The efficiency of the compressor and the turbine (87%, 88%), respectively, isentropically.
7. The operating parameters for the fogging system are present in Table 7 [32].
The GT model was simulated without the fogging system shown in Figure 15.
The simulation process commenced by launching the process simulation environment after completing the preliminary setup steps. Using the model palette, key components—including the pump, mixer, separator, compressor, conversion reactor, and turbine—were placed onto the flowsheet to construct the system model. Operational analysis was then performed to evaluate the impact of the fogging unit’s pumping rate on GTPP output, inlet air temperature, and overall GT efficiency.
Figure 16 illustrates the schematic design of the simulated GTPP model equipped with the fogging system, while Figure 17 presents the corresponding process flowsheet.

Figure 15. The schematic diagram of the GT model simulated without fogging system

Figure 16. The schematic diagram of flow chart of simulated GTPP model with fogging cooling system

Figure 17. Process flow sheet for GT with fogging unit
The improving of the performance of GTPP especially in the hot session is to reduce the problems resulting from the stoppage or decline the production of the energy which causes great material losses in industry and requirements of the citizen, on the contrary the use of the technological and economic cooling systems to enhance the capacity of GTPP is the object of current study also saved economic and decline CO2 emissions.
Production capacity and GTPP efficiency are significantly reduced in regions that get high air temperatures during hot seasons. Increases in ambient temperature cause the air mass's flow rate to drop, which lowers the energy generated by GTs. In order to identify the issue and increase the efficiency and power output of a GTPP during hot seasons, as well as to save time, environment, and cost, the Six Sigma DMAIC methodology, which consists of five phases (Define, Measure, Analysis, Improve, and Control), was applied in this case study. The fogging cooling system was chosen to enhance GTPP's operating parameters, efficiency, and power production since it is easier to use and less expensive to maintain. Aspen HYSYS software was utilized to model and evaluate actual data that was gathered from the plant throughout the hot summer. The simulation's outcomes were determined for a GTPP both without and with air-cooling equipment. The data indicate that the fogging cooling system's incoming air temperature decreased. The findings demonstrated that the mass flow rate and turbine capacity decrease with increasing air temperature, resulting in a shortage of electric power from GTPP to the consumers. Furthermore, a rise in air temperature causes thermal efficiency to fall, as well as a rise in SFC, HR, and emissions of CO2. Choosing the best method or approach and resources after comparing them with other methods to help and preserve the products (product electricity). Eliminate faults, cut costs, and shorten cycle times in GTPP. As a consequence, this study proved that Six Sigma with the DMAIC approach and tools is highly successful, so many firms have used it to gain significant benefits. One of the six sigma common approaches is DMAIC to problem-solving.
The authors appreciate the collaboration of the technical staff of the ALTaji power plant for their unlimited support in providing the required data.
|
GTPP |
gas turbine power plant |
|
GT |
gas turbine |
|
W c |
work of compressor |
|
W t |
work of turbine |
|
$\eta$ th |
thermal efficiency |
|
Qin |
heat addition |
|
Cpa |
air specific heat capacity |
|
$\left(\frac{\mathbf{P}_2}{\mathbf{P}_1}\right)$ |
pressure ratio |
|
LHV |
low heat value |
|
SFC |
specific fuel consumption |
|
HR |
heat rate |
|
T1 |
ambient temperature |
|
T2 |
compressor exit temperature |
|
T3 |
turbine inlet temperature |
|
T4 |
turbine exit temperature |
|
Cpg |
gas specific heat capacity |
|
P2 |
compressor exit pressure |
|
h |
ideal enthalpy |
|
Wnet |
net of work |
|
$\acute{T}_2$ |
actual com. tem |
|
$\acute{T}_3$ |
actual comb.tem. |
|
$\acute{T}_4$ |
actual tur.tem. |
|
$\eta C$ |
isetropic com.eff. |
|
$\eta T$ |
isentropic tur.eff. |
|
$p_{\text {output }}$ |
out put power |
|
$\acute{h}$ |
actual enthalpy |
|
m |
mass flow rate |
[1] Sammour, A.A., Komarov, O.V., Qasim, M.A., Almalghouj, S., Dakkak, A.M.A., Du, Y. (2023). Ambient conditions impact on combined cycle gas turbine power plant performance. Energy Sources Part a Recovery Utilization and Environmental Effects, 45(1): 557-574. https://doi.org/10.1080/15567036.2023.2172100
[2] Sofia, E., Putra, N., Gunawan, B.A. (2021). Evaluation of indirect evaporative cooling performance integrated with finned heat pipe and Luffa Cylindrica fiber as cooling /wet media. Journal of Advanced Research in Experimental Fluid Mechanics and Heat Transfer, 3(1): 16-25.
[3] Martin, N.A., Rivai, N.N.I., Amir, N.R.D., Nasruddin, N. (2021). Exergoeconomic analysis of 21.6 MW gas turbine power plant in Riau, Indonesia. Journal of Advanced Research in Fluid Mechanics and Thermal Sciences, 84(1): 126-134. https://doi.org/10.37934/arfmts.84.1.126134
[4] Hada, S., Tsukagoshi, K., Masada, J., Ito, E. (2012). Test results of the world’s first 1,600℃ J-series gas turbine. Mitsubishi Heavy Industries Technical Review, 49(1): 18-23.
[5] Dick, E. (2015). Fundamentals of turbomachines. In Fluid Mechanics and Its Applications. https://doi.org/10.1007/978-94-017-9627-9
[6] Wirani, A.P., Saroso, D.S., Purba, H.H. (2020). Innovation of quality improvement to reduce weld defect through six sigma methods in the fabrication process of power plant component. IOP Conference Series Materials Science and Engineering, 852(1): 012064. https://doi.org/10.1088/1757-899x/852/1/012064
[7] Syafwiratama, O., Hamsal, M., Purba, H.H. (2016). Reducing the nonconforming products by using the Six Sigma method: A case study of a polyes-ter short cut fiber manufacturing in Indonesia. Management Science Letters, 7: 153-162. https://doi.org/10.5267/j.msl.2016.12.001
[8] Garza-Reyes, J.A., Oraifige, L., Soriano-Meier, H., Harmanto, D., Rocha-Lona, L. (2010). An empirical application of Six Sigma and DMAIC methodology for business process improvement. Seminar Presentation Presented to: 20th International Conference on Flexible Automation and Intelligent Manufacturing. http://nectar.northampton.ac.uk/3135/.
[9] Baakeem, S.S., Orfi, J., Al-Ansary, H. (2018). Performance improvement of gas turbine power plants by utilizing turbine inlet air-cooling (TIAC) technologies in Riyadh, Saudi Arabia. Applied Thermal Engineering, 138: 417-432. https://doi.org/10.1016/j.applthermaleng.2018.04.018
[10] Omidvar, B. (2001). Gas turbine inlet air cooling system. The 3rd Annual Australian Gas Turbine Conference, Melbourne, Australia 2001 Dec.
[11] Ukwuaba, S.I., Agberegha, O.L., Mohammed, B.A. (2020). Analysis and performance evaluation of gas turbine by incorporating a wetted evaporative media cooler. International Journal of Engineering and Advanced Technology (IJEAT), 8(2): 226-232.
[12] Kadhim, H.J., Kadhim, T.J., Alhwayzee, M.H. (2020). A comparative study of performance of Al-Khairat gas turbine power plant for different types of fuel. IOP Conference Series Materials Science and Engineering, 671(1): 012015. https://doi.org/10.1088/1757-899x/671/1/012015
[13] Alhazmy, M.M., Jassim, R.K., Zaki, G.M. (2006). Performance enhancement of gas turbines by inlet air-cooling in hot and humid climates. International Journal of Energy Research, 30(10): 777-797. https://doi.org/10.1002/er.1184
[14] Mohapatra, A.K., Sanjay, N. (2014). Thermodynamic assessment of impact of inlet air cooling techniques on gas turbine and combined cycle performance. Energy, 68: 191-203. https://doi.org/10.1016/j.energy.2014.02.066
[15] Orhorhoro, E.K., Achimnole, E.N., Onogbotsere, M.O., Oghoghorie, O. (2017). Simulation of gas turbine power plant using high pressure fogging air intake cooling system. European Journal of Advances in Engineering and Technology, 4(9): 691-696.
[16] Sammour, A.A., Komarov, O.V., Lattieff, F.A., Qasim, M.A., Saleh, A.Y. (2024). Influence of surrounding air temperature and humidity upon the performance of a gas turbine power plant. Journal of Advanced Research in Fluid Mechanics and Thermal Sciences, 112(1): 22-37. https://doi.org/10.37934/arfmts.112.1.2237
[17] Ibrahim, T.K., Mohammed, M.K., Al Door, W.H.A., Al-Sammarraie, A.T., Basrawi, F. (2019). Study of the performance of the gas turbine power plants from the simple to complex cycle: A technical review. Journal of Advanced Research in Fluid Mechanics and Thermal Sciences, 57(2): 228-250.
[18] Elberry, M., Abdel-Rahman, A., Attia, A., Teamah, M., Elsafty, A. (2017). An economic and environmental analysis of a combined cycle power plant, improved by using a gas turbine inlet air cooling. WSEAS Transactions on Heat and Mass Transfer, 12: 62-71.
[19] Farzaneh-Gord, M., Deymi-Dashtebayaz, M. (2010). Effect of various inlet air cooling methods on gas turbine performance. Energy, 36(2): 1196-1205. https://doi.org/10.1016/j.energy.2010.11.027
[20] Alhwayzee, M., Kadhim, H.J., Rashid, F.L. (2021). Aspen plus simulation for performance improving of Al-Khayrat power plant using heat recovery steam generation (HRSG) system. Journal of Mechanical Engineering Research and Developments, 44(4): 400-411.
[21] Barbu, E., Vilag, V., Popescu, J., Gherman, B., Petcu, A., Petcu, R., Silivestru, V., Prisecaru, T., Cretu, M., Olaru, D. (2015). The influence of inlet air cooling and afterburning on gas turbine cogeneration groups performance. InTech eBooks. https://doi.org/10.5772/59002
[22] Aweid, R.S., Mustafa, A.N., Ali, O.M., Ali, B.M. (2025). Thermal, environmental, and economic analysis of the gas turbine fogging system. Results in Engineering, 25: 103952. https://doi.org/10.1016/j.rineng.2025.103952
[23] Marin, G., Mendeleev, D., Osipov, B., Akhmetshin, A. (2020). Study of the effect of fuel temperature on gas turbine performance. E3S Web of Conferences, 178: 01033. https://doi.org/10.1051/e3sconf/202017801033
[24] Jirasukprasert, P., Garza-Reyes, J.A., Kumar, V., Lim, M.K. (2014). A Six Sigma and DMAIC application for the reduction of defects in a rubber gloves manufacturing process. International Journal of Lean Six Sigma, 5(1): 2-21. https://doi.org/10.1108/ijlss-03-2013-0020
[25] Nonthaleerak, P., Hendry, L. (2008). Exploring the six sigma phenomenon using multiple case study evidence. International Journal of Operations & Production Management, 28(3): 279-303. https://doi.org/10.1108/01443570810856198
[26] Pyzdek, T. (2014). The Six Sigma Handbook: A Complete Guide for Green Belts, Black Belts, and Managers at All Levels. McGraw-Hill. https://ci.nii.ac.jp/ncid/BA62621995.
[27] Coleman, S. (2001). Managing Six Sigma, F. W. Breyfogle III, J. M. Cupello and B. Meadows, John Wiley & Sons, New York, 288 pages, £35.95. ISBN 471396737. Quality and Reliability Engineering International, 17(6): 472-473. https://doi.org/10.1002/qre.431
[28] Kakaras, E., Doukelis, A., Prelipceanu, A., Karellas, S. (2005). Inlet air cooling methods for gas turbine based power plants. Journal of Engineering for Gas Turbines and Power, 128(2): 312-317. https://doi.org/10.1115/1.2131888
[29] Ibrahim, T.K., Rahman, M.M., Abdalla, A.N. (2011). Improvement of gas turbine performance based on inlet air cooling systems: A technical review. International Journal of Physical Sciences, 6(4): 620-627. https://doi.org/10.5897/IJPS10.563
[30] El-Badri, S.M., Muftah, A.F., Alsadi, S., Almahdy, T. (2022). Turbine output improvement by lowering the ambient temperature and elimination of Humidity: Case study North Benghazi power plant. International Journal of Management Studies and Social Science Research, 4: 62-72.
[31] Yazdi, M.R.M., Ommi, F., Ehyaei, M., Rosen, M.A. (2020). Comparison of gas turbine inlet air cooling systems for several climates in Iran using energy, exergy, economic, and environmental (4E) analyses. Energy Conversion and Management, 216: 112944. https://doi.org/10.1016/j.enconman.2020.112944
[32] Kadhim, H.J., Abbas, A.K., Kadhim, T.J., Rashid, F.L. (2023). Evaluation of gas turbine performance in power plant with high-pressure fogging system. Mathematical Modelling and Engineering Problems, 10(2): 605-612. https://doi.org/10.18280/mmep.100230
[33] Ikpe, A.E., Iluobe, I.C., Imonitie, D.I. (2020). Modelling and simulation of high pressure fogging air intake cooling unit of Omotosho phase II gas turbine power plant. Journal of Applied Research on Industrial Engineering, 7(2): 121-136. https://doi.org/10.22105/jarie.2020.216680.1129
[34] Stamatis, D. (2003). Six Sigma Fundamentals: A Complete Introduction to the System, Methods, and Tools. Productivity Press.
[35] Matjanov Erkinjon, K., Axrorxojaeva Zarina, M., Xolmurzaeva Shaxnoza, I., Ulugmurodov Mirmuhsin, T. (2021). Gas turbine efficiency improvement using absorption chiller and solar energy. Editor Coordinator, 446.
[36] Poku, R., Ogbonnaya, E.A. (2014). Effects of evaporative cooling on the performance of a gas turbine plant operating in Bayelsa State, Nigeria. International Journal of Engineering and Technology, 4(8): 476-482.
[37] Fujita, D, Miyazaki, T (2024) Investigating the effect of natural gas composition on centrifugal gas compressors used in gas turbine power plants. Journal of Energy Production and Management, 9(3): 181-186. https://doi.org/10.18280/ijepm.090307
[38] Jessam, R.A., Chua, H.J. (2023). Experimental evaluation of a hybrid inclined solar chimney for power generation. Journal of Energy Production and Management, 8(2): 81-87. https://doi.org/10.18280/ijepm.080204
[39] Al-Kayiem, H.H., Wahhab, H.A.A., Jamil, L.E.A., Mohamed, M.M., Mohamed, I.M. (2023). Evaluation of 15-m-height solar chimney model integrated with TES under tropical climate. International Journal of Energy Production and Management, 8(4): 211-218. https://doi.org/10.18280/ijepm.080402