Filippo Busato![]() | Marco Noro*
| Marco Noro*![]()
© 2025 The authors. This article is published by IIETA and is licensed under the CC BY 4.0 license (http://creativecommons.org/licenses/by/4.0/).
OPEN ACCESS
Assessing energy savings is a complex task due to the lack of direct measurement tools. Meters record consumption, but there is no direct way to measure savings. Instead, savings are estimated by comparing the projected consumption without efficiency improvements to the actual consumption after the interventions. This is not a strict before-and-after comparison but rather an evaluation that accounts for variables such as climate conditions, operational factors, and other influences on energy consumption. This paper is based on real-world applications, carried out within the energy diagnosis process and supported by the implementation of the IPMVP® protocol. The study focuses on the economic analysis of some investments, highlighting the importance of determining their profitability, which can influence their attractiveness to an Energy Service Company (ESCO). The results of sensitivity analyses are reported, focusing on evaluations based on assumptions that are particularly important, especially in times of high uncertainty regarding energy prices, interest rates, and energy production scenarios. The paper reports on these analyses, identifying key parameters to focus on and establishing suitable criteria for decision-making.
conversion factors, economic parameters, energy efficiency, energy parameters, IPMVP®
Energy Efficiency First is a far-reaching guiding principle embedded in the Energy Efficiency Directive (EU/2018/2002) [1], recently revised by Directive EU/2023/1791 [2], and its implementation is supported by the Commission Recommendation (EU) 2021/1749 [3]. It sets an obligation for EU countries to ensure that energy efficiency solutions are considered in planning, policy, and investment decisions in both the energy and non-energy sectors. This results in the development and ensuring the application of cost-benefit assessment methodologies that include a proper assessment of the wider benefits of energy efficiency solutions from the societal perspective, for example, in the areas of sustainability, climate neutrality, and green growth. As a main idea, the principle of energy efficiency first aims to ensure that only the energy really needed is produced, and that demand for energy is reduced and managed in a cost-effective way.
Focusing on energy efficiency studies in industry sector, in the study [4], it was demonstrated that at the beginning and middle stage of industrialization, there exists a unidirectional relation between economic growth and electricity consumption, which implies that a policy to reduce energy consumption makes little difference to gross domestic product. Instead, in this study [5], the expected energy and economic results of different cogeneration plants were compared with real performance and economic profitability, highlighting that, in the design phase, the simple payback time is usually underestimated.
Businge et al. [6] analysed more than 2,500 energy efficiency measures implemented in Italian industries in 10 years to identify the best practices and estimate the energy savings potential achievable by each industrial sector. The study investigated the impact of energy efficiency on the economic performance and competitiveness of companies according to technical feasibility and economic sustainability criteria.
More recently, a study on the effect of energy efficiency analysis in industrial investments was developed in China [7, 8]. In the study [9], a comprehensive reference was presented to optimise energy savings designs in residential buildings, balancing economic considerations with environmental sustainability, focusing on energy savings and insulation strategies. On this topic, the Authors of the present paper analyzed the energy impact of building insulation materials in Italy, taking into account both the savings in the annual climatization and the energy consumed to produce them (Life Cycle Assessment, LCA) [10]. An economic analysis (Life Cycle Cost, LCC) was also developed. Furthermore, Gao et al. [11] presented an assessment of energy and exergy efficiency of the steam system in a cigarette factory, which allowed them to propose an energy-saving retrofit plan using the waste heat from the combustion gas to provide hot water.
The authors of the present article also analysed different energy efficiency interventions in industry from both an energy and an economic point of view. In the research [12], the energy performance of a hybrid heating system of an industrial building in different climatic zones of Italy was evaluated by optimising different parameters. The optimal configuration was compared with some more traditional heating systems for industrial buildings to evaluate the energy and economic advantages of this innovative solution. In this study [13], the coupling of a high-temperature heat pump with a combined cooling, heat, and power system was investigated to analyse energy performance by varying different parameters and comparing them with traditional systems for energy production.
1.1 Scope and novelty of the study
In all the studies cited, key parameters such as the interest rate and inflation rate are always kept constant during the period of analysis. The aim of this work is to provide some food for thought for the quantification of long-term savings determined by energy saving interventions in a scenario of a high inflation rate of the price of energy (primary and vectors), considering also the effect on real interest rates.
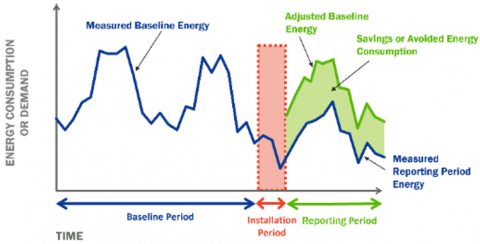
The determination of savings is carried out according to the IPMVP® protocol for some real cases presented here [14]. The IPMVP® protocol for the measurement and verification of energy savings, in addition to being a shared formal reference (referred to by international regulations, for example, by ISO 50015:2014) for Energy Performance Contracts (EPC), is a tool that can be widely used in different contexts [15]. In essence, it makes systematic what, at an intuitive level, is an extremely logical “way of thinking”. Since there are meters for measuring energy consumption but there are not measuring instruments for energy savings, these can be calculated on the basis of a basic principle: savings are not the difference between consumption in the year before the intervention and consumption in the year after the intervention, but the difference between consumption that would have occurred the following year in the absence of intervention and consumption that would have occurred the year after the intervention [14]. It is the conditions that make the difference, and they are precisely the conditions (climatic, production planning, and many more) that determine the method of calculating these savings. As a matter of fact, savings are determined by comparing measured consumption before and after the implementation of an energy savings project, making appropriate adjustments for changes in conditions (Figure 1).
Figure 1. Determination of energy savings according to the IPMVP® protocol (courtesy of the Efficiency Valuation Organisation)
2.1 Energy and economic-financial parameters
The calculation of energy and economic savings is essential to monitor the trend over time of the effectiveness of the energy efficiency increase intervention that has been implemented. An important aspect that is usually not considered in the analyses is the variability over time of the parameters that were assumed to be fixed in the intervention design phase. Such parameters may vary even with significant amplitude in the medium term.
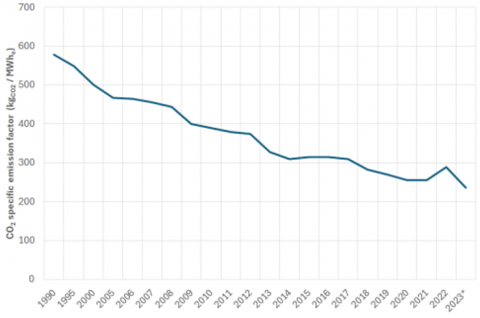
As an example, Figure 2 shows the carbon dioxide emission factor in electrical use (referring to consumption), from an institutional source [16]. Between 2007 and 2012 (5 years), it dropped from 455.3 to 374.3 kgCO2/MWhe (-18%), while between 2018 and 2023, it decreased from 282.1 to 236.3 kgCO2/MWhe (-16%). The downward trend in emission factors translates into lower long-term effectiveness of the intervention for a given reduction in electricity consumption.
Figure 2. Carbon dioxide emission factor for electricity consumption in Italy (data for 2023 are not definitive)
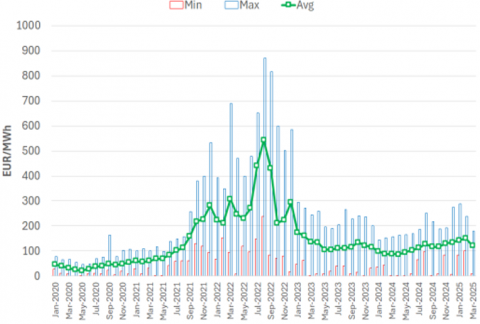
From an economic point of view, similar reasoning can be made in terms of valorising energy savings. For the same amount of electricity saved, an increase in the national single price (Prezzo Unico Nazionale in Italian, PUN) generates a significant increase in savings (Figure 3). The financial evaluation of an investment in energy (electricity) savings carried out with the prices of the end of 2021 (around 80 EUR/MWhe) has been revalued in an extremely positive way by the increase in prices in 2022 (543 EUR/MWhe average in August 2022). Given that this increase in prices has had significant and serious consequences for some EPC contracts indexed on the PUN, the situation experienced in Italy during 2022 has been extraordinary (even if predictable, on a qualitative but perhaps not quantitative level) and will probably not be repeated. However, it is worth remembering that California in 1999 experienced a very similar phenomenon (with other causes), with the equivalent of the PUN that had reached over 1000 USD/MWhe, therefore, these are not eventualities that can be excluded a priori. The following paragraphs, thanks to a case study, aim to draw attention to the delicate use of economic and financial analysis in evaluating the convenience of energy efficiency interventions.
Figure 3. Monthly average, maximum, and minimum PUN values from January 2020 to March 2025 (data from https://gme.mercatoelettrico.org/it-it/)
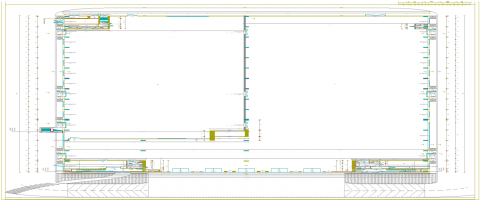
Figure 4. Floor plan of the manufacturing area
Figure 5. The new die-cutting machine
2.2 Description of the case study
The determination of savings according to the IPMVP® protocol can be carried out using four different methodologies:
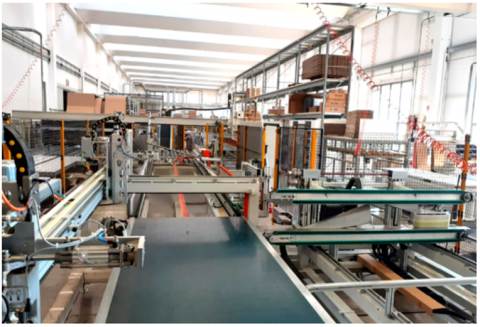
The case study presented here refers to a company that produces wooden office furniture. The company is located in the Province of Padova (North-East of Italy). In 2021, it had a turnover of 20.1 M€ and a total of 96 employees. The manufacturing area is presented in the floor plan in Figure 4. The study focuses on the savings deriving from the substantial modification in the production processes: the assembly process has been redefined by the replacement of the die-cutting machine (Figure 5) and packaging line (Figure 6), an intervention that is characterized by technological and management aspects. The operation was carried out according to the POR FESR 2014-2020 call (Veneto Region), concerning the “replacement of production cycles with cycles that lead to a demonstrated reduction in electrical/thermal consumption compared to the situation before the intervention, also calculated per unit of product”. The company was not equipped with a punctual energy monitoring system, therefore the option C mentioned above was adopted for calculating savings.
Figure 6. Part of the newly installed packaging line
The pre-intervention reference period was the entire 2019 year, while the reporting period for calculating savings was the entire 2021 year. The two energy diagnoses developed according to the ENEA protocol pursuant to Legislative Decree 102/2014 [16] were drawn up, one for the year 2019 and the second for the year 2021, the data reported are those processed in the two energy diagnoses.
3.1 Savings assessment with the IPMVP® methodology
The results of the intervention are summarised as reported in Table 1 [17]. The formula adopted to calculate savings is the following (Eq. (1)):
$S=E_{\text {ref }}-E_{\text {rep }} \pm adjustments$ (1)
where,
S = energy savings;
Eref = energy consumed during the reference period
Erep = energy consumed during the reporting period;
adjustments = appropriate adjustments for changes in conditions.
Table 1. Energy and CO2 emissions results summary
|
|
Before Intervention |
After Intervention, Reporting |
After Intervention - Backcasting |
Absolute Savings - Backcasting |
Relative Savings - Backcasting |
|
Year |
2019 |
2021 |
2021 |
|
|
|
Electric energy (kWhe) |
1,629,828 |
1,476,319 |
702,362 |
927,466 |
57% |
|
Natural gas (Sm3) |
117,730 |
128,455 |
61,113 |
56,617 |
48% |
|
Quantity of production (kg) |
2,334,090 |
4,906,103 |
2,334,090 |
|
|
|
Emissions (tCO2) |
689,595 |
683,001 |
324,939 |
364,656 |
53% |
|
Non-renewable primary energy (kWhp) |
4,674,804 |
4,514,766 |
2,147,911 |
2,526,893 |
54% |
|
Non-renewable primary energy (toe) |
402 |
388 |
185 |
217 |
54% |
Table 2. Electricity consumption before intervention (year 2019)
|
Month |
F1 (kWhe) |
F2 (kWhe) |
F3 (kWhe) |
Electric Power (kWe) |
Exceeding Available Power Limit (kWe) |
Total (kWhe) |
Total (toe) |
|
January |
83,399 |
15,017 |
6,529 |
545 |
52 |
104,945 |
19.6 |
|
February |
153,456 |
34,647 |
14,685 |
564 |
33 |
202,788 |
37.9 |
|
March |
97,490 |
34,726 |
13,738 |
566 |
30 |
145,954 |
27.3 |
|
April |
92,350 |
29,174 |
13,565 |
569 |
28 |
135,089 |
25.3 |
|
May |
100,630 |
35,106 |
14,461 |
573 |
24 |
150,197 |
28.1 |
|
June |
89,849 |
35,210 |
17,839 |
595 |
1 |
142,898 |
26.7 |
|
July |
107,217 |
36,981 |
3,701 |
569 |
27 |
147,899 |
29.5 |
|
August |
31,114 |
7,350 |
7,299 |
573 |
23 |
45,763 |
8.6 |
|
September |
103,978 |
33,116 |
14,513 |
577 |
20 |
151,607 |
28.4 |
|
October |
107,301 |
33,424 |
14,318 |
588 |
9 |
155,043 |
29.0 |
|
November |
95,825 |
33,110 |
14,911 |
597 |
0 |
143,846 |
26.9 |
|
December |
69,546 |
21,918 |
12,335 |
567 |
30 |
103,799 |
19.4 |
|
Total |
1,132,155 |
349,779 |
147,894 |
573 |
23 |
1,629,828 |
306.6 |
Adjustments are made according to the “backcasting” technique, that is, adapting the energy consumption of the reporting period to the conditions of the reference period. In the case here considered, the adjustment factor is the quantity of production in terms of mass (kg). Therefore, Eq. (1) becomes Eq. (2):
$E_{ {adj, } 2021}=\frac{E_{ {rep, } 2021}}{Q_{ {product, } 2021}} \cdot Q_{{product, } 2019}$ (2)
where,
Eadj,2021 = energy consumed during the reporting period (2021) adjusted;
Erep,2021 = energy consumed during the reporting period (2021);
Qproduct,2021 = quantity of product during the reporting period (2021);
Qproduct,2019 = quantity of product during the reference period (2019).
The primary energy conversion factors adopted are:
Moreover, as far as electricity is concerned, the reduction in consumption was not only in relative terms (-57%) but also in absolute terms (1,476 MWhe vs 1,630 MWhe). The intervention led to a reduction in (non-renewable) primary energy consumption (per unit produced) of 54%. Without the “backcasting” adjustment, the reduction would have been only 3.4%.
3.2 Analysis based on electric energy consumption
Table 2 presents the electricity consumption before the intervention on a monthly basis per time slot. In Italy, electric energy has different costs based on the F1, F2, and F3 time slots according to the following description:
As reported in the table, there is no influence of seasonality on electricity consumption; it can be deduced that energy consumption for summer air conditioning is negligible compared to other consumption (in particular production). The greatest part of pre-intervention electricity consumption is in time slot F1, with 70% of the total. There are also some exceedances of the available power limit.
Table 3. Electricity cost before intervention (year 2019)
|
Month |
Real Energy (EUR) |
Network Services (EUR) |
Taxes and Surcharges (EUR) |
Total (VAT Excluded) (EUR) |
Average Cost Energy (EUR/kWhe) |
|
January |
10,694 |
6,850 |
3,178 |
20,722 |
0.197 |
|
February |
12,598 |
7,951 |
3,795 |
24,344 |
0.120 |
|
March |
14,307 |
8,957 |
4,333 |
27,598 |
0.189 |
|
April |
13,608 |
8,789 |
4,124 |
26,520 |
0.196 |
|
May |
15,152 |
9,675 |
4,575 |
29,402 |
0.196 |
|
June |
14,311 |
9,262 |
4,322 |
27,895 |
0.195 |
|
July |
16,014 |
9,504 |
4,818 |
30,336 |
0.205 |
|
August |
5,713 |
4,188 |
1,647 |
11,547 |
0.252 |
|
September |
13,554 |
9,064 |
4,365 |
26,983 |
0.178 |
|
October |
14,795 |
9,461 |
4,624 |
28,881 |
0.186 |
|
November |
14,454 |
8,934 |
4,317 |
27,704 |
0.193 |
|
December |
10,745 |
6,866 |
3,188 |
20,800 |
0.200 |
|
Total |
155,944 |
99,501 |
47,287 |
302,733 |
0.186 |
As can be deduced from Table 3, the average cost of electricity consumed before the intervention is 19 c€/kWhe. Table 4 presents the data relating to consumption after the intervention: on the one hand, the characteristics of the curves do not change (little influence of seasonality), on the other hand, it is possible to appreciate how consumption in time slot F1 has reduced to approximately 67% of the total.
Table 4. Electricity consumption after the intervention (year 2021)
|
Month |
F1 (kWhe) |
F2 (kWhe) |
F3 (kWhe) |
Electric Power (kWe) |
Total (kWhe) |
Total (toe) |
|
January |
73,575 |
19,845 |
15,533 |
972 |
108,953 |
20.4 |
|
February |
58,023 |
20,311 |
13,826 |
972 |
92,160 |
17.2 |
|
March |
108,450 |
31,351 |
15,803 |
972 |
155,604 |
29.1 |
|
April |
95,824 |
30,260 |
13,461 |
972 |
139,545 |
26.1 |
|
May |
99,276 |
31,125 |
14,735 |
972 |
145,136 |
27.1 |
|
June |
75,103 |
24,469 |
12,363 |
972 |
111,935 |
20.9 |
|
July |
104,789 |
41,272 |
20,672 |
972 |
166,733 |
31.2 |
|
August |
35,109 |
7,854 |
8,491 |
972 |
51,454 |
9.6 |
|
September |
104,413 |
37,237 |
15,775 |
972 |
157,425 |
29.4 |
|
October |
79,725 |
28,213 |
10,431 |
972 |
118,369 |
22.1 |
|
November |
103,876 |
36,889 |
17,208 |
972 |
157,973 |
29.5 |
|
December |
51,489 |
13,701 |
5,842 |
972 |
71,032 |
13.3 |
|
Total |
989,652 |
322,527 |
164,140 |
972 |
1,476,319 |
276.1 |
Table 5. Electricity costs after intervention (year 2021)
|
Month |
Total (VAT Excluded) (EUR) |
Average Cost Energy (EUR/kWhe) |
|
January |
22,031 |
0.202 |
|
February |
25,804 |
0.280 |
|
March |
19,805 |
0.127 |
|
April |
25,487 |
0.183 |
|
May |
29,001 |
0.200 |
|
June |
24,654 |
0.220 |
|
July |
33,916 |
0.203 |
|
August |
12,456 |
0.242 |
|
September |
43,868 |
0.279 |
|
October |
41,895 |
0.354 |
|
November |
30,846 |
0.195 |
|
December |
15,135 |
0.213 |
|
Total |
324,900 |
0.220 |
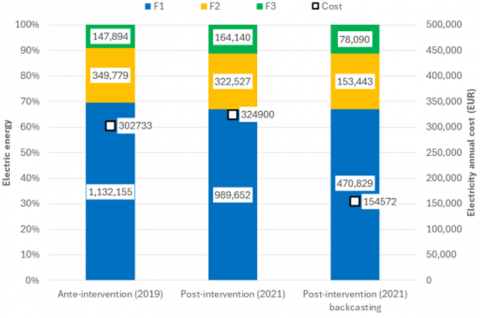
Table 5 shows how, in the two years, the average cost of electricity increased to 22.5 c€/kWhe, that is 17.8% more than the 2019 value, with an average increase of approximately 9% per year.
Figure 7. Comparison of electricity consumption and costs, before and after the intervention
Finally, Figure 7 presents a summary of electricity consumption and costs in a comparison between 2019 and 2021.
3.3 Impact of variation of electric energy cost
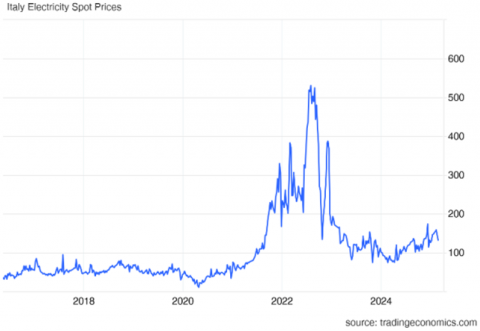
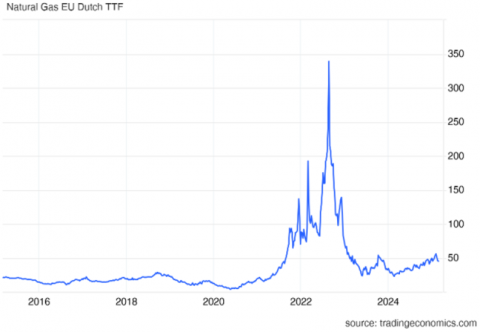
As in the previous section, electricity is taken into consideration in the following considerations. A similar but perhaps less interesting discussion could be made for natural gas, but hourly load curves were not available. The particularly lively period from the point of view of variations in the cost of energy (Figure 8) pushes the reflection toward two further questions:
(a)
(b)
Figure 8. (a) Italy electricity spot prices (EUR/MWhe) and (b) Natural Gas EU Dutch TTF (EUR/MWhp) (updated to 5 March 2025)
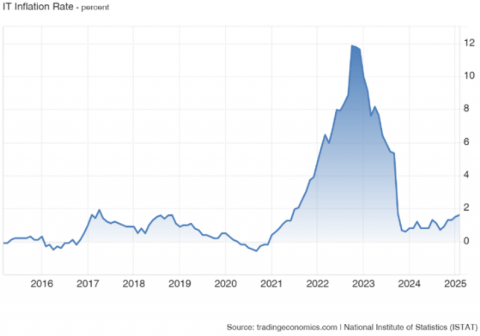
On the other hand, inflation represents the loss of purchasing capacity of money, and in subsequent years it relates the values of cash flows “in current money” (that exchanged in the year to which it refers) with those “in constant money” (that exchanged in a specific year, for example, year “0” in which an energy saving investment is made). Therefore, the monetary interest rate (im) allows the creation of appropriate equivalence relationships between cash flows that occur in different years, while inflation ($\beta$) measures the difference in the purchasing capacity of money over time [18]. Eq. (3) allows to transform the monetary interest rate im into the real interest rate ir:
$i_r=\frac{i_m-\beta}{1+\beta}$ (3)
Figure 9. Inflation rate in Italy during the last 10 years
As can be seen, inflation reduces the monetary interest rate (thereby inducing the propensity to borrow money). In short, if the interest rate erodes future (and distant in time) cash flows, inflation limits this erosion.
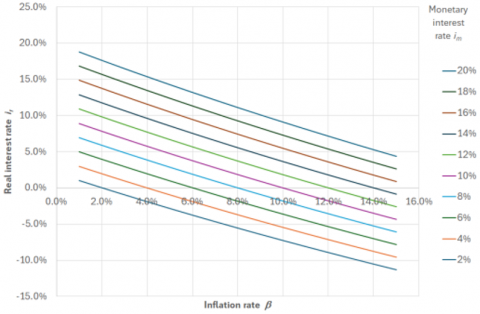
Figure 10. The relationship between monetary interest rate and real interest rate as a function of inflation rate
Figure 10 presents the combined effect of monetary interest and inflation in determining the real interest rate. It can be seen that when inflation exceeds the value of the monetary interest rate, the real interest actually becomes negative.
Following the technique known as O-ML-P (Optimistic – Most Likely – Pessimistic), three scenarios foresee three different levels of average inflation of the price of energy products for the evaluation of savings in electricity expenditure:
As a matter of fact, the higher the inflation rate, the higher the cost of energy, and thus the economic savings.
It is then interesting to evaluate what happens in multiple scenarios when the discounting of the cash flow is performed as a function of the real interest rate (a combination of a monetary interest rate and inflation). Two borderline cases for im (4 and 20%) and three cases for general inflation $\beta$ (3-8-15%) were considered. Table 6 presents the calculation of the NPV (sum of all discounted home flows) of the ML scenario, for all possible interest/inflation pairs. As can be easily understood, the range of expected results diverges considerably when the values of ($\beta$;im) are varied:
- the case with modest inflation and high interest (3%;20%) significantly reduces the value of future cash flows;
- the case with moderate inflation and low interest (8%;4%) (negative real rate) presents a very high NPV;
- the case of the couple (3;4%) and that of the couple (15%;20%), although the numbers are in the same ratio, give only similar, but not identical, results.
Table 6. Possible scenarios for the NPV of savings (NPV are in EUR)
|
|
β |
3% |
8% |
15% |
|
im |
4% |
2,423,396 |
3,242,639 |
4,899,349 |
|
20% |
1,124,410 |
1,423,410 |
2,001,205 |
In a period of high inflation, it is crucial to carefully assess cash flows and the joint effect of inflation and interest rates. Therefore, an important ingredient is added to the economic analysis.
The case examined demonstrates how the assumptions made until a few years ago for economic analyses (interest rates, negligible inflation) must be carefully reconsidered.
The authors want to thank Dr. Roberta D’Orazio (Innovation manager) and Caccaro srl (Villa del Conte, Padova) for the data provided.
[1] European Commission. (2018). Directive (EU) 2018/2002 of the European Parliament and of the Council of 11 December 2018 amending Directive 2012/27/EU on energy efficiency. https://www.legislation.gov.uk/eudr/2018/2002.
[2] European Commission. (2023). Directive (EU) 2023/1791 of the European Parliament and of the Council of 13 September 2023 on energy efficiency and amending Regulation (EU) 2023/955 (recast). https://www.eurlexa.com/act/en/32023L1791/present/text.
[3] European Commission. (2021). Commission Recommendation of 28.9.2021 on energy efficiency first: From principles to practice. Guidelines and examples for its implementation in decision-making in the energy sector and beyond. https://energy.ec.europa.eu/system/files/2021-09/eef_recommendation_ref_tbc.pdf.
[4] Liu, L., Ma, X.Q., Mao, Z.J. (2014). Empirical study on the economic effect of energy conservation and emission reduction in different industrial stages. Advanced Materials Research, 962-965: 1541-1546. https://doi.org/10.4028/www.scientific.net/AMR.962-965.1541
[5] Badami, M., Camillieri, F., Portoraro, A., Vigliani, E. (2014). Energetic and economic assessment of cogeneration plants: A comparative design and experimental condition study. Energy, 71: 255-262. https://doi.org/10.1016/j.energy.2014.04.063
[6] Businge, C.N., Bazzocchi, F., Gobbi, E., Zagano, C. (2018). Energy efficiency for a sustainable industry: Energy saving potential for Italian manufacturing sectors and impact of energy efficiency measures on economic performance and competitiveness of enterprises. https://proceedings.eceee.org/papers/proceedings2018/2-024-18_Businge_pres.pdf.
[7] Guo, Q., You, W. (2023). Decoupling analysis of economic growth, energy consumption and CO2 emissions in the industrial sector of Guangdong Province. International Journal of Low-Carbon Technologies, 18: 494-506. https://doi.org/10.1093/ijlct/ctad040
[8] Wu, M. (2023). The impact of eco-environmental regulation on green energy efficiency in China - based on spatial economic analysis. Energy and Environment, 34(4): 971-988. https://doi.org/10.1177/0958305X211072435
[9] Shen, T., Sun, L. (2023). Evaluating energy efficiency potential in residential buildings in China’s hot summer and cold winter zones. International Journal of Heat and Technology, 41(6): 1468-1478. https://doi.org/10.18280/ijht.410609
[10] Lazzarin, R.M., Busato, F., Castellotti, F. (2008). Life cycle assessment and life cycle cost of buildings’ insulation materials in Italy. International Journal of Low Carbon Technologies, 3(1): 44-58. https://doi.org/10.1093/ijlct/3.1.44
[11] Gao, W., Zuo, X., Liu, X., Yan, L., Pang, J., Qiao, W., Xu, X., Liang, Y., Bu, Y. (2024). Energy efficiency analysis and energy-saving measures for the steam system in a cigarette factory in Zhangjiakou. International Journal of Heat and Technology, 42(4): 1173-1184. https://doi.org/10.18280/ijht.420407
[12] Noro, M., Mancin, S., Cerboni, F. (2022). High efficiency hybrid radiant and heat pump heating plants for industrial buildings: An energy analysis. International Journal of Heat and Technology, 40(4): 863-870, https://doi.org/10.18280/ijht.400401
[13] Noro, M. (2023). High temperature heat pump with combined cooling, heat and power plant in industrial buildings: An energy analysis. International Journal of Heat and Technology, 41(3): 489-497, https://doi.org/10.18280/ijht.410302
[14] EVO. (2016). IPMVP 2016 basic concepts. https://evo-world.org/en/ipmvp-current/ipmvp core-concepts/1754-2016-ipmvp-core-concepts-in-italian/file.
[15] ISO. (2014). 50015:2014 - Energy management systems — Measurement and verification of energy performance of organizations — General principles and guidance. https://www.iso.org/standard/60043.html.
[16] Salvio, M., Toro, C., Luciani, S. (2019). Energy audit pursuant to Article 8 of Legislative Decree 102/2014. ENEA. https://www.energymed.it/conviniz/atti2019/SALVIO-%20TORO%20-%20LUCIANINI.pdf.
[17] ENEA. ISPRA. (2025). https://emissioni.sina.isprambiente.it/wp-content/uploads/2025/05/Le-emissioni-di-CO2-nel-settore-elettrico_r413-2025_def.pdf.
[18] Busato, F. (2014). Analisi Economica: Fondamenti e Applicazioni al Sistema Edificio-Impianto. (Economic Analysis: Fundamentals and Applications to the Building-Plant System.)