Hadi Sasana![]() | Shinta Ratnawati*
| Shinta Ratnawati*![]() | Muhammad Hakimi Mohd Shafiai
| Muhammad Hakimi Mohd Shafiai![]() | Rochmat Aldy Purnomo
| Rochmat Aldy Purnomo![]() | Navi’ah Khusniati
| Navi’ah Khusniati![]()
© 2025 The authors. This article is published by IIETA and is licensed under the CC BY 4.0 license (http://creativecommons.org/licenses/by/4.0/).
OPEN ACCESS
With increasing global awareness of environmental issues, green entrepreneurship has become a popular choice because it is not only profit-oriented but also considers social and environmental aspects. The creative industry in tourist destinations is increasingly dependent on a combination of technological innovation, social inclusiveness, and environmentally friendly practices. This study examines the role of green entrepreneurship, inclusive innovation ecosystems, and government support in driving the performance of sustainable creative businesses in the Borobudur super-priority tourist destination area. The data was sourced from a sample of respondents, namely creative entrepreneurs in the Borobudur tourism SPD area who have implemented green entrepreneurship. Data analysis was performed using modelling Smart PLS 4. Research findings show that green entrepreneurial intention has the greatest overall influence on the sustainability of creative businesses, both directly and indirectly. The path from green entrepreneurial intention to green entrepreneurial orientation is very strong, while the path from green entrepreneurial intention to marginalized communities is also significant. Marginalized communities and green entrepreneurial orientation emerge as the most influential drivers. The variables of access to technology and managerial capacity act as enablers. Meanwhile, stakeholder collaboration and government policy support do not have a statistically significant effect, indicating governance barriers.
access to digital technology, Borobudur, green entrepreneurial intention, green entrepreneurial orientation, marginalized community, sustainable creative businesses
The green economy is seen as a middle ground between growth and environmental conservation, aiming to increase income and employment while reducing carbon emissions, improving resource efficiency, and restoring ecosystems [1]. The implementation of a green economy drives economic growth and employment by reducing carbon emissions, improving energy efficiency, and minimizing environmental degradation to achieve the Sustainable Development Goals (SDGs). Efforts to achieve the SDGs prioritize a green economy as an approach to promote environmentally friendly economic growth [2, 3]. Indonesia reaffirms its commitment through the 2022 G20 Presidency, themed “Recovery Together, Recovery Stronger” and a roadmap for the development of a green economy-based creative industry until 2030 [4].
The creative industry plays an important role in driving economic growth and job creation. The tourism and creative economy sectors contribute significantly to GDP (6.98%) and 14.66% of total employment in Indonesia [5]. The Indonesian government has set a target to support green economy-based creative industries by 2030, aiming to create jobs and promote innovation in local products. This is achieved through the integration of creative industry development with Micro, Small, and Medium Enterprises (MSMEs), which play a vital role in the national economy. Economic growth through the tourism sector, supported by the expansion of MSMEs, has a positive impact on the economy and contributes to economic development (Bank Indonesia, 2023).
Development in the region to promote community welfare must be carried out using a sustainable development model. Competitiveness is one of the parameters in the concept of sustainable regional development [6]. The Borobudur tourist area in Magelang is one of Indonesia's super-priority tourist destinations (SPD), based on green tourism with a strong emphasis on cultural preservation. Optimizing creative economic activities in the Borobudur tourist area is a positive step in supporting green economy. Initiatives by creative sector actors contribute to sustainable development while preserving cultural heritage and promoting environmentally friendly practices [4]. Green economic activities in the Borobudur tourism SPD area emphasize the optimization and preservation of natural resources, as well as local community assets through MSMEs. The majority of businesses in the Borobudur tourism area's MSME cluster support green tourism businesses, for example, by establishing the creative business Kampung Borobudur (Ministry of Tourism and Creative Economy, 2024). However, optimizing this potential faces two main challenges. First, there is limited adoption of green practices by creative businesses. Many businesses still rely on resource-intensive processes, without adequate waste management systems and energy efficiency measures. Second, there is a lack of social inclusivity. Marginalized groups-women, people with disabilities, and low-income households-have not been fully integrated into the creative value chain, resulting in economic and cultural benefits that are not distributed equitably.
Creative business activities that promote development and improve community welfare should be encouraged, while maintaining environmental sustainability and minimizing social impacts such as increased waste generation [7]. Green entrepreneurship, characterized by high green entrepreneurial intention (GEI) and green entrepreneurial orientation (GEO), is a key focus for developing a green economy in the creative industry sector. GEI measures an individual's intention to operate an environmentally friendly business; GEO reflects the strategic implementation of such intentions in product innovation, processes, and green marketing [8] and an inclusive innovation ecosystem, which emphasizes technology access, multi-stakeholder collaboration, and marginal involvement to ensure innovative solutions that are relevant to grassroots communities and socially just [9, 10].
The research gap arises because most studies separate GEI/GEO analysis from the dimension of inclusivity [11]; they focus on the context of manufacturing or technology industries rather than tourist destinations and rely on descriptive qualitative approaches. As a result, quantitative evidence regarding the social-ecological mediation mechanisms in green tourist destinations, particularly SPDs in developing countries, remains limited. This situation highlights the need for research that simultaneously examines green entrepreneurship practices, ecosystem inclusivity, and government support for sustainable creative enterprises in the Borobudur tourist SPD area.
2.1 Green economy
The United Nations Environment Programme (UNEP) states that a green economy is a way of managing the economy that improves human well-being and social equity while reducing risks to the environment and the scarcity of its resources [3]. The green economy has three main principles low-carbon economic growth, efficient use of resources, and social justice. With this approach, economic growth is not only an important factor but also prioritizes sustainability for future generations. In the creative industry, the green economy is an important foundation that will enable businesses to combine creative innovation with environmentally friendly practices. Creative industries rooted in local wisdom and natural resources, such as handicrafts, local cuisine, and performing arts, can be developed using approaches that minimize waste, conserve energy, and support environmental preservation. This model also strengthens social connections among businesses, consumers, and surrounding communities through sustainability values. Creative businesses involving marginalized groups can create broader social impacts and strengthen business social networks [12, 13].
The implementation of a green economy requires synergy between technological innovation, changes in consumption patterns, and policies that support the transition to a sustainable economic system. In the creative industry, this can be achieved through the adoption of clean technology, the use of renewable raw materials, and production systems based on recycling or the circular economy. Technology enables businesses to improve efficiency, reach broader markets, and reduce their carbon footprint through the digitalization of production and distribution processes. Digital platforms such as e-commerce, social media, and business management applications have helped MSMEs survive the crisis and expand their tourism markets. High levels of technology access also contribute to the creation of innovations that are adaptive to environmental challenges. The success of the green economy in this sector heavily depends on the awareness of businesses, as well as support from the government, academia, and consumers [14].
In Indonesia, the concept of green economy is gaining ground in national development policies, particularly in the context of tourism and the creative economy. Priority tourist areas such as Borobudur are encouraged to develop green and inclusive local economic ecosystems. Through this approach, the creative industry not only generates economic value but also serves as a social force for cultural preservation, community empowerment, and sustainable environmental protection. Government support is crucial to the success of programs aimed at transforming the creative industry into a more sustainable one. Policies that are not contextually appropriate or overly administrative can reduce their effectiveness, making the involvement of local stakeholders in policy formulation highly important. Additionally, businesses must have strong networks with stakeholders. Forms of collaboration can include training programs, business incubation, promotion of local products, and integration of business activities into the tourism ecosystem. The better the quality of collaboration among actors, the greater the likelihood of creating an inclusive and sustainable creative business ecosystem [15]. A broad network supported by good managerial skills encourages creative business actors to develop business models that are sensitive to social values and ecological sustainability.
2.2 Green entrepreneurship
Schumpeter's Innovation Theory highlights the important role of entrepreneurship and innovation in driving economic development and organizational success. When it comes to SMEs, this theory only serves to further demonstrate that firms need to innovate by introducing either new products, processes or business models in order to outdo their competition. SMEs often grow by exploiting niche markets and enhancing their ability to innovate quickly, SMEs are one of the preferred and numerous form factor organizations all set to contribute towards creating significant increase in economic activities and jobs [16]. Entrepreneurship, in its basic definition, is the act of creating value by bringing ideas to fruition through the application of an opportunity with some type of innovation and hoping for monetery gain. Entrepreneurship is an attribute of a person that can recognize opportunity, encourage the risks of acting in dynamic environments through innovation and leadership as well as create value [17]. As a result of increasing international awareness in environmental and sustainability issues, this concept has evolved into green entrepreneurship, a form of entrepreneurship that is not only profit-oriented but also considers social and environmental aspects [11]. The approach is based on two central constructs namely green entrepreneurial intention (GEI) and green entrepreneurial orientation (GEO). They are equally important in informing us, as researchers who study the way how environmental values are internalized at the individual, and organizational level in the entrepreneurial process [18].
Specifically, based on the Theory of Planned Behavior [19], GEI refers to a person's intention to establish/expand an environmentally friendly business through the confirmation of attitudes, subjective norms, and perceived behavioral control. Recent longitudinal studies have shown that the stronger the components of the Theory of Planned Behavior, the more it will lead to a significant increase in changing green entrepreneurial behavior [20]. This study measures these intentions in terms of personal desire, anticipation of actual behavior, and readiness to act. Creative business people who have a lot of GEI, are more willing to make new environmentally friendly ideas. In addition, they are more likely to help local communities and create new ways to generate economic value that do not harm the environment [19, 20], which is part of environmentally friendly entrepreneurship, where good business is not only about making money, but also saving the earth, reducing carbon emissions, and treating everyone fairly. In this context, entrepreneurship must focus on issues such as global warming, business waste, or unfair treatment of people. The tendency to start a business is influenced by psychological factors such as beliefs, others' opinions, and how one perceives their ability to act. In the context of green entrepreneurship, this also means caring about sustainability [21]. GEI is affected by many factors as shown by many studies in different contexts: environmental education, personal experience with ecological issues; influence of pro-environmental communities; global exposure to climate change, social justice and environmental degradation [22, 23]. GEI can provide creative business opportunities in the Borobudur tourism area to start new ventures that are flexible, creative, and socially and environmentally beneficial. Business activities suitable for developing green business ideas include traditional food enterprises, local crafts, and community-based ecotourism. According to Rong et al. [8], these businesses are not only rooted in local culture and stories, but also help in the preservation of natural resources and promote the area as an all-round eco-friendly tourist destination.
GEO is a broader concept than the concept of Entrepreneurial Orientation (EO), but it focuses more on the environment. GEO is a way of managing or creating a business that is based on how much attention individuals or companies pay to new ideas, initiating new plans, and their willingness to take risks in environmentally friendly work. How well a company can develop new green innovations for products, ways of working, or jobs that reduce negative impacts on the environment is closely related to GEO. It also shows how ready entrepreneurs are to take risks when using new tools or doing other things that may not provide financial benefits, but have a great opportunity to do good things for society and the environment. The concept is to stop any work that can damage air, water, soil, climate, and make people want to use or buy sustainable products. In green entrepreneurship, GEOs help companies enter the green economy, becoming more competitive, gaining a better reputation with buyers, and creating more sustainable outcomes. Other research also states that GEO is closely related to GEI and can help the development of green business [14]. GEO is proven to assist companies in achieving a better level of sustainability in corporate financial and environmental management [24]. The meta-analysis study of Asad et al. [24] shows that GEO helps in the aspect of corporate social performance so that it can function better and produce green innovation in the company. In the studies of Asad et al. [24] and Anwar et al. [25], stated that GEO is an approach consisting of several components, including willingness to take risks, act proactively, and be innovative. The existence of GEO shows how creative businesses are willing to promote new ideas, be active, and take risks by considering the social, economic, and environmental aspects of the business. In the Borobudur tourism SPD area, this orientation is important to ensure that creative entrepreneurs do not only focus on short-term profits but also build business practices relevant to global issues such as climate change and the preservation of local culture.
2.3 Inclusive innovation ecosystem
As an inclusive innovation ecosystem, it seeks more technology access, plus stakeholder cooperation along with including marginalized sectors so that grassroots-based needs are understood in the most appropriate manners. Yousaf et al. [26] said technology helps enterprises to enhance productivity and widen markets when the production and distribution processes become digitized, so that carbon emissions are minimized. Almtiri et al. [27], which Digital platforms and Social media, along with business management applications have aided to protect creative businesses from being eradicated by the crisis, ended up extending tourism markets and helping broadly in maintaining sustainable innovation in MSMEs. The work of Vashkevich et al. [28] also supports this view as their study on inclusive tourism destinations demonstrates that the involvement of vulnerable groups, for example, disabled people can be a success thanks to sustainable multi-stakeholder collaboration facilitated by digital technology. Moreover, research findings suggest that improved economic-environmental goal alignment of green tourism programs are associated with coordination among “double helix” actors (public-private sector) which leads to increased social legitimation within the green tourism plan [29].
Involvement of marginalized communities, representing engagement by people and at vulnerable groups, such as women, differently abled, low-income, in the creative business value chain. But as more othering goes on in an increasingly diverse society, inclusion also becomes a business strategy to promote social sustainability and community legitimacy [30]. Managerial capacity describes the ability of business actors to plan, organize, direct, and control resources to achieve business objectives effectively and efficiently. As Heubeck [31] and Roy et al. [32] said, managerial capacity is the capability that business actors have to plan, organize, direct and control resources to achieve business objectives effectively and efficiently. This capacity is interpreted within the framework of green entrepreneurship as a sustainable strategy, inclusive human resources and environmental risks management, respectively. MSMEs internalize green principles via MSME opening up participation to vulnerable groups by the influence of Managers' competencies in planning, organizing and controlling. Quantitative evidence from 216 manufacturing MSMEs in Malaysia shows that dynamic managerial capabilities play a crucial role in mediating the influence of sustainable business practices on three-dimensional sustainability performance (economic, social, and environmental) [33]. Similar implications were found in the MSME strengthening index model at cultural heritage sites, where managerial skills mediate the relationship between green orientation and the adoption of resource efficiency practices [34].
2.4 Sustainability creative business (SCB), and government support (GS)
The performance of sustainable creative businesses in tourist areas is measured using economic indicators (profitability, job growth), environmental indicators (waste reduction, resource efficiency), and social indicators (inclusivity, cultural preservation). The positive relationship between GEO and sustainable creative business (SCB) has been confirmed through a cross-country meta-analysis [35], while the involvement of marginalized communities strengthens market legitimacy and product differentiation (handicrafts, cuisine) in historical tourist areas [36].
Government support plays a role in creating a business climate that supports green economy principles and inclusive innovation [37]. This support can take the form of regulations, fiscal incentives, provision of green infrastructure, facilitation of training, and access to markets and financing [38]. It is expected that different fiscal incentive schemes, green certification, and government technical assistance are helping the speed of this leverages towards the acceleration of green creative industries. Small green industries also benefit from the location of Borobudur tourist area with the program “Green Industry Concept” to improve energy efficiency and market access through digital marketing at all layers of MSMEs (initially increased by 18% within one year) [39]. But other research warns that innovation intentions could be dampened in the presence of too many bureaucratic regulations if it is not complemented with service ease.
2.5 Theory of Planned Behavior (TPB)
Theory of Planned Behavior (TPB) is a theoretical model proposed for explaining how human intentions are formed documenting that behavior following from these intentions can be predicted. The TPB suggests that an individual intention to engage in a behavior is based on three main components: attitude towards the behavior, subjective norms, and perceived behavioral control. All three of these operate at the same time to influence whether an individual acts or does not act in a given situation [11, 40]. Recently, TPB has been used in the green entrepreneurship literature to study the intention of business actors to engage with sustainable (environmentally friendly) practices. Environmental sustainability attitude are the dominant key factor for increasing willingness among business actors to perform green innovation, where subjective norms such as community social pressure or demand from consumers turning into an individual postulated construct at performing and actualizing adherence in behaving based on sustainability principles. Meanwhile, perceived behavioral control: the power of an individual to execute their intentions in practice as a consequence of capacity and resources [11, 40].
The appropriateness of the TPB in how green entrepreneurship behavior can be explained is well documented by some extant studies. Which means that TPB also has potential to predict entrepreneurial intention in situations of sustainability-driven sectors, especially MSMEs actors in developing countries. In the creative industry, the TPB model is very useful for understanding the motivations of business actors in implementing environmentally friendly production, recycling-based innovation, and the adoption of green technology [1]. Implications TPB provides a strong theoretical foundation for designing interventions or behavior-change policies. Effective green entrepreneurship training must foster positive attitudes, strengthen supportive social norms, and enhance entrepreneurs' confidence in their ability to manage sustainable businesses. By understanding the psychological and social factors that shape such intentions, policymakers and facilitators can develop more targeted and impactful strategies for the development of the green creative industry [16, 41].
Digital transformation in the tourism sector promotes resource efficiency, product innovation, and platform-based business models that reduce carbon footprints. Comparative studies in Europe have shown that “smart solutions” improve destination sustainability scores through real-time energy and waste management [42]. In Indonesia, a survey of creative SMEs shows that technology adoption before, during, and after the pandemic positively correlates with increased green revenue and business resilience [43]. Similar findings among global SMEs confirm that digital competencies strengthen resilience readiness and sustainability orientation [44]. This evidence reinforces the expectation of a significant positive relationship, leading to the hypothesis that access to technology-digitalization (AT) positively influences SCB: AT → SCB.
The quadruple-helix model (government–industry–academia–community) has been proven to accelerate the green creative transition. An analysis of the determinants of creative tourism reveals that cross-actor collaboration enhances product diversification, joint marketing, and the achievement of destination environmental indicators [45]. Research in Tana Toraja found that collaboration significantly increases visits and cultural-environmental conservation initiatives [46]. A quantitative study in 137 tourist villages in Bali confirmed collaboration and inclusive governance as predictors of sustainability performance [47]. Given the consistent positive evidence, the hypothesis that stakeholder collaboration (SC) positively influences SCB; SC → SCB is deemed relevant.
Fiscal incentives, green certification, and technical assistance increase the adoption of environmentally friendly innovations in MSMEs. A cross-country survey found that subsidies and tax breaks accelerate green innovation and the net profits of SMEs [48]. A panel study in China demonstrates that official government “green-identity certificates” increase a company's market value and environmental reputation [38]. A panel analysis in Europe shows that “green identity” certificates enhance the reputation and market value of creative companies [49]. Furthermore, Wang and Feng [50] add that government support moderates the influence of green orientation on sustainability performance. Thus, government policy support (GPS) has a significant positive effect on SCB; GPS → SCB.
The ability to plan, organize, and provide inclusive leadership enables business actors to include vulnerable groups in the value chain. Micro-foundational research on digital transformation in SMEs confirms that managerial cognition determines the success of integrating local talent and green practices [51]. Case studies on Base-of-the-Pyramid (BoP) inclusion demonstrate how SME leaders structure co-creation processes to ensure economic benefits reach marginalized communities [52]. Therefore, it is hypothesized that managerial capability (MC) positively influences marginal inclusion (MI): MC → MI.
GEI not only encourages green entrepreneurial behavior but also promotes pro-social values. An analysis of 407 Chilean students showed that GEI is positively correlated with community-based green entrepreneurial behavior [53]. Global GEI bibliometrics highlight research trends on the role of green intentions in addressing socio-ecological issues [54]. Salamzadeh and Kesim [55] reported a positive correlation between GEI and community involvement in green startups in Iran. Escobar [56] confirmed that green entrepreneurial intent drives inclusive business practices in Latin America. The concept of “intentions-behaviour gap” in eco-entrepreneurship emphasizes the need to validate whether green intentions (GEI) positive and significant manifest themselves in the actions of MI in the context of Borobudur tourism SPD. Hypothesis: GEI → MI.
Several recent studies view GEI as an antecedent to the formation of GEO. A PLS study on SMEs confirms that GEI and knowledge management processes directly enhance GEO [57]. Muangmee et al. [34] found that GEI combined with knowledge management processes enhances innovation, proactivity, and green risk-taking in Thai SMEs. Erdogan et al. [58] also demonstrated the pathways of GEI and GEO in New Zealand's tourism services sector. A theoretical review positions GEI as a cognitive input toward organizational behavior based on proactivity, innovation, and green risk-taking [59]. Therefore, the significant positive relationship between GEI → GEO is worth testing.
The participation of marginalized communities enhances the legitimacy, product differentiation, and social sustainability of destinations. Factor analysis in tourist villages shows that community involvement improves competitiveness, empowerment, and destination performance [60]. Moise et al. [61] in Rumania tourist villages found that community involvement improves the economic and social performance of destinations. Maziliauske [62] asserts that co-creation between SMEs and local residents strengthens social-cultural sustainability in world heritage areas. Co-creation between SMEs and local residents has been proven to strengthen socio-cultural benefits in rural areas [62]. This evidence supports the hypothesis: MI → SCB positive.
A meta-analysis of 72 studies found a strong correlation between GEO and companies' financial, environmental, social, and green innovation performance [35]. Research on the manufacturing-service industry in emerging economies confirms that GEO improves business success by enhancing green innovation capabilities [8]. Momayez et al. [63] demonstrate that GEO enhances sustainability by strengthening green innovation capabilities in Malaysia's tourism sector. Similar findings in the tourism sector identify GEO as the primary determinant of sustainability performance [64]. With this literature, the GEO → SCB hypothesis is considered strong both theoretically and empirically.
Methods- Sampling Frame, Inclucion Criteria, and Procedure.
Sampling Frame.
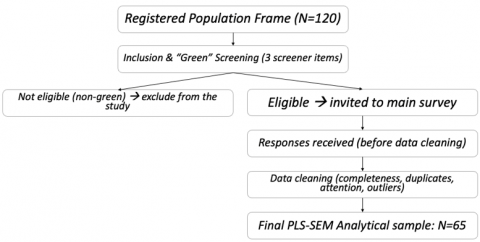
The study targeted 120 creative enterprises located within the Borobudur Super-Priority Destination (crafts, culinary, fashion, and creative services). Inclusion Criteria (purposive). (i) operating within the DSP Borobudur area; (ii) having current or planned green practices (e.g., waste management, eco-friendly materials, energy efficiency); (iii) at least one year of operation; (iv) respondent is the owner or key decision-maker. Pre-survey ‘Green’ Screening. We applied three screener items capturing minimum green practice. Units that did not meet the threshold were not invited to the main survey. The percentage of screened-out non-green units was not documented quantitatively at the time of data collection. To enhance transparency, we provide the sampling flow in Table A1 and explicitly report the final analytical sample (n = 65, ≈54% of the 120-unit frame).
Sample Adequacy for PLS-SEM (ISR/GE Summary)
We evaluated the adequacy of n = 65 using the inverse square root and gamma–exponential approaches based on the smallest absolute path coefficient (α = 0.05; power = 0.80). Effects that are near-zero would require large N; our realized n = 65 is sufficient for the small-to-moderate focal effects that were significant in the bootstrap. Detailed computations are provided in Appendix A-1. Although the final response rate was moderate, the achieved sample met both statistical power and theoretical representativeness requirements for PLS-SEM analyses.
The green economy is a new paradigm in development that balances economic growth with environmental preservation and social justice. This study examines the implementation of inclusive innovation ecosystems, the role of green entrepreneurs, and government commitment to green creative enterprises in the Borobudur tourist SPD area. The study is quantitative in nature with a cross-sectional approach. The testing framework uses Structural Equation Modeling–Partial Least Squares (SEM-PLS) because: (a) the model is predictive-exploratory, (b) the sample size is limited, and (c) the constructs contain reflective and formative indicators [65]. The analysis was conducted using Smart PLS 4.0.
The population includes all green economy-based creative industry players in the Borobudur tourist SPD area (120 business units, source: Tourism Office 2024). The sampling technique used purposive sampling with the following inclusion criteria: (a) businesses that have been active for at least two years; (b) produce products/services based on local cultural heritage; (c). Implementing at least one environmentally friendly business practice (such as sustainable materials or waste management). The next criterion is: (a). The 10 × indicator rule-the largest construct (GEO) has six indicators, so ≥ 60 observations are required [65]; (b). Power analysis via GPower 3.1 (α = 0.05; power = 0.80; f² = 0.15; five main predictors) recommends ≥ 55 samples [66].
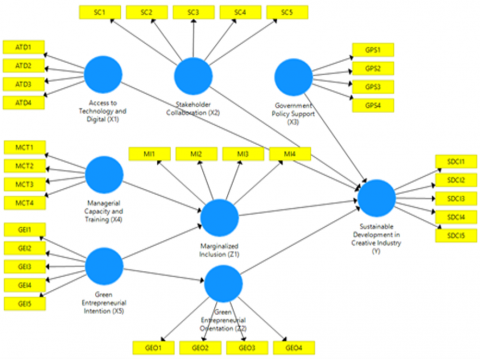
Using purposive sampling and predetermined sampling criteria, a sample of 65 sustainable creative entrepreneurs was obtained. The functional relationship between exogenous variables and endogenous variables is as follows: exogenous variables include: (a) green entrepreneurship (GEO, GEI, managerial capacity), (b) inclusive innovation ecosystem (access to technology-digitalization, involvement of marginalized communities, stakeholder collaboration), and (c) GPS. The endogenous variable is SCB in the Borobudur tourism SPD area. To address the research objectives and hypotheses, a quantitative approach (SEM-PLS) was used. The empirical research model is shown in Figure 1 and Figure 2.
Figure 1. Sampling flow
Figure 2. Empirical model of research
The research objects were creative industry entrepreneurs who had implemented environmentally friendly practices within the Borobudur Super-Priority Destination (SPD). Respondent characteristics are summarized by age, education, years in operation, and business type (Table 1). Most owners are aged 30–60 (≈72.3%), the majority hold a Senior High School degree (≈38.5%), and over five years in operation (≈76.9%).
In terms of business type, handicrafts and souvenirs combined account for 46.2% (30/65), followed by others (e.g., tourism services, accommodation, travel agencies, ornamental plants) at 32.3% (21/65). These distributions indicate substantial heterogeneity across firms—consistent with the inclusion of control variables (firm age, education, and, where available, firm size) and with the robustness checks reported in Table 1.
Table 1. Characteristics of sample respondents
|
Sample Respondent Criteria |
|||||||
|
Age (years) |
Number (people) |
Type of Education |
Number (people) |
Duration (years) |
Number (people) |
Type of Business |
Number (people) |
|
< 30 |
6 |
Elementary School |
11 |
< 1 |
1 |
Handicrafts |
17 |
|
30–39 |
15 |
Junior High School |
15 |
1–3 |
4 |
Souvenirs |
13 |
|
40–49 |
17 |
Senior High School |
25 |
3–5 |
10 |
Culinary |
9 |
|
50–60 |
15 |
Diploma |
8 |
5–7 |
15 |
Batik |
5 |
|
> 60 |
12 |
Bachelor's Degree |
6 |
> 7 |
35 |
Others |
21 |
|
Total |
65 |
|
65 |
|
65 |
|
65 |
Table 1 presents the criteria of respondents in this study, totaling 65 participants. Based on age, the majority of respondents are between 40–49 years old (26.2%), followed by those aged 50–60 years (23.1%), 30–39 years (23.1%), over 60 years (18.5%), and under 30 years (9.2%). In terms of education, most respondents completed senior high school (38.5%), while others graduated from junior high school (23.1%), elementary school (16.9%), diploma (12.3%), and bachelor’s degree (9.2%). Regarding business experience, the majority have been operating for more than 7 years (53.8%), followed by 5–7 years (23.1%), 3–5 years (15.4%), 1–3 years (6.2%), and less than 1 year (1.5%). Based on the type of business, most respondents are engaged in handicrafts (26.2%), souvenirs (20.0%), culinary (13.8%), batik (7.7%), and others (32.3%). This distribution indicates that most business actors are middle-aged individuals with moderate to long business experience and secondary-level education.
6.1 Convergent validity
Convergent validity measures the extent to which indicators of a construct are highly correlated with each other and consistently represent the latent variable being measured. One of the main criteria for assessing convergent validity is the loading factor value, where an indicator is considered valid if it has a loading factor > 0.50 [67]. The loading factor data is shown in Table 2 (Appendix Table A1).
Based on the results of the convergent validity analysis, all loadings were ≥ 0.70 except for KMP1 (0.589) and PBIK5 (0.655). Both indicators were still above the minimum exploratory threshold of 0.50. Therefore, all constructs in the model met the criteria for convergent validity. These two indicators were retained because their factor loadings were still within the acceptable tolerance range for exploratory research. According to Hair et al. [67], factor loadings above 0.50 can be considered adequate when supported by strong theoretical justification and acceptable overall model validity. Moreover, both KMP1 and PBIK5 demonstrated satisfactory cross-loading values, indicating that each indicator loaded higher on its respective construct than on others. Thus, their inclusion was maintained to preserve the comprehensiveness and theoretical consistency of the measurement model.
6.2 Common method bias (CMB) diagnostics
Harman’s single-factor (unrotated) did not indicate a dominant common factor; the Common Latent Factor (CLF) test produced average Δ-loading < 0.20; the marker-variable correction did not alter the significance of focal paths; and construct-level collinearity is acceptable with all inner VIF values < 3.0 (see Table 3).
We minimized CMB by ensuring anonymity, clarifying there were no right/wrong answers, randomizing items across constructs, and using neutral wording. An unrotated EFA across all indicators showed that no single factor accounted for a majority of variance (Table 2).
Table 2. Validity test results
|
Variable |
Indicator |
Loading Factor |
Validity Result |
|
Access to Technology (X1) |
ATD1 |
0.917 |
Valid |
|
ATD2 |
0.831 |
Valid |
|
|
ATD3 |
0.907 |
Valid |
|
|
ATD4 |
0.826 |
Valid |
|
|
Stakeholder Collaboration (X2) |
KDS1 |
0.911 |
Valid |
|
KDS2 |
0.818 |
Valid |
|
|
KDS3 |
0.813 |
Valid |
|
|
KDS4 |
0.815 |
Valid |
|
|
KDS5 |
0.837 |
Valid |
|
|
Government Support (X3) |
DKP1 |
0.837 |
Valid |
|
DKP3 |
0.874 |
Valid |
|
|
DKP4 |
0.877 |
Valid |
|
|
DKP5 |
0.827 |
Valid |
|
|
Managerial Capacity (X4) |
KMP2 |
0.866 |
Valid |
|
KMP3 |
0.721 |
Valid |
|
|
KMP4 |
0.901 |
Valid |
|
|
KMP5 |
0.881 |
Valid |
|
|
Green Entrepreneurial Intention (X5) |
GEI1 |
0.770 |
Valid |
|
GEI2 |
0.907 |
Valid |
|
|
GEI3 |
0.782 |
Valid |
|
|
GEI4 |
0.842 |
Valid |
|
|
GEI5 |
0.807 |
Valid |
|
|
Marginal Inclusion (Z1) |
KMM1 |
0.928 |
Valid |
|
KMM2 |
0.908 |
Valid |
|
|
KMM4 |
0.865 |
Valid |
|
|
KMM5 |
0.811 |
Valid |
|
|
KMP1 (X4) |
0.589 |
Valid |
|
|
Green Entrepreneurial Orientation (Z2) |
GEO1 |
0.849 |
Valid |
|
GEO2 |
0.724 |
Valid |
|
|
GEO3 |
0.749 |
Valid |
|
|
GEO4 |
0.745 |
Valid |
|
|
GEO5 |
0.724 |
Valid |
|
|
Sustainable Creative Businesses (Y) |
PBIK1 |
0.749 |
Valid |
|
PBIK2 |
0.709 |
Valid |
|
|
PBIK3 |
0.815 |
Valid |
|
|
PBIK4 |
0.752 |
Valid |
|
|
PBIK5 |
0.655 |
Valid |
Adding a common latent factor to the measurement model yielded an average indicator loading difference < 0.20 (Table 2), indicating negligible CMB. Marker Variable Approach. Using a theoretically unrelated marker to adjust correlations left the significance of focal paths unchanged (Table 3). All full collinearity VIF values per latent construct were below 3.3 (Table 3). Together, these diagnostics suggest CMB is not material in our data.
Table 3. Construct-level collinearty (Inner VIF)
|
Construct |
Inner VIF |
|
AT (X1) |
1.859 |
|
SC (X2) |
2.129 |
|
GS (X3) |
2.153 |
|
MC (X4) |
1.075 |
|
GEI (X5) |
1.000 |
|
MI (Z1) |
1.948 |
|
GEO (Z2) |
1.519 |
6.3 Construct reliability and validity
Construct validity can be seen from the Average Variance Extracted (AVE) value, with a minimum limit of 0.50, which indicates that the latent variable is able to explain more than 50% of the variance of its indicators. Construct reliability is evaluated using three main measures: Cronbach’s Alpha, rho_A, and Composite Reliability, all of which must be above 0.70 to meet the criteria for internal reliability [68-70] (Table 4).
Table 4. Construct validity and reliability
|
Variable |
Cronbach’s Alpha |
Composite Reliability |
AVE |
Evaluation Results |
|
AT (X1) |
0.894 |
0.926 |
0.759 |
Valid and Reliable |
|
SC (X2) |
0.895 |
0.923 |
0.705 |
Valid and Reliable |
|
GS (X3) |
0.876 |
0.915 |
0.729 |
Valid and Reliable |
|
MC (X4) |
0.873 |
0.909 |
0.715 |
Valid and Reliable |
|
GEI (X5) |
0.880 |
0.913 |
0.677 |
Valid and Reliable |
|
MI (Z1) |
0.901 |
0.931 |
0.773 |
Valid and Reliable |
|
GEO (Z2) |
0.769 |
0.852 |
0.590 |
Valid and Reliable |
|
SCB (Y) |
0.790 |
0.856 |
0.544 |
Valid and Reliable |
Based on the test results, both construct validity and construct reliability have been fulfilled, so that the instruments used in this model are valid and reliable [68-70].
6.4 Discriminant validity
GEO Specification (Reflective) and Robustness. We modeled GEO as reflective because indicators (innovativeness, proactiveness, risk-taking) are manifestations of the underlying strategic posture; changes in the latent trait should affect all indicators in the same direction and indicators are interchangeable. Support comes from high outer loadings, CR/ρA/α above thresholds, AVE > 0.50, and outer VIF < 5. As a robustness check, we also estimated a second-order reflective–reflective GEO (INNO, PROAC, RISK) and found that key structural conclusions remain unchanged (Table 4 and Appendix Table A2).
Discriminant Validity (GEI–GEO). HTMT_GE I–GEO = 0.983 (> 0.90) reflects close conceptual relatedness (intention vs. orientation) among MSMEs where intention-to-practice translation is rapid. We retain both constructs due to their non-redundant roles (GEI as intention; GEO as strategic posture) and provide robustness via the second-order GEO, cross-loading inspection, and VIF checks; we acknowledge this as a limitation and suggest more distinctive indicators or longitudinal designs (Appendix Table A3).
MI Indicator Allocation. We removed item KMP1 (managerial) from MI, as it reflects managerial capacity rather than inclusion. Retained MI indicators focus on access to information/markets, network participation, and benefit sharing. Post-adjustment reliability and validity remain adequate (see revised Table 2 and Appendix Table A2).
According to Henseler et al. [71], a good Heterotrait-Monotrait Ratio of Correlations (HTMT) value should be below 0.90 to ensure that the constructs in the model do not overlap and measure different concepts (Table 5 and Appendix Table A4).
Based on the HTMT test results in Table 5, all construct pairs met the recommended threshold of < 0.90 for discriminant validity, except for the GEI and GEO pairs, which reached 0.983. This value can be explained by the high conceptual fit between “intent” and “orientation” toward green practices in creative business activities at Borobudur. Previous studies have confirmed that, at the micro and small scales, GEIs are often directly manifested in operational behavior without a long time lag, leading respondents to view the two as a single entity [72, 73]. A meta-analysis by Schlaegel and Koenig [74], also shows a high correlation-even above 0.70-between entrepreneurial intention and subsequent behavior, particularly in the context of sustainability-oriented entrepreneurship. Thus, the high GEI–GEO correlation reflects the reality in the field rather than a weakness of the instrument.
6.5 Inner model analysis
The R Square (R²) value is used to measure the predictive ability of the structural model in explaining the variance of the dependent (endogenous) variable. According to Chin [75], an R² value of ≥ 0.67 is considered strong, around 0.33 - < 0.67 is considered moderate, and < 0.33 is considered weak.
Table 5. Heterotrait-monotrait ratio (HTMT)
|
Construct |
(ATD) |
(GPS) |
(GEI) |
(GEO) |
(MC) |
(IMC) |
(SC) |
(SD) |
|
Access to Technology |
— |
0.520 |
0.625 |
0.602 |
0.476 |
0.623 |
0.605 |
0.750 |
|
Government Policy Support |
— |
0.641 |
0.518 |
0.336 |
0.679 |
0.756 |
0.585 |
|
|
Green Entrep. Intention |
— |
0.983 |
0.296 |
0.576 |
0.453 |
0.772 |
||
|
Green Entrep. Orientation |
— |
0.281 |
0.555 |
0.473 |
0.855 |
|||
|
Managerial Capacity |
— |
0.680 |
0.591 |
0.571 |
||||
|
Marginal Inclusion |
— |
0.619 |
0.871 |
|||||
|
Stakeholder Collaboration |
— |
0.568 |
||||||
|
Sustainable Develop. in CI |
— |
Table 6. R² values
|
Endogenous Variables |
R² |
Category [75] |
|
GEO (Z2) |
0.687 |
Strong |
|
MI (Z1) |
0.584 |
Moderate |
|
SCB (Y) |
0.727 |
Strong |
The results of the analysis in Table 6, show that the model has good predictability for endogenous variables. This research model is also able to estimate and explain the sustainability performance of creative MSMEs in the Borobudur Tourism SPD area. This is evidenced by the values of 0.635 (GEO), 0.549 (MI), and 0.543 (SCB) in Stone-Geisser Q2 obtained through the benchmark test. All these Q² values exceed the high predictive relevance threshold of 0.35 [67]. Through PLS-Predict, it shows positive Q²predict values and smaller RMSE-PLS than the reference linear model, so out-of sample data can be predicted in this model (Table 7) [76].
6.6 Path coefficient analysis
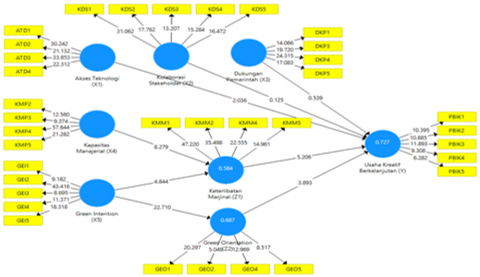
Interpretation of research results is important in determining the relative contribution of each construct in explaining the phenomenon under study and evaluating hypotheses. Through path coefficient analysis, the direction and strength of the relationship between the independent and dependent variables in the study can be determined. In addition, a significant effect is obtained through the T statistical significance test and the p value, provided that the p value must be less than 0.05 (Figure 3).
The estimation results show that most of the paths in the model have a significant effect on the dependent variable. The path GEI (X5) → GEO (Z2) has the strongest and most significant influence with a coefficient of 0.829 (p < 0.001), followed by MI (Z1) → SCB (Y) at 0.506, and MC (X4) → MI (Z1) at 0.589. Meanwhile, the effect of AT (X1) on SCB (Y) is significant with a coefficient of 0.211 (p = 0.042). However, there are two statistically insignificant relationships, namely between GPS (X3) and SC (X2) on SCB (Y) with p-values of 0.590 and 0.900, respectively.
These findings indicate that most constructs contribute to the model, but not all relationships statistically provide a significant direct effect. The Q² values obtained from blindfolding confirm substantial predictive power for all three endogenous constructs (Q² = 0.308–0.486). The PLSpredict evaluation shows that all indicators have a lower RMSE<sub>PLS</sub> than the linear model, indicating strong out-of-sample predictive power. Effect-size analysis (f²) reveals the greatest influence is on the GEI → GEO path (f² = 0.87; large) and MI → SCB (f² = 0.38; large), while AT → SCB is only small–medium (f² = 0.05) (Appendix Table A5).
Figure 3. Results of path coefficient analysis
Table 7. Path coefficients
|
Relationship Between Variables |
Path Coefficient (β) |
T Statistic |
P Value |
Description |
|
AT (X1) → SCB(Y) |
0.211 |
2.036 |
0.042 |
Supported (H1) |
|
SC (X2) → SCB(Y) |
-0.016 |
0.125 |
0.900 |
Not supported (H2) |
|
GPS (X3) → SCB(Y) |
-0.055 |
0.539 |
0.590 |
Not supported (H3) |
|
MC (X4) → MI(Z1) |
0.589 |
8.279 |
<0.001 |
Supported (H4) |
|
GEI(X5) → MI(Z1) |
0.356 |
4.844 |
<0.001 |
Supported (H5) |
|
GEI(X5) → GEO(Z2) |
0.829 |
22.710 |
<0.001 |
Supported (H6) |
|
MI (Z1) → SCB(Y) |
0.506 |
5.206 |
<0.001 |
Supported (H7) |
|
GEO(Z2) → SCB(Y) |
0.357 |
3.893 |
<0.001 |
Supported (H8) |
These findings also confirm the dominance of cognitive-strategic mechanisms and social inclusion over mere access to technology. Bootstrap mediation tests show that GEI enhances SCB through two channels: (a) the social channel GEI → MI → SCB (β = 0.180; p < 0.001); and (b) the strategic channel GEI → GEO → SCB (β = 0.296; p < 0.001). Since the direct path GEI → SCB is not significant, these two paths indicate full-partial mediation that validates the “green-inclusive entrepreneurship” framework (Appendix Table A6).
The f² analysis reveals varying levels of effect size among the studied constructs. Green Entrepreneurial Intention (X5) shows a very large effect (f² = 0.829) on Green Entrepreneurial Orientation (Z2), indicating that entrepreneurs’ green intentions strongly influence their orientation toward sustainable practices. Similarly, Managerial Capacity and Training (X4) and Marginalized Inclusion (Z1) exert large effects (f² = 0.589 and 0.506, respectively) on Sustainable Development in the Creative Industry (Y), highlighting the critical roles of managerial competence and inclusive participation. Green Entrepreneurial Orientation (Z2) also demonstrates a large effect (f² = 0.357) on sustainability outcomes, while Access to Technology and Digitalization (X1) contributes a moderate effect (f² = 0.211). Conversely, Government Policy Support (X3) and Stakeholder Collaboration (X2) show minimal or negative effects (f² = -0.055 and -0.016), suggesting that policy frameworks and partnerships have yet to translate into substantial sustainability impacts within the creative industry context (Appendix Table A7).
7.1 The role of access to technology on sustainable creative businesses
The path estimation results indicate that AT significantly increases SCB, albeit moderately (β = 0.211; p = 0.042). These findings support the logic of technology-enabled sustainability, where digital infrastructure cuts process inefficiencies and reduces the carbon footprint of destinations [77]. At the micro level, a meta-review of European SMEs establishes ICT adoption as a driver of green innovation [78]. The moderate effect reinforces the capability-based view: technology is merely an enabler without managerial literacy, its impact is blunted [79].
In the Borobudur SPD area, social media penetration is widespread, but the integration of the Internet of Things (IoT) into the green supply chain is still minimal. Digital supply chain training and green digital voucher schemes for MSMEs are priorities in order to leverage AT growth. Implications: For creative businesses in tourist areas like Borobudur, this includes improving digital literacy and ensuring equitable access to technology, which are key factors in driving the adoption of sustainability principles. This also underscores that the development of an inclusive innovation ecosystem cannot be separated from strengthening the digital infrastructure and capabilities of businesses.
7.2 The impact of stakeholder collaboration on sustainable creative businesses
Stakeholder collaboration pathways for SCB: SC → SCB is not significant (β = -0.016; p = 0.900). Substantively, this finding is quite interesting, because theoretically cross-sector collaboration should strengthen the adaptive and innovative capacity of business actors, challenging the assumptions of the Quadruple-Helix model [80]. Qualitative explanations indicate that collaboration between creative businesses in Borobudur and other communities (government, local communities, academia, private sector) tends to be ceremonial, limited to promotional events without an operational coordination platform. Information asymmetry and a lack of trust among actors mean that direct contributions to sustainability performance are not yet felt, thus no longer providing a significant additional effect on business sustainability.
This finding is in line with the findings of Koiwanit and Filimon [81], which show that in local contexts (such as tourist destinations), multi-stakeholder collaboration is often ineffective due to the lack of direct benefits felt by business actors and weak collaborative structures. They emphasize that collaboration will fail to create added value if it is not based on trust, equal contribution, and a clear shared purpose [81]. Meanwhile, research in Toraja shows that cross-actor collaboration increases product diversification Suparjo et al. [46] and Asian heritage records similar positive effects [82]. Governments and tourist destination managers need to form cross-actor working groups, with key performance indicators (such as collective waste reduction, joint green certification) to ensure that collaboration has a real impact. Based on field observations and informal interviews, stakeholder collaboration in the creative industry development programs around Borobudur often takes a ceremonial form, focusing on attendance and formality rather than joint planning or implementation.
7.3 The role of government policy support on sustainable creative businesses
GPS on SCB is not significant (β = -0.055; p = 0.590). This gap is consistent with criticism of the implementation gap of green fiscal incentives, which often fail downstream [83]. A Chinese panel study demonstrates that subsidies are effective only if the procedures are simple [84]; in Borobudur, respondents complained about the high cost and lengthy process of green certification. The “one-stop service + performance-based incentives” approach is recommended so that GPS functions as a condition of effectiveness [85], not merely as administrative regulation. A study by Andriansyah et al. [86], on tourism MSMEs in Indonesia shows a similar pattern: government interventions that are not contextually appropriate tend to fail to stimulate improvements in marketing performance and innovation, due to a lack of adaptation to on-the-ground conditions and coordination across government levels.
7.4 The impact of managerial capacity on marginal inclusion
Managerial capacity (MC) has a significant effect on MI (β = 0,589; p < 0,001; f² = 0,35). The concept of dynamic managerial capability suggests that coordination knowledge enables inclusive work design, such as dividing household production tasks among women or the elderly [87]. Cardeal et al. [88] add that managerial human capital mediates the social inclusion of MSMEs. Creative entrepreneurs in Borobudur have extensive business experience (>5 years), routinely divide production processes among households of women and the elderly, and enhance the social legitimacy of the destination. Participatory leadership training and performance-based incentive systems should be prioritized.
Good managerial skills can create an inclusive and participatory environment. This enables groups that have traditionally been marginalized (women, people with disabilities, low-income households) to participate in the creative business value chain in a structured and sustainable manner, and to be more actively involved and contribute, particularly in the Borobudur area. The findings of this study align with the conceptualization of entrepreneurial competencies by Man et al. [89], which emphasizes that managerial capacity, encompassing conceptual, relational, and organizational competencies, serves as a catalyst for building organizational capabilities that not only drive internal efficiency but also create opportunities for the empowerment of non-traditional workforce. When business owners can manage resources strategically, decisions regarding work assignments, training allocation, and operational process design tend to be inclusive, enabling marginalized groups to access more meaningful roles in the value creation process. Furthermore, Urban [90] views managerial literacy as the foundation of social value-based entrepreneurship, where innovation creation is inseparable from the goal of community empowerment.
7.5 The role of green entrepreneurial intention on marginal inclusion
GEI has a significant positive effect on MI (β = 0.356; p < 0.001). This finding confirms that green intention is pro-social [91, 92]. Environmentally oriented businesses tend to open up employment opportunities for marginalized groups as part of the sustainability ethos. In the Borobudur area, cultural spiritual motives (gotong-royong) reinforce this preference. Green entrepreneurship acceleration programs should include social inclusion capital, so that GEI values are reflected in practice. The stronger the intention of creative businesses in Borobudur to implement environmentally friendly practices, the higher the proportion of marginalized: vulnerable groups-women, people with disabilities, low-income households-included in their business value chain.
Conceptually, this finding confirms that sustainability orientation does not stop at ecological innovation, but also expands the ethical horizons of business actors towards social inclusiveness. Kuckertz and Wagner [72] show that individuals with a high sustainability orientation combine entrepreneurial drive and sensitivity to distributive justice, so that green business intentions are often accompanied by aspirations to reduce asymmetries of economic opportunity. Meanwhile, Meek et al. [93] elaborate that internalized environmental norms can change the institutional structure of the market. Green entrepreneurs act as institutional agents that normalize public-oriented business practices, through the creation of internal work mechanisms and policies that deliberately include marginalized groups as part of the business value proposition. More than just a positive side effect, the involvement of marginalized groups becomes a strategic concept. The participation of vulnerable groups strengthens their social legitimacy, adds to the authentic narrative of Borobudur tourist destination, and creates consumer preferences that are willing to pay a green premium. Thus, increasing green intention has the potential to become an institutional transformation tool that combines ecological dimensions and social justice-realizing a creative industry ecosystem that is not only environmentally sustainable, but also economically equitable for the most vulnerable communities in the region.
7.6 The role of entrepreneurial intention (GEI) on green entrepreneurial orientation (GEO)
The GEI → GEO pathway is the strongest (β = 0.829; p < 0.001), extending Daellenbach and Zhu [94], evidence that green intention transforms into green innovation-activity-risk strategy [19]. The value of β > 0.8 indicates that the conversion gap between intention and implementation is relatively small in the Borobudur area, due to business experience > 5 years, and tourism market awareness of green products. This finding highlights the importance of nurturing green intentions from the start (through SDGs-based business incubation), so that the company's orientation is firmly established. This finding indicates that the intention of business actors to run environmentally friendly businesses actually materializes in the form of orientation, or business practices that focus on sustainability aspects. This orientation can take the form of using more environmentally friendly raw materials, energy efficiency, waste reduction, and green marketing strategies. Thus, the intention towards sustainability does not just stop at the level of discourse or attitude, but is actually implemented in the form of real operational practices.
Substantially, the positive relationship GEI on GEO indicates consistency between internal values (intention) and real behavior (orientation). Business actors who have the awareness and intention to protect the environment will tend to apply these principles throughout their business processes, from the selection of environmentally friendly raw materials, energy efficiency, waste management, to marketing approaches that emphasize green values. Green entrepreneurship is not a passive concept, but transformative and applicable. This finding is in line with the Theory of Planned Behavior [19], which states that intention is the main predictor of actual behavior. In this context, GEIs encourage the formation of green orientation practices. Research by Leonidou et al. [95], also supports this result by stating that green intentions directly influence their strategic decisions to adopt environmentally friendly operations.
7.7 The role of marginal inclusion (MI) on sustainable creative businesses (SCB)
MI was the largest predictor of SCB (β = 0.506; p < 0.001), consistent with the study of Lawelai et al. [96], which showed community involvement increases socio-cultural legitimacy in Wakatobi. In Borobudur, visitors tend to value products that feature local empowerment narratives. Thus, a branding strategy based on storytelling about marginalized workers can increase perceived value and economic sustainability.
The involvement of marginalized communities is proven to have a positive and significant influence on SCB in the Borobudur tourism area. The higher the involvement of community groups that have been less accommodated such as women, people with disabilities, or underprivileged communities, the greater the contribution to the sustainability of the creative businesses being run. This finding emphasizes that the social inclusiveness dimension is not only morally important, but also has a direct impact on business performance. When businesses actively involve marginalized groups in the production process, decision-making, or distribution of benefits, it creates added value in the form of social legitimacy, community loyalty, and stronger socio-economic sustainability. This finding is in line with the concept of inclusive innovation [10], which emphasizes that innovations that involve marginalized groups will produce solutions that are more relevant and sustainable, because they touch real needs at the grassroots level. In addition, Hall et al. [97] also stated that business sustainability cannot be achieved only by internal strategies, but requires a strong connection with the surrounding community.
7.8 The role of green entrepreneurial orientation (GEO) on sustainable creative enterprise (SCB)
GEO has a positive effect on sustainable creative enterprise (SCB) (β = 0.357; p < 0.001; f² = 0.18). Meta-analyses by Asad et al. [24] and Asadi et al. [98] noted that green orientation improves triple-bottom-line performance (financial, environmental, and social). The results of this study confirm these findings in the context of cultural heritage destinations. Green innovation, sustainable packaging, and green market proactivity were shown to increase profits and reputation. MSME incubators should provide natural raw material R&D support, eco-design patent access, and risk clinics for green experimentation. The higher the level of business orientation towards green practices, such as the use of eco-friendly materials, reduction of plastic waste or waste recycling, the higher the level of sustainability of the business. Sustainability-focused operational implementation drives efficiency, enhances business reputation, and expands market access, ultimately strengthening the competitiveness and long-term sustainability of creative enterprises.
The findings of this study confirm that sustainability is not only determined by intentions or strategies on paper, but is highly dependent on how environmentally friendly principles are actually implemented in daily operations. The use of environmentally friendly raw materials, efficiency in resource utilization, waste reduction, and education to customers about the importance of green products are concrete practices that reflect green orientation. The study by Chen et al. [99] provided further support to the finding, studying the relationship between environmental orientation in business activities and sustainability performance, competitive advantage. Further, Alt and Spitzeck [100] pointed out that firms with green operations are better able to respond to forces in the marketplace and regulations having an impact on the environment and have a stronger potential for creating long-term sustainable economic value by being more innovative.
This study confirms that GEI through GEO and MI are the main determinants of SCB performance in MSMEs, especially creative businesses in the Borobudur tourism SPD area. Access to digital technology (AT) and managerial capacity (MC) act as additional levers. Meanwhile, stakeholder collaboration (SC) and government support (GS) are still hampered by ceremonial governance.
Theoretically, this research integrates the Theory of Planned Behavior (TPB) and the inclusive innovation framework, introducing the social-ecological dual mediation mechanism and highlighting MC as a lever for inclusion, expanding the repertoire of green entrepreneurship in emerging tourism destinations. Practically, the findings emphasize the need for: (i) digital and managerial upskilling programs that transform green intentions into operational SOPs, and (ii) concise performance-based green certification to replace ceremonial collaboration initiatives.
The practical implication is that MSMEs players need to establish key performance indicator-based green SOPs and systematically involve vulnerable groups. The government should transform environmental certification into a results-based one-stop service and link fiscal incentives to waste reduction achievements. Digital platforms should provide IoT-based carbon footprint dashboards to make green performance measurable and marketable.
Future research should test the moderation of policy quality and financial capability, and assess the effectiveness of digital green voucher schemes in accelerating green technology adoption. Thus, the green-inclusive entrepreneurship agenda can move from the conceptual realm to measurable policy protocols at the national level.
The researcher would like to thank the Rector of Diponegoro University for the financial support provided for the research and publication of this article.
|
B |
dimensionless heat source length |
|
CP |
specific heat, J. kg-1. K-1 |
| g | gravitational acceleration, m.s-2 |
|
k |
thermal conductivity, W.m-1. K-1 |
|
Nu |
local Nusselt number along the heat source |
|
Greek symbols |
|
|
$\alpha$ |
thermal diffusivity, m2. s-1 |
|
$\beta$ |
thermal expansion coefficient, K-1 |
|
$\phi$ |
solid volume fraction |
|
Ɵ |
dimensionless temperature |
|
µ |
dynamic viscosity, kg. m-1.s-1 |
|
Subscripts |
|
|
p |
nanoparticle |
|
f |
fluid (pure water) |
|
nf |
nanofluid |
A-1
Inverse Square Root (ISR)
The formula used is:
$N_{\mathrm{ISR}}=\left\lceil\left(\frac{z_{1-\alpha}+z_{\text {power }}}{\left|\beta_{\min }\right|}\right)^2\right\rceil$
Assumptions used here:
If the actual |β|min value in your model is ≥ 0.31, then according to ISR, the minimum required N is ≤ 65, so n = 65 is sufficient.
We assessed sample adequacy using the inverse square root (ISR) approach with α = 0.05 (one-tailed) and power = 0.80 (z = 2.4866). The ISR formula yields $N=\left\lceil\left(2.4866 /\left|\beta_{\min }\right|\right)^2\right\rceil$. For several representative values of |β|min the required sample sizes are shown in Table A-1. Critically, if the smallest absolute path coefficient observed in our model is |β|min ≥ 0.31, ISR indicates $N_{\text {ISR }} \leq 65$, i.e., the realized sample (n = 65) meets the minimum requirement. In addition, the Gamma–Exponential (GE) method of Kock & Hadaya—known to produce equal or slightly smaller Nmin than ISR—was computed for the observed |β| min and yielded an equal or lower requirement, further supporting adequacy. Finally, all focal paths of substantive interest in our model were statistically significant in bootstrap tests, indicating sufficient power for the effects examined. (Detailed ISR computations and GE spreadsheet results are provided here.)
Table A1. Indicator (outer) loadings
|
(X1) |
(X3) |
(X5) |
(Z2) |
(X4) |
(Z1) |
(X2) |
(Y) |
|
|
ATD1 |
0.917 |
|||||||
|
ATD2 |
0.831 |
|||||||
|
ATD3 |
0.907 |
|||||||
|
ATD4 |
0.826 |
|||||||
|
GEI1 |
0.770 |
|||||||
|
GEI2 |
0.907 |
|||||||
|
GEI3 |
0.782 |
|||||||
|
GEI4 |
0.842 |
|||||||
|
GEI5 |
0.807 |
|||||||
|
GEO1 |
0.849 |
|||||||
|
GEO2 |
0.724 |
|||||||
|
GEO3 |
0.749 |
|||||||
|
GEO4 |
0.745 |
|||||||
|
GPS1 |
0.837 |
|||||||
|
GPS2 |
0.874 |
|||||||
|
GPS3 |
0.877 |
|||||||
|
GPS4 |
0.827 |
|||||||
|
MCT1 |
0.589 |
|||||||
|
MCT2 |
0.721 |
|||||||
|
MCT3 |
0.901 |
|||||||
|
MCT4 |
0.881 |
|||||||
|
MI1 |
0.928 |
|||||||
|
MI2 |
0.908 |
|||||||
|
MI3 |
0.865 |
|||||||
|
MI4 |
0.811 |
|||||||
|
SC1 |
0.911 |
|||||||
|
SC2 |
0.818 |
|||||||
|
SC3 |
0.813 |
|||||||
|
SC4 |
0.815 |
|||||||
|
SC5 |
0.837 |
|||||||
|
SDCI1 |
0.749 |
|||||||
|
SDCI2 |
0.709 |
|||||||
|
SDCI3 |
0.815 |
|||||||
|
SDCI4 |
0.752 |
|||||||
|
SDCI5 |
0.655 |
Table A2. Reliability and convergent validity (α, ρA, CR, AVE)
|
|
Cronbach's Alpha |
rho_A |
Composite Reliability |
Average Variance Extracted (AVE) |
|
Access to Technology and Digital (X1) |
0.894 |
0.906 |
0.926 |
0.759 |
|
Government Policy Support (X3) |
0.876 |
0.879 |
0.915 |
0.729 |
|
Green Entrepreneurial Intention (X5) |
0.880 |
0.889 |
0.913 |
0.677 |
|
Green Entrepreneurial Orientation (Z2) |
0.769 |
0.783 |
0.852 |
0.590 |
|
Managerial Capacity and Training (X4) |
0.873 |
0.998 |
0.909 |
0.715 |
|
Marginalized Inclusion (Z1) |
0.901 |
0.909 |
0.931 |
0.773 |
|
Stakeholder Collaboration (X2) |
0.895 |
0.897 |
0.923 |
0.705 |
|
Sustainable Development in Creative Industry (Y) |
0.790 |
0.797 |
0.856 |
0.544 |
Table A3. Fornell–Larcker discriminant validity
|
|
Access to Technology and Digital (X1) |
Government Policy Support (X3) |
Green Entrepreneurial Intention (X5) |
Green Entrepreneurial Orientation (Z2) |
Managerial Capacity and Training (X4) |
Marginalized Inclusion (Z1) |
Stakeholder Collaboration (X2) |
Sustainable Development in Creative Industry (Y) |
|
Access to Technology and Digital (X1) |
0.871 |
|||||||
|
Government Policy Support (X3) |
0.480 |
0.854 |
||||||
|
Green Entrepreneurial Intention (X5) |
0.577 |
0.567 |
0.823 |
|||||
|
Green Entrepreneurial Orientation (Z2) |
0.532 |
0.437 |
0.829 |
0.768 |
||||
|
Managerial Capacity and Training (X4) |
0.461 |
0.314 |
0.264 |
0.288 |
0.845 |
|||
|
Marginalized Inclusion (Z1) |
0.571 |
0.600 |
0.511 |
0.473 |
0.683 |
0.879 |
||
|
Stakeholder Collaboration (X2) |
0.548 |
0.675 |
0.406 |
0.414 |
0.540 |
0.560 |
0.839 |
|
|
Sustainable Development in Creative Industry (Y) |
0.655 |
0.496 |
0.650 |
0.678 |
0.550 |
0.754 |
0.494 |
0.738 |
Table A4. HTMT matrix
|
|
Access to Technology and Digital (X1) |
Government Policy Support (X3) |
Green Entrepreneurial Intention (X5) |
Green Entrepreneurial Orientation (Z2) |
Managerial Capacity and Training (X4) |
Marginalized Inclusion (Z1) |
Stakeholder Collaboration (X2) |
Sustainable Development in Creative Industry (Y) |
|
Access to Technology and Digital (X1) |
|
|
|
|
|
|
|
|
|
Government Policy Support (X3) |
0.520 |
|
|
|
|
|
|
|
|
Green Entrepreneurial Intention (X5) |
0.625 |
0.641 |
|
|
|
|
|
|
|
Green Entrepreneurial Orientation (Z2) |
0.602 |
0.518 |
0.983 |
|
|
|
|
|
|
Managerial Capacity and Training (X4) |
0.476 |
0.336 |
0.296 |
0.281 |
|
|
|
|
|
Marginalized Inclusion (Z1) |
0.623 |
0.679 |
0.576 |
0.555 |
0.680 |
|
|
|
|
Stakeholder Collaboration (X2) |
0.605 |
0.756 |
0.453 |
0.473 |
0.591 |
0.619 |
|
|
|
Sustainable Development in Creative Industry (Y) |
0.750 |
0.585 |
0.772 |
0.855 |
0.571 |
0.871 |
0.568 |
|
Table A5. Indicator-level collinearity (Outer VIF)
|
VIF |
|
|
ATD1 |
4.775 |
|
ATD2 |
1.809 |
|
ATD3 |
4.473 |
|
ATD4 |
2.159 |
|
GEI1 |
2.152 |
|
GEI2 |
3.584 |
|
GEI3 |
2.002 |
|
GEI4 |
2.550 |
|
GEI5 |
1.925 |
|
GEO1 |
2.019 |
|
GEO2 |
1.721 |
|
GEO3 |
1.396 |
|
GEO4 |
1.412 |
|
GPS1 |
1.977 |
|
GPS2 |
2.655 |
|
GPS3 |
2.451 |
|
GPS4 |
1.998 |
|
MCT1 |
2.951 |
|
MCT2 |
1.779 |
|
MCT3 |
2.142 |
|
MCT4 |
2.788 |
|
MI1 |
4.236 |
|
MI2 |
3.068 |
|
MI3 |
2.878 |
|
MI4 |
1.999 |
|
SC1 |
4.284 |
|
SC2 |
2.734 |
|
SC3 |
2.335 |
|
SC4 |
2.721 |
|
SC5 |
2.220 |
|
SDCI1 |
1.845 |
|
SDCI2 |
1.973 |
|
SDCI3 |
2.589 |
|
SDCI4 |
2.201 |
|
SDCI5 |
1.716 |
Table A6. Inner / Full-collinearity VIF
|
|
Access to Technology and Digital (X1) |
Government Policy Support (X3) |
Green Entrepreneurial Intention (X5) |
Green Entrepreneurial Orientation (Z2) |
Managerial Capacity and Training (X4) |
Marginalized Inclusion (Z1) |
Stakeholder Collaboration (X2) |
Sustainable Development in Creative Industry (Y) |
|
Access to Technology and Digital (X1) |
|
|
|
|
|
|
|
1.859 |
|
Government Policy Support (X3) |
|
|
|
|
|
|
|
2.153 |
|
Green Entrepreneurial Intention (X5) |
|
|
|
1.000 |
|
1.075 |
|
|
|
Green Entrepreneurial Orientation (Z2) |
|
|
|
|
|
|
|
1.519 |
|
Managerial Capacity and Training (X4) |
|
|
|
|
|
1.075 |
|
|
|
Marginalized Inclusion (Z1) |
|
|
|
|
|
|
|
1.948 |
|
Stakeholder Collaboration (X2) |
|
|
|
|
|
|
|
2.129 |
|
Sustainable Development in Creative Industry (Y) |
|
|
|
|
|
|
|
|
Table A7. Path analysis-Second-order GEO (reflective–reflective) measurement results
|
|
Original Sample (O) |
Sample Mean (M) |
Standard Deviation (STDEV) |
T Statistics (|O/STDEV|) |
P Values |
|
Access to Technology and Digital (X1) -> Sustainable Development in Creative Industry (Y) |
0.211 |
0.203 |
0.097 |
2.169 |
0.031 |
|
Government Policy Support (X3) -> Sustainable Development in Creative Industry (Y) |
-0.055 |
-0.051 |
0.102 |
0.537 |
0.592 |
|
Green Entrepreneurial Intention (X5) -> Green Entrepreneurial Orientation (Z2) |
0.829 |
0.840 |
0.036 |
22.899 |
0.000 |
|
Green Entrepreneurial Intention (X5) -> Marginalized Inclusion (Z1) |
0.356 |
0.355 |
0.073 |
4.876 |
0.000 |
|
Green Entrepreneurial Orientation (Z2) -> Sustainable Development in Creative Industry (Y) |
0.357 |
0.368 |
0.093 |
3.833 |
0.000 |
|
Managerial Capacity and Training (X4) -> Marginalized Inclusion (Z1) |
0.589 |
0.597 |
0.070 |
8.442 |
0.000 |
|
Marginalized Inclusion (Z1) -> Sustainable Development in Creative Industry (Y) |
0.506 |
0.496 |
0.099 |
5.101 |
0.000 |
|
Stakeholder Collaboration (X2) -> Sustainable Development in Creative Industry (Y) |
-0.016 |
-0.003 |
0.129 |
0.124 |
0.901 |
[1] Zhao, J., Chong, K., Jiang, M. (2024). Empirical analysis of internet finance’s promotion of innovation and entrepreneurship development: Mediating effect based on innovation and entrepreneurship willingness. Journal of the Knowledge Economy, 16: 3265-3285. https://doi.org/10.1007/s13132-024-01925-w
[2] Ovchynnykova, O., Martinkienė, J., Navickas, V. (2024). Enhancing global sustainability: The role of the blue economy in preserving natural capital. Challenges in Sustainability, 12(1): 65-79. https://doi.org/10.56578/cis120105
[3] UNEP. (2015). Inclusive Green Economy. United Nations Environment Programme (UNEP).
[4] Simorangkir, C.O., Ramadhan, G., Sukran, M.A., Manalu, T. (2024). Tourism development impact on economic growth and poverty alleviation in West Java. Jurnal Kepariwisataan Indonesia: Jurnal Penelitian Dan Pengembangan Kepariwisataan Indonesia, 18(2): 175-196. https://doi.org/10.47608/jki.v18i22024.175-196
[5] Paramita, R.W.D., Rizal, N., Sulistyan, R.B., Carito, D.W., Hakim, I., Hizham, F.A. (2022). Digital-based culture house in efforts to improve community economy in Papring Banyuwangi. In Proceedings of the International Colloquium on Business and Economics (ICBE 2022), pp. 259-269. https://doi.org/10.2991/978-94-6463-066-4_23
[6] Sasana, H., Da, H., Muid, D. (2017). The strategy development of the region in support borobudur tourism cluster competitiveness regions in Indonesia. Journal of Environmental Management and Tourism, 8(8): 1517-1528. https://doi.org/10.14505/jemt.v8.8(24).07
[7] Sasana, H., Prasetyanto, P.K., Priyono, N., Novitaningtyas, I. (2022). The importance of sustainable waste management due to socio-economic changes. International Journal of Energy Economics and Policy, 12(3): 170-174. https://doi.org/10.32479/ijeep.12665
[8] Rong, C., Cristia, J.F.E., Marian, M.L., Alzuman, A., Comite, U. (2025). Does green entrepreneurial orientation impact entrepreneurial success through green innovation capability in the manufacturing and services sector of emerging economies? International Entrepreneurship and Management Journal, 21(1): 51. https://doi.org/10.1007/s11365-024-01059-0
[9] Christopoulos, T.P., Matos, P.V., Borges, R.D. (2024). An ecosystem for social entrepreneurship and innovation: How the state integrates actors for developing impact investing in Portugal. Journal of the Knowledge Economy, 15(2): 7968-7992. https://doi.org/10.1007/s13132-023-01279-9
[10] Foster, C., Heeks, R. (2013). Conceptualising inclusive innovation: Modifying systems of innovation frameworks to understand diffusion of new technology to low-income consumers. European Journal of Development Research, 25(3): 333-355. https://doi.org/10.1057/ejdr.2013.7
[11] Hameed, K., Shahzad, K., Yazdani, N. (2023). Global incidences of inclusive entrepreneurial ecosystem: Conceptualization and measurement framework. Journal of the Knowledge Economy, 14(4): 5033-5064. https://doi.org/10.1007/s13132-023-01427-1
[12] Rohmah, S., Mulatsih, N.T. (2022). Local wisdom-based creative economy development strategy to achieve competitive advantage in the era of the industrial revolution 4.0 in Gunungkidul Regency. Jurnal REP (Riset Ekonomi Pembangunan), 7(2): 221-243. https://doi.org/10.31002/rep.v7i2.370
[13] Gweshengwe, B. (2025). An analysis of the contribution of nature-based solutions to poverty eradication. Discover Global Society, 3(1): 32. https://doi.org/10.1007/s44282-025-00167-8
[14] Nugraha, A.P., Mulyadi, Wulandari, I., Surya, T.M., Lestari, W. (2024). Green innovation as an MSME development strategy for supporting business sustainability. Proceedings Series on Proceedings of Multidisciplinary Sciences, 1(1): 158-173.
[15] Setiawan, M.H., Amin, B.F., Ratnawati, I. (2024). Green entrepreneurial intentions and university support for green entrepreneurial behavior: A systematic literature review. Research Horizon, 4(4): 339-350. https://doi.org/10.54518/rh.4.4.2024.344
[16] Radicic, D., Djalilov, K. (2019). The impact of technological and non-technological innovations on export intensity in SMEs. Journal of Small Business and Enterprise Development, 26(4): 612-638. https://doi.org/10.1108/JSBED-08-2018-0259
[17] Thawesaengskulthai, N., Chatmarathong, A., Koiwanit, J. (2024). Impact and policy supporting Thailand innovation driven enterprise: Orchestrating university innovation and entrepreneurship ecosystem with public and private stakeholders. Journal of Innovation and Entrepreneurship, 13(1): 16. https://doi.org/10.1186/s13731-024-00371-x
[18] Muldoon, J., Lee, Y., Liguori, E.W., Sahoo, S., Kumar, S. (2024). Mapping the entrepreneurship ecosystem scholarship: Current state and future directions. International Entrepreneurship and Management Journal, 20(4): 3035-3080. https://doi.org/10.1007/s11365-024-00975-5
[19] Ajzen, I. (1991). The theory of planned behavior. Organizational Behavior and Human Decision Processes, 50(2): 179-211. https://doi.org/10.1016/0749-5978(91)90020-T
[20] Ip, C.Y. (2024). From green entrepreneurial intention to behaviour: The role of environmental knowledge, subjective norms, and external institutional support. Sustainable Futures, 8: 100331. https://doi.org/10.1016/j.sftr.2024.100331
[21] Hussain, I., Nazir, M., Hashmi, S.B., Shaheen, I., Akram, S., Waseem, M.A., Arshad, A. (2021). Linking green and sustainable entrepreneurial intentions and social networking sites; The mediating role of self-efficacy and risk propensity. Sustainability, 13(13): 7050. https://doi.org/10.3390/su13137050
[22] Farinelli, F., Bottini, M., Akkoyunlu, S., Aerni, P. (2013). Green entrepreneurship: The missing link towards a greener economy. Atdf Journal, 8(3/4): 42-48.
[23] Jiang, W., Chai, H., Shao, J., Feng, T. (2018). Green entrepreneurial orientation for enhancing firm performance: A dynamic capability perspective. Journal of Cleaner Production, 198: 1311-1323. https://doi.org/10.1016/j.jclepro.2018.07.104
[24] Asad, M., Aledeinat, M., Majali, T., Almajali, D.A., Shrafat, F.D. (2023). Mediating role of green innovation and moderating role of resource acquisition with firm age between green entrepreneurial orientation and performance of entrepreneurial firms. Cogent Business and Management, 11(1): 2291850. https://doi.org/10.1080/23311975.2023.2291850
[25] Anwar, S.U., Xu, J., Yuan, P. Z., Su, K., Ur Rehman, S., Hameed, M., Wen, M., Li, F.Z. (2024). Green entrepreneurial orientation and environmental performance a moderated mediation perspective of perceived environmental innovation and stakeholder pressure. Scientific Reports, 14(1): 30266. https://doi.org/10.1038/s41598-024-81885-y
[26] Yousaf, Z., Radulescu, M., Sinisi, C.I., Serbanescu, L., Păunescu, L.M. (2021). Towards sustainable digital innovation of SMEs from the developing countries in the context of the digital economy and frugal environment. Sustainability, 13(10): 5715. https://doi.org/10.3390/su13105715
[27] Almtiri, Z.H.A., Miah, S.J., Noman, N. (2021). Application of e-commerce technologies in accelerating the success of SME operation (Version 1). arXiv preprint arXiv:2110.10836. https://doi.org/10.48550/arXiv.2110.10836
[28] Vashkevich, N., Barykin, S., Kapustina, I.V., Kupriyanova, M., Krasnov, A., Kharlamova, T.L., Kharlamov, A.V. (2024). Inclusive tourism ecosystems: Key stakeholders and their roles. Migration Letters, 21(S8): 1263-1269.
[29] Maccioni, S., d’Angella, F., De Carlo, M., Sfogliarini, B. (2024). Stakeholder engagement and triggers for sustainable development in complex fragile ecosystems: Evidence from Alpine Trentino Region. Sustainability, 16(22): 9879. https://doi.org/10.3390/su16229879
[30] Fujimoto, Y., Azmat, F., Uddin, J. (2024). Inclusive leadership toward reshaping corporate purpose for sustainable development. Leadership, 20(5): 289-313. https://doi.org/10.1177/17427150241258878
[31] Heubeck, T. (2024). Looking back to look forward: A systematic review of and research agenda for dynamic managerial capabilities. Management Review Quarterly, 74(4): 2243-2287. https://doi.org/10.1007/s11301-023-00359-z
[32] Roy, P., Bhatt, S., Dani, R., Singh, P.K., Vasudevan, A., Singh, E.N. (2025). Skill and strategy: How managerial ability drives working capital efficiency. F1000Research, 14. https://doi.org/10.12688/f1000research.162551.1
[33] Yacob, P., Peter, D., Chin, K.S. (2022). Sustainable business practices in manufacturing SMEs: The mediating effect of dynamic capabilities. International Social Science Journal, 72(243): 73-89. https://doi.org/10.1111/issj.12303
[34] Muangmee, C., Dacko-Pikiewicz, Z., Meekaewkunchorn, N., Kassakorn, N., Khalid, B. (2021). Green entrepreneurial orientation and green innovation in small and medium-sized enterprises (SMEs). Social Sciences, 10(4): 136. https://doi.org/10.3390/socsci10040136
[35] Öztürk, R., Öztürk, M., Kızılkan, Z. (2024). Meta-analysis of the relationship between green entrepreneurial orientation and sustainable firm performance. Sustainability, 16(24): 11224. https://doi.org/10.3390/su162411224
[36] Spadaro, I., Pirlone, F., Bruno, F., Saba, G., Poggio, B., Bruzzone, S. (2023). Stakeholder participation in planning of a sustainable and competitive tourism destination: The genoa integrated action plan. Sustainability, 15(6): 5005. https://doi.org/https://doi.org/10.3390/su15065005
[37] Chen, C., Pinar, M., Román-Collado, R. (2024). Green innovation and energy efficiency: Moderating effect of institutional quality based on the threshold model. Environmental and Resource Economics, 87(12): 3063-3094. https://doi.org/10.1007/s10640-024-00902-w
[38] Zhang, X., Qin, J. (2025). How does a government-certificated green identity improve enterprises’ market value? International Review of Economics and Finance, 101: 104147. https://doi.org/10.1016/j.iref.2025.104147
[39] Supriyono, Probohudono, A.N., Suhardjanto, D. (2024). Model for strengthening MSMEs in the cultural heritage of borobudur temple based on the green industry concept: A mixed-method analysis. International Journal of Sustainable Development and Planning, 19(5): 1955-1961. https://doi.org/10.18280/ijsdp.190534
[40] Reimers, F.M. (2024). Entrepreneurship education to improve the world: The role of the Sustainable Development Goals to stimulate innovation in higher education. Entrepreneurship Education, 7(3): 203-217. https://doi.org/10.1007/s41959-024-00127-4
[41] Ajzen, I. (2006). Constructing a Theory of Planned Behavior Questionnaire. TPB Questionnaire Construction, 1-12.
[42] Myrovali, G., Tzanis, G., Morfoulaki, M. (2025). Sustainable tourism through digitalization and smart solutions. Sustainability, 17(12): 5383. https://doi.org/10.3390/su17125383
[43] Hartono, A., Roostika, R., Darmawan, B.A. (2024). Direction on digital technology adoption for SMEs before, during and after the pandemic COVID-19: An insight from Indonesian SMEs. Journal of Ecohumanism, 3(8): 6169-6177. https://doi.org/10.62754/joe.v3i8.5218
[44] Sudirman, I.D., Astuty, E., Aryanto, R. (2025). Enhancing digital technology adoption in SMEs through sustainable resilience strategy: Examining the role of entrepreneurial orientation and competencies. Journal of Small Business Strategy, 35(1): 97-114. https://doi.org/10.53703/001c.124907
[45] Liu, T., Kou, I.T.E. (2024). Determinants for the development of creative tourism: A stakeholder perspective. Heliyon, 10(13): e33727. https://doi.org/10.1016/j.heliyon.2024.e33727
[46] Suparjo, Dana, Y.A., Kumala, C.M., Sunarsih, E.S. (2024). Stakeholder collaboration in sustainable tourism development in Tana Toraja, South Sulawesi Province, Indonesia: Efforts to improve tourist visits. Journal of Economics, Finance and Management Studies, 7(6): 3669-3677. https://doi.org/10.47191/jefms/v7-i6-58
[47] Astawa, I.P., Astawa, I.N.G.A., Ardina, C., Asta, Ngr. P.R.N. (2025). Green accounting practice model for tourism villages in support of sustainable tourism in Bali. Hospitality, Travel and Business Event, 7(1): 316-323. https://doi.org/10.33649/pusaka.v6i2.344
[48] Wang, C., Chen, P., Hao, Y., Dagestani, A.A. (2022). Tax incentives and green innovation-The mediating role of financing constraints and the moderating role of subsidies. Frontiers in Environmental Science, 10: 1067534. https://doi.org/10.3389/fenvs.2022.1067534
[49] Soulez, C.G., Onge, S. Saint, Soulez, S. (2022). Green certification and organizational attractiveness: The moderating role of firm ownership. Corporate Social Responsibility and Environmental Management, 29(1): 189-199. https://doi.org/10.1002/csr.2194
[50] Wang, F., Feng, H. (2024). Does incentive-based green governance compensate for green innovation in enterprises? The role of green orientation. Environmental Science and Pollution Research, 31(5): 7443-7464. https://doi.org/10.1007/s11356-023-31671-6
[51] Sadeghi, V.J., Mahdiraji, H.A., Alam, G.M., Mazzoleni, A. (2023). Entrepreneurs as strategic transformation managers: Exploring micro-foundations of digital transformation in small and medium internationalisers. Journal of Business Research, 154: 113287. https://doi.org/10.1016/j.jbusres.2022.08.051
[52] Mortazavi, S., Raatikainen, M., Hiltunen, E., Teplov, R., Väätänen, J., Gabrielsson, M. (2025). From outsider to insider: A Western SME’s journey to inclusive innovation in a base-of-the-pyramid market. Journal of Business Research, 186: 115042. https://doi.org/10.1016/j.jbusres.2024.115042
[53] Villca, R.C., Risco, A.A., Moncada, R.A., Aracena, C.M., Arcentales, S.D.A., Davies, N.M., Yáñez, J.A. (2024). Green entrepreneurial intentions among university students in Chile: Use of PLS-SEM. Development Studies Research, 11(1): 2336909. https://doi.org/10.1080/21665095.2024.2336909
[54] Paiva, L.E.B., Nassif, V.M.J., De Lima, T.C.B., Rebouças, S.M.D.P. (2023). Entrepreneurial intention and sustainability: An analysis through bibliometric networks. Estudios Gerenciales, 39(167): 248-259. https://doi.org/10.18046/j.estger.2023.167.5725
[55] Salamzadeh, A., Kesim, H.K. (2017). The enterprising communities and startup ecosystem in Iran. Journal of Enterprising Communities, 11(4): 456-479. https://doi.org/10.1108/JEC-07-2015-0036
[56] Escobar, M.A.P. (2022). Sustainable innovation and inclusive business in Latin America. Innovation and Management Review, 19(3): 192-207. https://doi.org/10.1108/INMR-07-2021-0116
[57] Wang, Y., Wang, Q., Pan, X., Mata, M. (2024). Green entrepreneurial intention, knowledge management process, and green entrepreneurial behaviour through a lens of transformative innovation. Journal of Innovation & Knowledge, 9: 100567. https://doi.org/10.1016/j.jik.2024.100567
[58] Erdogan, S., Pata, U.K., Okumus, I., Solarin, S.A. (2024). Uncovering the linkage among tourism diversification, economic development, energy consumption, population density, technology, and carbon emissions: Empirical evidence from New Zealand. Air Quality, Atmosphere and Health, 17(11): 2601-2613. https://doi.org/10.1007/s11869-024-01594-3
[59] Al-Mamary, Y.H. (2025). Factors shaping green entrepreneurial intentions towards green innovation: An integrated model. Future Business Journal, 11(1): 21. https://doi.org/10.1186/s43093-025-00443-8
[60] Turčinović, M., Vujko, A., Stanišić, N. (2025). Community-led sustainable tourism in rural areas: Enhancing wine tourism destination competitiveness and local empowerment. Sustainability, 17(7): 2878. https://doi.org/10.3390/su17072878
[61] Moise, G., Popescu, A., Bratu, I.A., Răducuță, I., Nistoreanu, B.G., Stanciu, M. (2023). Can we talk about smart tourist villages in Mărginimea Sibiului, Romania? Sustainability, 15(9): 7475. https://doi.org/10.3390/su15097475
[62] Maziliauske, E. (2024). Innovation for sustainability through co-creation by small and medium-sized tourism enterprises (SMEs): Socio-cultural sustainability benefits to rural destinations. Tourism Management Perspectives, 50: 101201. https://doi.org/10.1016/j.tmp.2023.101201
[63] Momayez, A., Rasouli, N., Alimohammadirokni, M., Rasoolimanesh, S.M. (2023). Green entrepreneurship orientation, green innovation and hotel performance: The moderating role of managerial environmental concern. Journal of Hospitality Marketing & Management, 32(8): 981-1004. https://doi.org/10.1080/19368623.2023.2225495
[64] Coelho, A., Ferreira, J., Proença, C. (2024). The impact of green entrepreneurial orientation on sustainability performance through the effects of green product and process innovation: The moderating role of ambidexterity. Business Strategy and the Environment, 33(4): 3184-3202. https://doi.org/10.1002/bse.3648
[65] Hair, J.F., Tomas, G., Hult, M., Ringle, C.M., Sarstedt, M. (2022). A Primer on Partial Least Squares Structural Equation Modeling (PLS-SEM) (3rd ed.). Sage Publications.
[66] Faul, F., Erdfelder, E., Buchner, A., Lang, A.G. (2009). Statistical power analyses using G*Power 3.1: Tests for correlation and regression analyses. Behavior Research Methods, 41(4): 1149-1160. https://doi.org/10.3758/BRM.41.4.1149
[67] Hair, J.F., Hult, G.T.M., Ringle, C.M., Sarstedt, M. (2019). A Primer on PLS-SEM (2nd ed.). Sage.
[68] Bagozzi, R.P., Yi, Y. (1988). On the evaluation of structural equation models. Journal of the Academy of Marketing Science, 16(1): 74-94. https://doi.org/10.1007/BF02723327
[69] Chin, W.W., Dibbern, J. (2010). An introduction to a permutation based procedure for multi-group PLS analysis: Results of tests of differences on simulated data and a cross cultural analysis of the sourcing of information system services between Germany and the USA. In Handbook of Partial Least Squares. Springer Berlin Heidelberg, pp. 171-193. https://doi.org/10.1007/978-3-540-32827-8_8
[70] Vinzi, V.E., Trinchera, L., Amato, S. (2010). PLS path modeling: From foundations to recent developments and open issues for model assessment and improvement. In Handbook of Partial Least Squares. Springer Berlin Heidelberg, pp. 47-82. https://doi.org/10.1007/978-3-540-32827-8_3
[71] Henseler, J., Ringle, C.M., Sarstedt, M. (2015). A new criterion for assessing discriminant validity in variance-based structural equation modeling. Journal of the Academy of Marketing Science, 43(1): 115-135. https://doi.org/10.1007/s11747-014-0403-8
[72] Kuckertz, A., Wagner, M. (2010). The influence of sustainability orientation on entrepreneurial intentions — Investigating the role of business experience. Journal of Business Venturing, 25(5): 524-539. https://doi.org/10.1016/j.jbusvent.2009.09.001
[73] Belz, F.M., Binder, J.K. (2017). Sustainable entrepreneurship: A convergent process model. Business Strategy and the Environment, 26(1): 1-17. https://doi.org/10.1002/bse.1887
[74] Schlaegel, C., Koenig, M. (2014). Determinants of entrepreneurial intent: A meta–analytic test and integration of competing models. Entrepreneurship Theory and Practice, 38(2): 291-332. https://doi.org/10.1111/etap.12087
[75] Chin, W.W. (1998). The partial least squares approach to structural equation modeling. In Modern Methods for Business Research. Psychology Press, pp. 295-336.
[76] Shmueli, G., Sarstedt, M., Hair, J.F., Cheah, J.H., Ting, H., Vaithilingam, S., Ringle, C.M. (2019). Predictive model assessment in PLS-SEM: Guidelines for using PLSpredict. European Journal of Marketing, 53(11): 2322-2347. https://doi.org/10.1108/EJM-02-2019-0189
[77] Pasquinelli, C., Trunfio, M. (2023). Smart technologies for sustainable tourism development: Exploring practices in European destinations. In Sustainability-Oriented Innovation in Smart Tourism. Tourism on the Verge. Springer, Cham. https://doi.org/10.1007/978-3-031-33677-5_4
[78] Philbin, S., Viswanathan, R., Telukdarie, A. (2022). Understanding how digital transformation can enable SMEs to achieve sustainable development: A systematic literature review. Small Business International Review, 6(1): e473. https://doi.org/10.26784/sbir.v6i1.473
[79] Tang, Y. (2023). A study of the impact of digital technology capabilities on firm performance—A moderated mediation model. Accounting and Corporate Management, 5(10): 91-99. https://doi.org/10.23977/acccm.2023.051014
[80] Etzkowitz, H., Leydesdorff, L. (2000). The dynamics of innovation: From National Systems and “Mode 2” to a Triple Helix of university–industry–government relations. Research Policy, 29(2): 109-123. https://doi.org/10.1016/S0048-7333(99)00055-4
[81] Koiwanit, J., Filimonau, V. (2023). Stakeholder collaboration for solid waste management in a small tourism island. PLoS ONE, 18(7): e0288839. https://doi.org/10.1371/journal.pone.0288839
[82] Ng, W.K., Hsu, F.T., Chao, C.F., Chen, C.L. (2023). Sustainable competitive advantage of cultural heritage sites: Three destinations in East Asia. Sustainability, 15(11): 8593. https://doi.org/10.3390/su15118593
[83] Li, Y., Zhang, S., Zhou, Q. (2024). Government subsidies, green innovation, and SME performance in China. Business Strategy and the Environment, 33(2): 456-472.
[84] Duan, Y., Xi, B., Xu, X., Xuan, S. (2024). The impact of government subsidies on green innovation performance in new energy enterprises: A digital transformation perspective. International Review of Economics & Finance, 94: 103414. https://doi.org/10.1016/j.iref.2024.103414
[85] Peng, H., Pan, Y. (2024). The effects of environmental regulations on the sustainable entrepreneurship from the perspective of dynamic capabilities: A study based on Chinese new energy enterprises. Frontiers in Energy Research, 11. https://doi.org/10.3389/fenrg.2023.1295448
[86] Andriansyah, A., Satispi, E., Samudra, A.A. (2024). Government policy towards small and medium tourism enterprises in Indonesia: Proposal for development and increasing regional revenue. Journal of Infrastructure, Policy and Development, 8(8): 6865. https://doi.org/10.24294/jipd.v8i8.6865
[87] Vuorio, A., Torkkeli, L. (2023). Dynamic managerial capability portfolios in early internationalising firms. International Business Review, 32(1): 102049. https://doi.org/10.1016/j.ibusrev.2022.102049
[88] Cardeal, G., Leite, M., Ribeiro, I. (2023). Decision-support model to select spare parts suitable for additive manufacturing. Computers in Industry, 144: 103798. https://doi.org/10.1016/j.compind.2022.103798
[89] Man, T.W.Y., Lau, T., Chan, K.F. (2002). The competitiveness of small and medium enterprises a conceptualization with focus on entrepreneurial competencies. Journal of Business Venturing, 17: 123-142. https://doi.org/10.1016/S0883-9026(00)00058-6
[90] Urban, B. (2010). Creating value and innovation through social entrepreneurship. In Frontiers in Entrepreneurship. Springer Berlin Heidelberg, pp. 115-138. https://doi.org/10.1007/978-3-642-04502-8_5
[91] Salamzadeh, A., Mortazavi, S., Hadizadeh, M., Braga, V. (2023). Examining the effect of business model innovation on crisis management: The mediating role of entrepreneurial capability, resilience and business performance. Innovation and Management Review, 20(2): 132-146. https://doi.org/10.1108/INMR-11-2021-0213
[92] Apostolopoulos, N., Kakouris, A., Liargovas, P., Petropoulos, D., Anastasopoulou, E.E. (2024). Exploring the impact of crises on rural agri-food SMEs: The moderating role of support mechanisms, digitalisation, and networking. The International Journal of Entrepreneurship and Innovation. https://doi.org/10.1177/14657503241270275
[93] Meek, W.R., Pacheco, D.F., York, J.G. (2010). The impact of social norms on entrepreneurial action: Evidence from the environmental entrepreneurship context. Journal of Business Venturing, 25(5): 493-509. https://doi.org/10.1016/j.jbusvent.2009.09.007
[94] Daellenbach, K., Zhu, X. (2023). From intention to orientation: Drivers of green entrepreneurship in tourism firms. Tourism Management, 94.
[95] Leonidou, L.C., Leonidou, C.N., Fotiadis, T.A., Aykol, B. (2015). Dynamic capabilities driving an eco-based advantage and performance in global hotel chains: The moderating effect of international strategy. Tourism Management, 50: 268-280. https://doi.org/10.1016/j.tourman.2015.03.005
[96] Lawelai, H., Sadat, A., Harakan, A. (2024). The level of local community involvement in sustainable tourism marketing of the world coral triangle in Wakatobi National Park, Indonesia. International Journal of Sustainable Development and Planning, 19(12): 4831-4841. https://doi.org/10.18280/ijsdp.191230
[97] Hall, J.K., Daneke, G.A., Lenox, M.J. (2010). Sustainable development and entrepreneurship: Past contributions and future directions. Journal of Business Venturing, 25(5): 439-448. https://doi.org/10.1016/j.jbusvent.2010.01.002
[98] Asadi, S., OmSalameh Pourhashemi, S., Nilashi, M., Abdullah, R., Samad, S., Yadegaridehkordi, E., Aljojo, N., Razali, N.S. (2020). Investigating influence of green innovation on sustainability performance: A case on Malaysian hotel industry. Journal of Cleaner Production, 258: 120860. https://doi.org/10.1016/j.jclepro.2020.120860
[99] Chen, Y.S., Lai, S.B., Wen, C.T. (2006). The influence of green innovation performance on corporate advantage in Taiwan. Journal of Business Ethics, 67(4): 331-339. https://doi.org/10.1007/s10551-006-9025-5
[100] Alt, E., Spitzeck, H. (2016). Improving environmental performance through unit-level organizational citizenship behaviors for the environment: A capability perspective. Journal of Environmental Management, 182: 48-58. https://doi.org/10.1016/j.jenvman.2016.07.034