Marat Safiullin![]() | Leonid Elshin*
| Leonid Elshin*![]() | Almaz Mingulov
| Almaz Mingulov![]()
© 2025 The authors. This article is published by IIETA and is licensed under the CC BY 4.0 license (http://creativecommons.org/licenses/by/4.0/).
OPEN ACCESS
In modern politics, trade and economic sanctions have become a tool of pressure and foreign policy leverage. Policymakers, scholars, and business communities continually question the impact of sanctions on targeted countries or groups of countries and the processes affecting regions and continents. A strategically important task is the development of methodological tools to forecast the potential consequences of economic sanctions on a region. This study focuses on the Republic of Tatarstan, one of Russia’s most developed regions. The research subject is the economic relationships formed by the transformation of the region’s exports and imports in the context of sanctions against Russia and the resulting changes in its economic dynamics. The article employs an original methodological approach integrating qualitative and quantitative analysis methods. This approach establishes a framework for identifying the economic sectors in the region that are most vulnerable to import dependencies and that influence the region’s overall economic growth dynamics. Its application showed Tatarstan’s import-dependent economic sectors and, based on this, formulated a series of equations providing a foundation for forecasting the region’s development under the sanctions imposed on the Russian national economy.
import dependence, region, regional systems management, sanctions, supply chains, sustainable economic development
Under external sanctions since 2022, Russia has witnessed significant changes in transnational value chains. These changes have led to institutional and market shifts, determining a new configuration of export-import flows and restructuring economic relationships.
Over 15,000 sanctions had been imposed on Russia by the end of 2023 [1-3]. These sanctions have impacted foreign trade relations and the mechanisms governing financial markets, including restrictions on transnational payments and financial operations. The withdrawal of several foreign companies from the Russian market has identified new directions and tools to adapt the national economy to these emerging conditions.
The features of Russia’s foreign economic activities highlight emerging risks to the sustainable development of its national economy under sanctions. Equally critical is how uniformly these risks are distributed across regional systems. To answer this question, it is necessary to develop models that evaluate the extent of regional threats resulting from sanctions on the national economy.
These issues gain particular relevance considering that Russian regions, with varying degrees of integration into international economic relations, demonstrate different levels of economic resilience amid foreign economic transformations. In this context, research aimed at identifying key parameters of regional development under external pressure and specific regional dependencies on exports and imports has the potential to outline strategies for risk localization and state-level governance measures at the meso level.
A particular interest, in the context of the issues raised, is drawn to studies focusing on the constituent entities of the Russian Federation that act as key donors to the Russian economy. This is due to the fact that these regions are the most integrated into the system of international trade and, consequently, play a decisive role in shaping macroeconomic trajectories and ensuring their stability amid systemic transformations. One of the regions in Russia that undoubtedly belongs to this category is the Republic of Tatarstan. Contributing more than 5% of Russia’s GDP, it significantly influences the industrial, innovative, structural, and investment development of the national economy. In this regard, it seems appropriate to focus research attention on this region and, using it as a case study, assess the resilience of Russian regions to external shocks.
Despite the active discussion of sustainable development coupled with adaptation to sanctions in economic research, remaining studies mostly remain on the macroeconomic level while relying upon descriptive statistical approaches. Academics have hardly been applying themselves to formulating precise organized instruments which gauge local weaknesses plus assess how import linkages affect fiscal durability. This investigation tackles that deficiency via application of a regression-centered construct to Tatarstan’s economy. Consequently, import reliance across sectors connects to local growth patterns during sanctions.
To achieve this aim, the study utilizes a model that integrates elucidative statistical analysis, cluster analysis, plus regression modeling of customs data from 2010, 2021. A select cluster of countries coupled with industries renders Tatarstan’s economy quite reliant as the results present. Regression analysis evinces that a 1% deceleration within designated import-dependent sectors might diminish the region’s GRP via approximately 0.76%. This stresses that regional development remains susceptible, and it exemplifies that the suggested methodological tactic is helpful to extended implementation.
Thus, this study aims to develop methodological tools capable of identifying risks and threats to the sustainable development of regional economic systems in Russia amidst ongoing systemic transformations.
Scientific literature pays considerable attention to the sustainable development of economic systems at the macro and meso levels. This research area gained particular relevance in the early 2010s, marked by intensified international competition, including sanctions [4].
Implementing state foreign economic policy in competitive conditions and adapting economic entities to a rapidly changing institutional and market environment have long been recognized challenges [5].
Modern scholars pay significant attention to the sustainable development of economic systems under the evolving external economic agenda. Theories and research methods addressing these issues at the macro level are reflected in the works by Sukharev [6], Chernova [7], Yaroshevich and Migunov [8], Elshin et al. [9], Grimme et al. [10], He and Huang [11], Irwin [12], Alessandria et al. [13], Leibovici and Waugh [14], Soderbery [15], Bershka and Lee [16], etc.
It is important to emphasize that the scholars cited here have addressed research problems related to the topic primarily through the lens of developing and substantiating adaptation programs for import substitution. For example, in the work of Safiullin et al. [5], it is noted that under conditions of heightened external shock pressure, a key priority in the implementation of national economic policy should be a protectionist import substitution strategy. According to the authors, the effectiveness of this policy significantly contributes to the processes of adaptation and the further strengthening of sustainable development potential in the national economy under systemic transformation.
Similar views are held by Grimme et al. [10], He and Huang [11], Irwin [12]. In their study, Grimme et al. [10] emphasize that one of the key strategic adaptation tools for developing countries under increasing pressure from externally generated restrictions is the alignment of national macroeconomic policy with a structuralist approach to import substitution programs. In other words, the sustainability of macroeconomic dynamics is largely shaped by protectionist state policies within the framework of foreign economic strategy. Excessive liberalization in foreign trade relations under conditions of systemic transformation leads to negative consequences for the national economies of developing countries.
Despite the existence of academic work on the development of sustainable development mechanisms for economic systems in the context of transforming external geopolitical agendas, it should be noted that the dominant focus of research remains at the macroeconomic level. It should be mentioned that the prospects for developing economic systems at the regional level are not sufficiently covered in scientific literature. Meanwhile, this particular research “focus” holds equally critical importance both for academic inquiry and for addressing practical challenges related to the search for and development of adaptive mechanisms for sustainable economic development. This research focus holds equally critical importance for scientific advancement and practical tasks. Despite the often-debated topic and active attempts to develop unified methodological approaches for assessing the impact of trade and financial restrictions on regional development, scholars tend to focus on specific scientific tasks. For example, regional characteristics of economic system adaptation to the transformation of foreign trade relations are explored by Uvarova et al. [17], Adewale [18], and Broocks and Biesebroeck [19].
The impact of sanctions limiting the export-import potential of regions is explored by Zolotukhina [20], Kazikhanov [21], Babina et al. [22], Fang et al. [23], Cardero and Galindo [24], Hoang and Breugelmans [25], Karuppiah and Sankaranarayanan [26], Koren et al. [27], Bali and Rapelanoro [28], etc. The main research emphasis in these works shifts toward the analysis and assessment of the impact of sanction pressure on the prospects of economic dynamics in developing countries. It is important to note that, as in the previous case, the methodological toolkit is generally limited to descriptive analysis of statistical data, without the use of modeling to examine the interrelationships between the studied phenomena.
Despite the availability of studies on sustainable regional economic development under the transformation of external cooperative ties, it is essential to acknowledge the need for further development of methodological tools in this area. This is due both to the insufficient development of methodological approaches for constructing economic-mathematical models at the meso-level in the context of the issues raised here, and to the need to adapt existing approaches to the new configuration of transformational processes triggered by trade and financial sanctions. In this regard, particular interest emerges at the level of regions that serve as the locomotives of national economic systems. In the case of Russia, this is undoubtedly the Republic of Tatarstan, which stands out as one of the country's key leaders in terms of industrial, investment, and innovation development. The degree of its resilience to external macroeconomic disruptions will, to a large extent, shape broader expectations regarding the prospects for sustainable economic development in Russia as a whole.
To achieve our objective, we assessed the Republic of Tatarstan’s economic growth prospects under import localization conditions. We found it appropriate to conduct a descriptive analysis of the key features and characteristics of the region’s foreign economic activity.
The empirical analysis hinges upon periodic data originating from 2010 to 2021. This duration was selected because it mirrors foreign trade's structural arrangements. These patterns coupled with regional development occurred during the years preceding geopolitical tensions escalating in 2022. By setting up a firm groundwork, the analysis permits important appraisal regarding localized frailties via concentrating on the prior timeframe of 2022, also supplying a benchmark concerning ensuing contrasts amid the post-sanctions timeframe.
Given that economic sanctions result from political influence and tools of foreign policy conflict, we classified countries into two groups (“friendly” and “unfriendly”) based on the official list [29].
From a research perspective, this approach allows for a more comprehensive assessment of the potential risks for Russia depending on a country’s political stance.
Given the critical importance of understanding the type of import dependency (whether imports originate from friendly or unfriendly countries), it is advisable to evaluate this aspect on an industry-specific basis. This approach allows one to identify the region’s vulnerability to the supply of foreign goods for final and intermediate consumption based on their countries of origin and categorization as friendly or unfriendly. It is necessary to determine whether a category of imported goods is critically significant depending on the geography of its supply. To address this issue, a cluster analysis was conducted on the identified product groups, considering the status of their countries of origin.
Our approach to empirically assessing the impact of disrupted transnational economic ties on the stability of regional economic sectors and the overall formation of gross regional product (GRP) is based on constructing a series of regression equations. The dynamics of GRP serve as the endogenous variable, while the growth rates of import-dependent regional economic activities are treated as exogenous factors. To identify these factors, we applied a method that compares the product categories imported from other countries and used in the economic activities of these sectors with the All-Russian Classifier of Types of Economic Activity (OKVED).
The study’s statistical base includes data from the Federal Customs Service of the Russian Federation on product categories imported into Russia and Tatarstan. The analysis encompasses a dynamic assessment of 97 product groups imported from 253 supplier countries.
Given that the range of product categories covers a wide variety of goods, including those with a negligible share in the region’s imports, it is advisable to filter the analyzed data by excluding foreign goods for final and intermediate consumption with a share of less than 0.5% of the region’s total imports. The remaining key product groups are the foundation for constructing econometric equations to determine the impact of import-dependent economic sectors on the region’s potential economic growth prospects.
The equations were constructed using statistical data from the period 2010-2021 (quarterly data). In the first stage, missing values were identified and processed, and a normalization procedure was applied to the analyzed data.
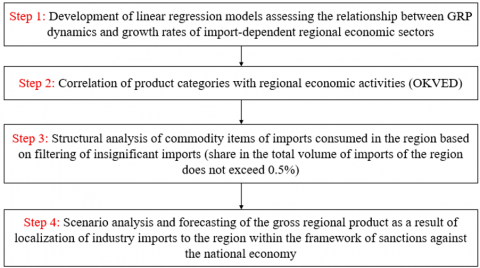
A graphical representation of the proposed methodological toolkit for the study is shown in Figure 1.
Following the algorithm for constructing a research model to assess the impact of import-dependent economic sectors on the stability of regional economic growth (Figure 1), corresponding evaluations were conducted. Each regression equation, assessed discretely with respect to those specified sectors, utilized GRP as its criterion, with sectoral growth rates being predictors. The models constitute straightforward regressions.
Figure 1. Methodological tools for assessing the impact of import-dependent sectors of the regional economy on the dynamics of its economic growth
The regression models were validated using standard residual diagnostics, including tests for normality, heteroscedasticity, and autocorrelation. Verified fundamental model suppositions came to be affirmed by means of these inspections. Furthermore, we scrutinized resilience when we surveyed sensitivity as well as re-estimated on subsamples, which evinced firm coefficients across disparate specifications.
In the first stage, iterations were conducted to align the imports of the identified key product categories with the economic sectors of the region that are the main consumers of these products. This approach enables the analysis to move to specific economic activities. As a result, 10 economic activities were identified as the most critical for Tatarstan in terms of import dependency. Together, these activities account for over 87% of total imports.
$x_1$ is the manufacture of cutlery, tableware, tools, and general hardware;
$x_2$ is the manufacture of cast iron, steel, and ferroalloys;
$x_3$ is the manufacture of petroleum products;
$x_4$ is the manufacture of rubber products;
$x_5$ is the manufacture of electrical equipment;
$x_6$ is the manufacture of other chemical products;
$x_7$ is the manufacture of plastic products;
$x_8$ is the manufacture of motor vehicles, trailers, and semi-trailers;
$x_9$ is the manufacture of computers, electronic, and optical products;
$x_{10}$ is the manufacture of furniture.
Based on the algorithm (Figure 1), regression equations were constructed for each of these sectors. These equations are unique to the specific characteristics and dependencies of the respective economic activities. The results of the regression analysis are presented in Table 1. The low correlation observed for some product groups is attributed to the irregular nature of import flows for those items.
Based on the conducted correlation analysis, economic sectors with a moderate to high correlation with the dependent variable (GRP) were identified:
–Manufacture of other chemical products;
–Manufacture of plastic products;
–Manufacture of motor vehicles, trailers, and semi-trailers;
–Manufacture of computers, electronic, and optical products;
–Manufacture of furniture.
The results help estimate the cumulative effect caused by restrictions on the supply of critical imported goods to the region. Using scenario modeling methods and sensitivity analysis, the integrated contribution of these sectors to regional economic growth was determined under the assumption of a potential slowdown in their dynamics. To quantify the cumulative effect of import supply restrictions on the region’s most critical product categories, a regression equation was constructed:
$\begin{gathered}y=74.7+0.14 x_1+0.2 x_2 +0.19 x_3+0.12 x_4+0.11 x_5\end{gathered}$ (1)
4.1 Russia’s external trade and sanctions impact
According to the packages of sanctions imposed against Russia, several international companies are in the process of reorganizing their Russian assets (Table 1). According to Funakoshi et al. [3], 149 companies and organizations left the Russian market from 2022 to 2023. The largest number of companies that left the market belongs to the consumer sector (44 entities, or 29.5% of the total number of foreign companies that left). 11.4% of companies are in the automotive industry, 19.5% in the sports industry, 9.4% in the energy sector, 8.7% in the financial sector, 2% in the aviation industry, 12.1% in the technology sector, 2.7% in the logistics sector, 4.7% in the economy, and 2% in personal wealth. Manufacturing and construction sectors account for 4.7 and 0.7%, respectively.
Table 1. Companies or organizations that left the Russian market by sectors
|
Car Manufacturers |
Renault, VolvoCars, ABVolvo, GeneralMotors, DaimlerTruck, BMW, Ford, Harley-Davidson, JaguarLandRover, Toyota, Mercedes-Benz, Volkswagen, Eneos, Renault, Inchcape, Renault, SchneiderElectric |
|
Sports |
FIDE, FIFA, UEFA, Formula One, IPC, Diamond League, Decathlon |
|
Energy |
BP, Equinor, TotalEnergies, SiemensEnergyAG, ExxonMobil, Shell, RioTinto, Equinor, RWE, Halliburton, Schlumberger, BakerHughes, Weatherford, EnBW, Euronav, KinrossGold, Saipem, Marubeni, SKF, ESIGroup, Fortum, Equinor |
|
Finances |
HSBC, NordeaAssetManagement, Visa, Mastercard, INGGroepNV, Mashreqbank, AmericanExpress, KPMG, Citigroup, SwissRe, Allianz, SocieteGenerale, PPF |
|
Airlines |
AerCap Holdings, Boeing, Airbus |
|
Technologies |
Nokia, Apple, Spotify, Alphabet, Microsoft, Samsung, Netflix, TikTok, SpotifyTechnology, Hexagon, Intel, Ericsson, Nokia, Adevinta, DJI, Atos, Siemens, Oerlikon |
|
Logistics |
United Parcel Service, A.P. Moller-Maersk, MoneyGram, Mondi |
|
Consumer |
CanadaGoose, Ikea, Nike, Airbnb, Booking, Inditex, Danone, Procter&Gamble, Coca-Cola, Ferrari, McDonald’s, YumBrands, Starbucks, Accor, Heineken, BritishAmericanTobacco, ImperialBrands, Abbvie, Novartis, EliLilly, Merck, RadissonHotelGroup, Nestle, Carlsberg, Heineken, Johnson&Johnson, GSK, Lavazza, ABB, ESSITY, AbInBev, Valio, AAK, OBI, Coty, TangiamoTouch, DSV, LPP, Raisio, Fazer, Paulig, McDonald’s, Autogrill, Marriott |
|
Economy |
HaysPlc, InterContinentalHotelsGroup (IHG), Nestle, Publicis, BNPParibas, Rabobank, Danfoss, StarbucksCorp, SulzerAG |
|
Personal Wealth |
Julius Bär, UniCredit, Global Payments |
|
Manufacturers |
Continental, IMCD, London Metal Exchange, Emerson Electric, Kemira, Delfingen, YIT Oyj |
|
Construction |
Holcim |
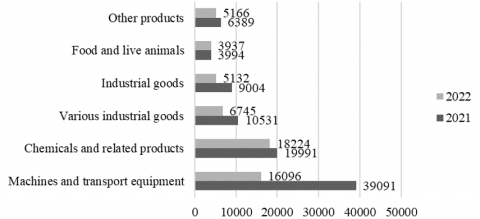
In 2022, the cost of all commodity groups imported to Russia decreased compared to 2021. For example, the commodity structure of imports of European goods to Russia for all commodity groups changed by 26%. The EU mainly limited the export of machinery and transport equipment, which are in greatest demand in Russia (Figure 2).
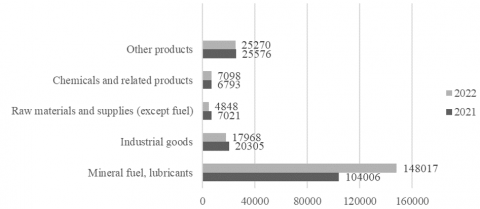
As for the export of Russian goods to EU countries, an opposite trend is observed. By the end of 2022, the total volume of key product categories exported to the EU increased. This growth was primarily driven by a significant rise in the supply of mineral fuels and lubricants, which surged by 42.3% in the same year (Figure 3).
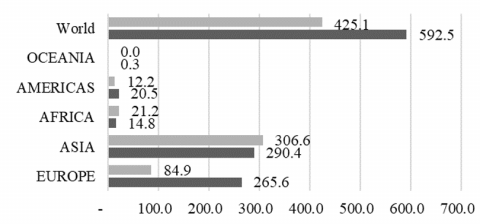
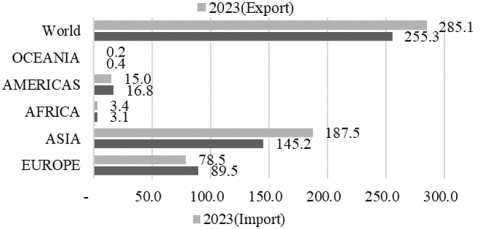
In 2023, the trends typical of 2022, marked by the adaptation of Russia’s national economy to systemic transformations in foreign trade, underwent significant changes. These changes primarily affected the geographical orientation of trade flows in foreign economic activity. As a result, there was a noticeable pivot in Russia’s exports and imports toward Asia and the Global South, particularly India and China.
By the end of 2023, exports to Europe had dropped significantly, declining from 265.63 billion USD in 2022 to 84.93 billion USD in 2023, i.e., only 31.97% of the previous year’s level. Imports from the EU also decreased, reaching 78.47 billion USD, which is 87.66% of the 2022 volume. Similar trends were observed in trade with the US (Figure 4).
On the contrary, trade with Asian countries strengthened. Exports increased from 290.43 billion USD in 2022 to 306.62 billion USD in 2023, while imports surged from 145.16 to 187.53 billion USD (+ 129.19% compared to the previous year). Exports to Africa also rose, from 14.80 to 21.15 billion USD, while imports saw a modest increase, from 3.09 to 3.35 billion USD.
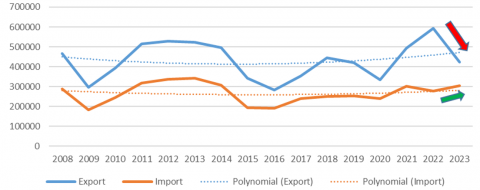
By the end of 2023, the volume of gross Russian exports had significantly declined (Figure 5). Despite the shift in exports and imports from the West to the East (for instance, China’s share in Russia’s total imports now exceeds 40% and continues to grow, indicating weak supply diversification), there is no full substitution for lost imports. Imports have increased in monetary terms. However, it is premature to conclude that the range of imported goods by product category has been fully restored. This is particularly relevant for sectors of the Russian economy that had established supply chains before the severe sanctions imposed by Western countries. A rapid reorientation of import supply chains to the Global South and Asia remains unlikely. This is largely due to the increased pressure of secondary sanctions, imposed on supplier countries exporting certain goods to Russia.
Figure 5. Russian foreign trade in goods, million USD (according to the balance of payments)
4.2 Tatarstan’s regional vulnerability and import dependency
Using our methodological toolkit, we analyzed the key product groups imported into Tatarstan. Given that several macro-indicators for exports and imports during 2022-2024 have not been published in statistical databases, the evaluation was based on the 2021 data. This timeframe provides valuable insights into external economic structural connections at the regional-sectoral level before the escalation of sanctions. It offers a clearer understanding of the vulnerability of regional economic activities to disruptions in foreign economic relations. This enables a more comprehensive assessment of potential risks within the emerging institutional environment.
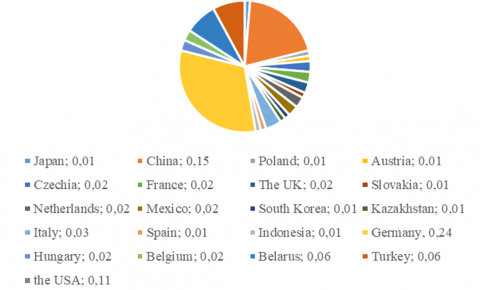
According to the 2021 data, more than half of all imports to Tatarstan originated from a limited number of key suppliers. Following our methodology of filtering product categories based on a threshold (at least 0.5% of total imports), the distribution of key importing countries is presented in Figure 6. During the analyzed period (2021), Tatarstan demonstrated the highest dependency on imports from Germany (24% of total imports), China (15%), and the US (11%).
The final system of indicators for conducting cluster analysis is presented in Table 2. The three largest import partners (Germany, China, and the USA) are highlighted in bold, as they together account for over 50% of the region’s total import.
Table 2. Volume of goods imported to Tatarstan by main commodity groups, USD
|
FEACN |
Country Category* |
Import Volume, USD |
Imports by Product Range Supplied from Abroad to the Region |
|||||||||
|
27 - Mineral Fuels, Mineral Oils, and Products of Their Distillation; Bituminous Substances |
38 - Miscellaneous Chemical Products |
39 - Plastics and Plastic Products |
40 - Rubber and Articles Thereof |
73 - Articles of Iron or Steel |
82 - Tools, Implements, Cutlery… |
85 - Electrical Machinery and Equipment… |
87 - Vehicles Other Than… |
90 - Optical, Photographic Instruments… |
94 - Furniture; Bedding, Mattresses… |
|||
|
Austria |
0 |
41.73 |
0.00 |
0.02 |
6.00 |
0.48 |
1.27 |
0.11 |
16.70 |
14.05 |
2.79 |
0.14 |
|
Belarus |
1 |
182.24 |
13.24 |
0.55 |
11.36 |
1.39 |
17.17 |
0.04 |
28.92 |
84.40 |
1.90 |
2.70 |
|
Belgium |
0 |
62.96 |
0.00 |
2.17 |
42.26 |
0.21 |
0.70 |
0.02 |
0.17 |
12.90 |
0.09 |
0.03 |
|
Hungary |
0 |
74.17 |
0.00 |
0.02 |
7.47 |
0.98 |
0.30 |
0.00 |
28.52 |
14.44 |
0.55 |
0.00 |
|
Germany |
0 |
791.05 |
7.62 |
10.48 |
47.40 |
7.21 |
35.50 |
3.75 |
97.52 |
486.40 |
29.58 |
18.37 |
|
Indonesia |
1 |
41.83 |
0.00 |
0.06 |
41.56 |
0.00 |
0.09 |
0.00 |
0.01 |
0.00 |
0.09 |
0.01 |
|
Spain |
0 |
32.87 |
0.00 |
0.29 |
5.90 |
0.69 |
1.58 |
0.17 |
4.97 |
17.07 |
0.27 |
0.01 |
|
Italy |
0 |
82.89 |
1.22 |
9.88 |
23.71 |
2.07 |
9.88 |
0.84 |
7.20 |
16.06 |
4.81 |
1.64 |
|
Kazakhstan |
1 |
32.93 |
2.07 |
0.03 |
2.80 |
0.12 |
2.67 |
0.01 |
3.17 |
0.03 |
0.16 |
0.01 |
|
China |
1 |
487.77 |
0.00 |
2.03 |
71.24 |
11.52 |
45.32 |
26.19 |
116.45 |
60.23 |
15.88 |
14.57 |
|
South Korea |
0 |
44.80 |
0.14 |
0.02 |
26.11 |
0.02 |
2.55 |
0.26 |
2.40 |
5.24 |
1.52 |
0.00 |
|
Mexico |
1 |
74.20 |
0.00 |
0.00 |
1.78 |
2.14 |
0.68 |
0.00 |
38.29 |
30.32 |
0.69 |
0.00 |
|
Netherlands |
0 |
50.21 |
0.27 |
2.09 |
9.09 |
0.99 |
2.76 |
0.03 |
1.68 |
3.06 |
3.67 |
1.49 |
|
Poland |
0 |
49.04 |
12.54 |
1.88 |
5.21 |
1.83 |
0.92 |
0.20 |
4.94 |
17.56 |
0.25 |
3.10 |
|
Slovakia |
0 |
43.44 |
0.00 |
0.03 |
0.61 |
1.15 |
0.23 |
0.07 |
3.10 |
6.84 |
0.34 |
0.05 |
|
UK |
0 |
55.37 |
0.16 |
0.83 |
0.87 |
0.62 |
1.69 |
0.06 |
2.46 |
33.79 |
1.36 |
0.09 |
|
USA |
0 |
371.00 |
1.13 |
56.19 |
8.33 |
4.37 |
9.92 |
0.84 |
12.17 |
216.01 |
6.45 |
37.74 |
|
Turkey |
1 |
197.29 |
0.83 |
1.01 |
14.48 |
3.20 |
12.69 |
8.55 |
6.98 |
127.63 |
0.20 |
14.62 |
|
France |
0 |
74.07 |
0.06 |
0.46 |
18.57 |
1.55 |
2.36 |
0.18 |
14.10 |
12.84 |
9.68 |
0.89 |
|
Czechia |
0 |
74.89 |
0.00 |
0.28 |
7.10 |
3.98 |
2.28 |
0.69 |
12.09 |
17.88 |
3.37 |
4.94 |
|
Japan |
0 |
46.15 |
0.00 |
2.67 |
11.31 |
1.19 |
3.74 |
0.35 |
6.53 |
9.88 |
9.24 |
0.01 |
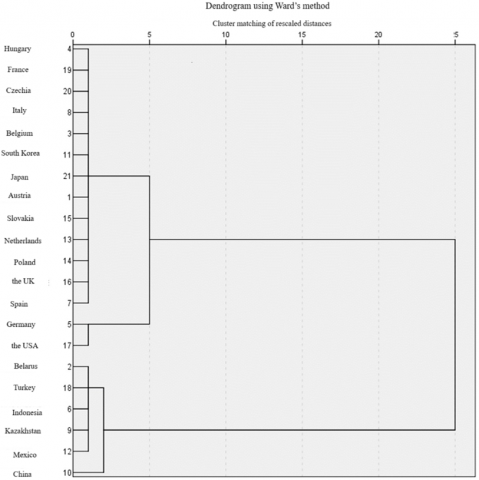
The selected data (Table 2) were used for cluster analysis using Ward’s method. The dendrogram is presented in Figure 7.
Figure 7. Cluster analysis
The first cluster includes countries with an import share ranging from 1.13 to 2.85%, indicating a moderate level of dependence of the region’s economy on supplies from unfriendly countries. The second cluster comprises nations that have imposed sanctions on Russia, accounting for the largest shares of imports: 21.5% from Germany and 12.75% from the US. The third cluster groups friendly countries.
Based on the assessment of data from the Federal Customs Service of the Russian Federation, the most critical product categories imported into Tatarstan are outlined in Table 3.
–Vehicles other than railway or tramway rolling-stock, and parts and accessories thereof (33.78%);
–Electrical machinery and equipment and parts thereof; sound recorders and reproducers, television image and sound recorders and reproducers, and parts and accessories of such articles (12.11%);
–Plastics and plastic products (11.23%).
Table 3. Structure of import dependence of Tatarstan’s economy by main product groups imported into Tatarstan (according to data for 2021)
|
FEACN |
Share of Total Imports to the Region |
|
87 – Vehicles other than railway or tramway rolling-stock, and parts and accessories thereof |
33.78% |
|
85 – Electrical machinery and equipment and parts thereof; sound recorders and reproducers, television image and sound recorders and reproducers, and parts and accessories of such articles |
12.11% |
|
39 – Plastics and plastic products |
11.23% |
|
73 – Articles of iron or steel |
4.54% |
|
90 – Optical, photographic, cinematographic, measuring, checking, precision, medical or surgical instruments and apparatus; parts and accessories thereof |
3.02% |
|
94 – Furniture; bedding, mattresses, mattress supports, cushions and similar stuffed furnishings; lamps and lighting fittings, not elsewhere specified; illuminated signs, illuminated name-plates and the like; prefabricated buildings |
2.73% |
|
38 – Miscellaneous chemical products |
2.68% |
|
40 – Rubber and articles thereof |
2.25% |
|
27 – Mineral fuels, mineral oils and products of their distillation; bituminous substances; mineral waxes |
1.52% |
|
82 – Tools, implements, cutlery, spoons and forks, of base metal; parts thereof of base metal |
1.20% |
Table 4 summarizes the correlation coefficients among import-dependent sectoral activities along with GRP allowing identification of the industries exhibiting the strongest statistical relationship to regional economic growth.
Table 4. Assessing the correlation dependence of industry import flows and GRP of Tatarstan
|
GRP of Tatarstan |
|
|
Manufacture of cutlery and tableware, tools and general hardware |
0.3 |
|
Manufacture of cast iron, steel and ferroalloys |
-0.5 |
|
Manufacture of petroleum products |
0.33 |
|
Manufacture of rubber products |
0.49 |
|
Manufacture of electrical equipment |
0.4 |
|
Manufacture of other chemical products |
0.82 |
|
Manufacture of plastics products |
0.74 |
|
Manufacture of motor vehicles, trailers and semi-trailers |
0.77 |
|
Manufacture of computer, electronic and optical products |
0.84 |
|
Manufacture of furniture |
0.79 |
Regression equations were constructed for the selected sectors of the regional economy. The results are presented in Table 5.
Table 5. Results of constructing regression equations
|
Types of Economic Activity (FEA) |
Regression Equations |
Coefficient of Determination |
|
Manufacture of other chemical products |
GRP = 0.004x + 0.62 |
0.79 |
|
Manufacture of plastics products |
GRP = 0.003x + 0.71 |
0.69 |
|
Manufacture of motor vehicles, trailers and semi-trailers |
GRP = 0.002x + 0.83 |
0.72 |
|
Manufacture of computer, electronic and optical products |
GRP = 0.004x + 0.69 |
0.81 |
|
Manufacture of furniture |
GRP = 0.001x + 0.94 |
0.72 |
The significance parameters of the regression equation are given in Table 6.
Table 6. Parameters of significance of the regression equation
|
Coefficients |
Standard Error |
T-Statistic |
|
|
Y intersection |
74.7 |
21.4685783 |
3.48 |
|
Manufacture of other chemical products |
0.14 |
0.0011 |
2.25 |
|
Manufacture of plastics products |
0.2 |
0.002 |
2.85 |
|
Manufacture of motor vehicles, trailers and semi-trailers |
0.19 |
0.0001 |
3.43 |
|
Manufacture of computer, electronic and optical products |
0.12 |
0.001 |
2.69 |
|
Manufacture of furniture |
0.10 |
0.0064 |
2.60 |
|
$\mathrm{R}^2$ |
0.92 |
||
|
$\mathrm{F}_{\text {crit}}$ |
0.0004 |
||
Residual diagnostics confirmed the adequacy of the regression models, and robustness checks supported the reliability of the estimated relationships. According to the estimates obtained, a slowdown in the growth rates of the considered types of economic activities (Table 5) by 1% creates the potential for a 0.76% reduction in Tatarstan’s GRP.
Amid systemic transformations in Russia’s economy, characterized by significant changes in the organization of foreign economic activity driven by sanctions-related confrontations, identifying the most vulnerable sectors has become a key priority for economic development. Given the significant polarization and differentiation of structural parameters shaping regional economic systems, it is essential to assess the import dependency of economic activities at the meso level. This makes it particularly relevant to analyze regional-industry-specific responses to external pressures, primarily the limitation of imports of a wide range of final and intermediate goods from Western countries.
The conclusions showed three groups of countries importing into Tatarstan, categorized based on the volume of products supplied:
Cluster 1 includes Hungary, France, the Czech Republic, Italy, Belgium, South Korea, Japan, Austria, Slovakia, the Netherlands, Poland, the UK, and Spain. These nations, often described as unfriendly in modern terminology, account for 20% of the total volume of imported goods.
Cluster 2 consists of Germany and the US, also classified as unfriendly to Russia’s national economy. These countries are responsible for approximately 32% of the region’s imported products, holding the largest share of imports to Tatarstan.
Finally, Cluster 3 includes countries with friendly policies toward Russia. This group comprises Belarus, Turkey, Indonesia, Kazakhstan, Mexico, and China. In 2021, they accounted for about 28% of the region’s total imports.
The analysis demonstrates a significant dependence of Tatarstan on the supply of goods for final and intermediate consumption from countries imposing sanctions against Russia’s economy. How critical is this import structure for the region’s economy under sanctions? Answering this question requires analyzing the composition of imported goods to assess the impact of supply restrictions on the stability of various economic sectors in the region.
The disruption of inter-cooperation ties with foreign partners has led to changes in the structure and volume of foreign trade. These changes are evident in the exports and imports between Russia and the EU before and after the escalation of sanctions. The aggregated macroeconomic effects of these changes highlight the risks to the region’s economic development, particularly in sectors most dependent on imported goods. Given the earlier estimates indicating a high share of imports from unfriendly countries, the vulnerability of Tatarstan’s economy can be assessed as significant.
These findings align with the prior regression analysis, and it demonstrated that if the most import-reliant sectors decelerated 1%, chemicals, plastics, motor vehicles, electronics, and furniture included, GRP could diminish 0.76%. This quantitative estimate underscores the translation of structural weaknesses within a limited set of industries. The consequence may involve large macroeconomic impacts upon the region. That analysis highlights the demand for diversification strategies as well as targeted state support within exactly those industries quite exposed to foreign supply disruptions via linking sectoral vulnerabilities to aggregate outcomes.
At the same time, it is important to note that one of the significant outcomes of the present study is the application of economic-mathematical modeling methods to parameters that characterize the degree of a region’s integration into international supply chains. This approach, in contrast to the descriptive methods of analysis predominantly used in the aforementioned studies, contributes not only to increasing the objectivity of the obtained results but also establishes an additional foundation for implementing priorities within the state policy system aimed at supporting import-dependent sectors that have the greatest impact on shaping the region’s economic growth.
The proposed approach to the study and resolution of the problem has several methodological limitations. These arise from various aspects, including the fact that this approach is based solely on the data obtained for Russia, the specific toolkit and methodological framework employed, and the approach that excludes commodity nomenclature items with a share of less than 0.5% of the total imports supplied to the region. Another limitation concerns the time horizon of the dataset: due to the absence of complete and reliable statistics for 2022–2024, the analysis was restricted to the period 2010–2021. As a result, the conclusions primarily reflect the structural dependencies of the pre-escalation period, which may differ from the dynamics observed under the current sanctions regime.
Nevertheless, this approach significantly contributes to achieving the primary objective of the study, i.e., determining the prospects for the sustainable development of the regional economy under conditions of transforming import-dependent sectors through the localization of supplies of final and intermediate goods from abroad. The assessment results facilitate the identification of directions and mechanisms for implementing anti-crisis state policies in the sphere of regional development and support for industrial sectors.
The study confirmed that the main share of Tatarstan's imports comes from Germany, China and the United States. Regression analysis further depicted that should the most import-dependent sectors, chemicals, plastics, motor vehicles, electronics, and furniture, decelerate 1%, GRP could diminish 0.76%, correlation coefficients ranging from 0.72 to 0.84. For a complete depiction of sanctions' impacts using post-2022 data, alongside exploring alternate strategies via regional policy simulations regarding import substitution and diversification, further investigation must broaden this analysis. Also, in subsequent research, it is need to examine the mechanisms for implementing anti-crisis state policies used by countries subject to economic sanctions. The indicated methodological framework connects sectoral import reliance with regional growth evolutions. Accordingly, it may be extrapolated toward other regions exhibiting elevated external exposure, augmenting its practical merit regarding comparative studies with policymaking throughout diverse national contexts.
This study was funded by a subsidy allocated to Kazan Federal University for the implementation of a state assignment in the field of scientific activity under project No. FZSM-2023-0017, titled “The economics of import substitution in the region under the conditions of supply chain transformation and deglobalization”.
[1] VEGAS LEX. (2023). International sanctions against Russian legal entities and individuals in connection with the Ukrainian crisis. https://www.vegaslex.ru/upload/medialibrary/9da/VEGAS_LEX_Alert_Sanctions_Feb_2022_RUS_ver3.pdf?ysclid=la9jg8sv7w731664266, accessed on Feb. 20, 2024.
[2] Strelnikova, M. (2024). It has been calculated how many sanctions have been imposed against Russia since 2022. https://www.gazeta.ru/business/news/2024/02/22/22394425.shtml?ysclid=lw7vxu9b3e932538635, accessed on Feb. 22, 2024.
[3] Funakoshi, M., Lawson, H., Deka, K. (2022). Tracking sanctions against Russia. Reuters. https://www.reuters.com/graphics/UKRAINE-CRISIS/SANCTIONS/byvrjenzmve/, accessed on Feb. 25, 2024.
[4] Safiullin, M.R., Elshin, L.A. (2023). Sanctions pressure on the Russian economy: Ways to overcome the costs and benefits of confrontation within the framework of import substitution. Finance: Theory and Practice, 27(1): 150-161. https://doi.org/10.26794/2587-5671-2023-27-1-150-161
[5] Safiullin, M.R., Gafarov, M.R., Elshin, L.A. (2022). Import substitution as a tool for ensuring sustainable economic development amidst systemic transformations: Regional and sectoral aspect. Journal of International Economic Affairs, 12(3): 407-432. https://doi.org/10.18334/eo.12.3.115210
[6] Sukharev, O.S. (2023). Import substitution policy: Breaking the limits. Upravlenets, 14(1): 33-46. https://doi.org/10.29141/2218-5003-2023-14-1-3
[7] Chernova, V.Y. (2017). Import substitution and reproduction potential of modernization: Problems and prospects. Upravlenets-the Manager, 2(66): 12-20.
[8] Yaroshevich, N.Y., Migunov, V.V. (2023). Sustainable development vs Effective competition: Empirical analysis of industry-specific mechanical engineering markets. Upravlenets, 14(1): 47-59. https://doi.org/10.29141/2218-5003-2023-14-1-4
[9] Elshin, L.A., Gafarov, M.R., Savushkin, M.V. (2022). Strategic guidelines for import substitution in Russia in the context of systemic transformations. Theoretical and Applied Economics, 3: 60-71. https://doi.org/10.25136/2409-8647.2022.3.38523
[10] Grimme, C., Lehmann, R., Noeller, M. (2021). Forecasting imports with information from abroad. Economic Modeling, 98: 109-117. https://doi.org/10.1016/j.econmod.2021.02.013
[11] He, L.Y., Huang, G. (2022). Are China's trade interests overestimated? Evidence from firms’ importing behavior and pollution emissions. China Economic Review, 71: 101738. https://doi.org/10.1016/j.chieco.2021.101738
[12] Irwin, D.A. (2021). The rise and fall of import substitution. World Development, 139: 105306. https://doi.org/10.1016/j.worlddev.2020.105306
[13] Alessandria, G., Choi, H., Ruhl, K.J. (2021). Trade adjustment dynamics and the welfare gains from trade. Journal of International Economics, 131: 103458. https://doi.org/10.1016/j.jinteco.2021.103458
[14] Leibovici, F., Waugh, M.E. (2019). International trade and intertemporal substitution. Journal of International Economics, 117: 158-174. https://doi.org/10.1016/j.jinteco.2018.11.007
[15] Soderbery, A. (2015). Estimating import supply and demand elasticities: Analysis and implications. Journal of International Economics, 96(1): 1-17. https://doi.org/10.1016/j.jinteco.2015.01.003
[16] Bershka, M., Lee, R. (2022). How does import market power matter for trade agreements? Journal of International Economics, 137: 103580. https://doi.org/10.1016/j.jinteco.2022.103580
[17] Uvarova, M.N., Polshakova, N.V., Grishina, S.Y. (2022). Import substitution in the sugar sub-complex as a food security priority. Eurasian Legal Journal, 10(173): 515-516.
[18] Adewale, A.R. (2017). Import substitution industrialization and economic growth - Evidence from the group of BRICS countries. Future Business Journal, 3(2): 138-158. https://doi.org/10.1016/j.fbj.2017.06.001
[19] Broocks, A., Biesebroeck, J.V. (2017). The impact of export promotion on export market entry. Journal of International Economics, 107: 19-33. https://doi.org/10.1016/j.jinteco.2017.03.009
[20] Zolotukhina, A.O. (2017). Federal and regional aspects of economic transformation: Export-oriented import substitution (in Russ.). In Economics and Entrepreneurship in the Global World: Collection of Scientific Articles, pp. 95-103.
[21] Kazikhanov, A.M. (2018). Import substitution as a conditionfor improving food security. Voprosy Strukturizatsii Ekonomiki, 1: 69-72. https://doi.org/10.24411/1813-3528-2018-00013
[22] Babina, T., Hilgenstock, B., Itskhoki, O., Mironov, M., Ribakova, E. (2023). Assessing the impact of international sanctions on Russian oil exports. SSRN Electronic Journal. https://doi.org/10.2139/ssrn.4366337
[23] Fang, J., Collins, A., Yao, S. (2021). On the global COVID-19 pandemic and China’s FDI. Journal of Asian Economics, 74: 101300. https://doi.org/10.1016/j.asieco.2021.101300
[24] Cardero, M.E., Galindo, L.M. (2005). From the import substitution model to the import-export model: Reassessing Mexico’s trade liberalization process during the last two decades. The Journal of Economic Asymmetries, 2(2): 71-97. https://doi.org/10.1016/j.jeca.2005.02.004
[25] Hoang, D., Breugelmans, E. (2023). “Sorry, the product you ordered is out of stock”: Effects of substitution policy in online grocery retailing. Journal of Retailing, 99(1): 26-45. https://doi.org/10.1016/j.jretai.2022.06.006
[26] Karuppiah, K., Sankaranarayanan, B. (2023). An integrated multi-criteria decision-making approach for evaluating e-waste mitigation strategies. Applied Soft Computing, 144: 110420. https://doi.org/10.1016/j.asoc.2023.110420
[27] Koren, M., Perlman, Y., Shnaiderman, M. (2022). Inventory management model for stockout based substitutable products. IFAC-PapersOnLine, 55(10): 613-618. https://doi.org/10.1016/j.ifacol.2022.09.467
[28] Bali, M., Rapelanoro, N. (2021). How to simulate international economic sanctions: A multipurpose index modelling illustrated with EU sanctions against Russia. International Economics, 168: 25-39. https://doi.org/10.1016/j.inteco.2021.06.004
[29] Government of the Russian Federation. (2022). On approval of the list of foreign states and territories committing unfriendly acts against the Russian Federation, Russian legal entities and individuals. https://www.mid.ru/ru/foreign_policy/official_documents/1861789/.
[30] Narbut, V.V., Shpakovskaya, E.P. (2023). Russia's foreign trade trends under sanctions. Vestnik Instituta ekonomiki Rossiiskoi Akademii Nauk, 2: 131-148. https://doi.org/10.52180/2073-6487_2023_2_131_148
[31] Federal Customs Service of the Russian Federation. Foreign trade results with all countries. https://customs.gov.ru/statistic/vneshn-torg/vneshn-torg-countries, accessed on Sep. 5, 2025.