Guanyu Xiong![]()
© 2025 The author. This article is published by IIETA and is licensed under the CC BY 4.0 license (http://creativecommons.org/licenses/by/4.0/).
OPEN ACCESS
Chongqing’s improved land ticket system aims to balance urban expansion and arable land protection but faces oversupply due to the decline in the real estate market. Based on comprehensive data, this study identifies key factors—local economy, rural residential areas, farmers’ reclamation willingness, and population size—that drive land ticket supply potential (927.74 km²). Farmers’ willingness correlates with household structure, housing conditions, and aging populations. To address oversupply, the study proposes expanding land ticket applications, diversifying functions, implementing hierarchical management, promoting nationalization, and regulating liquidity. These strategies offer a practical framework for optimizing land ticket systems, advancing urban-rural integration, and sustainable land management.
land tickets, supply potential, urban-rural integration, regional disparities, policy optimization
Urban and rural areas, as integral components of the urban-rural territorial system, inherently contradictory yet remain inseparable entities that require integrated for sustainable development. Urban-rural integration has long been a crucial goal for a coordinated development in China, aiming to achieve mutual prosperity between urban and rural regions [1]. The land ticket system, as a significant mechanism for urban-rural integration, addresses the dual pressures of urban expansion and arable land protection [2]. Land tickets represent transferable development rights of rural collectively-owned construction land, including homesteads, rural enterprise land, and public welfare land. The government's natural resources departments convert these rights into urban construction land indicators through reclamation and strict validation [3]. This innovative mechanism not only facilitates the transfer of land development rights but also effectively transforms for transforming inefficient rural land into urban development space [4, 5].
The Land Ticket System shares the core principle of protecting public resources through land development rights restrictions with international conservation easement practices as exemplified by the United States, France, and Australia, where conservation easements implement legally binding covenants that limit development rights while providing economic compensation without altering land ownership—these three systems uniformly commence from a public-interest rationale, employ compensation as contractual consideration, permanently anchor land to designated uses, and establish comprehensive institutional frameworks through integrated policy mechanisms forming operational closed loops [6-8]. Distinctively, whereas traditional conservation easements rely on government fiscal funding to compensate landowners, the Land Ticket System innovatively transfers compensation responsibility to construction land users through market entities purchasing development quotas, with funds directly channeled to rural stakeholders bearing farmland preservation obligations, thereby resolving public fiscal dependency while enhancing equity via a "polluter-pays" compensation mechanism and promoting urban-rural resource reallocation through system-wide quota trading, ultimately pioneering a market-empowered governance innovation for sustainable land management.
Studies demonstrate that the land ticket system promotes the flow of land factors between urban and rural areas, driving rural development through market-based allocation and property rights separation [4, 9-11]. For urban development, land tickets enable cities to transform low-value rural construction land into high-value urban land, simultaneously optimizing land allocation and preserving arable land [9]. The system provides rural areas with significantly financial resources for infrastructure development and industrial upgrading by facilitating large-scale, long-distance transfers of land indicators [3, 12-14]. However, the system creates potential drawbacks, including environmental degradation and regional inequality, requiring carefully managed [15-18].
The land ticket system's supply-demand design closely links the land ticket market to the real estate market. Urban expansion drives the primary demand for land tickets as cities require more construction land during the urban expansion phases [15]. As a municipality directly governed by China's central government, Chongqing, a municipality in southwest China with ~32 million population and ~82,400 km2 territory that directly governed by the Central Chinese Government, has effectively regulated and guided the land ticket market to achieve a basic balance between land supply and utilization demand [19]. However, the recent intensive urbanization phase has depressed the real estate market [20], significantly impacting the demand for land tickets. The decline in such a demand has far exceeded the decline in supply, resulting in a substantial oversupply of the land ticket by the end of 2023, with the demand-to-supply ratio falling to 1:3 [21]. Additionally, the minimum protection price policy [15, 21] has further constrained market's self-regulation ability, exacerbating the oversupply issue. These developments prolong farmers' reclamation benefit cycles [2], diminish rural economic impacts, and raise questions about the market's future viability [10, 22]. Despite these challenges, international experiences, such as the land development rights trading in Poland, demonstrate that land development rights markets can still achieve significantly economic value even in the face of market downturns [23]. Our study therefore develops a potential model to analyze Chongqing's land ticket supply characteristics, enabling better realization of market value.
Land resource managers widely use supply potential estimation as a crucial tool, which helps indirectly evaluate various land resources by calculating the strong correlations with the target potential [24]. Researchers have increasingly applied potential models in recent years to assess regional energy potential [25, 26]. Chinese studies typically estimate land consolidation potential using multiple factors, including rural population density, transportation conditions, land performance, and building area, with weights assigned through methods like the Delphi technique [27, 28]. Common estimation approaches include per capita construction land indicators, household construction land metrics, internal vacancy rates of rural settlements, and urban system planning methods [29]. Advanced techniques such as GIS spatial analysis, multi-factor comprehensive evaluation, and hot-and-cold spot analysis enable researchers to determine spatial variations in land potential across regions, facilitating more accurate estimates for development zones and homestead land [27, 30]. Feng et al. [31] pioneered land tickets in Chongqing from 2011 to 2020 by considering total population, per capita land use standards, the scale of township enterprise output value, and the additional land use per unit of output value. Their findings confirmed sufficient theoretical supply potential that matched actual pre-2018 market conditions [19]. However, these studies emphasized geographical factors while overlooking subjective influences from farmers and government stakeholders. Furthermore, per capita and household-based methods frequently overestimate potential, potentially creating significant estimation errors [29]. This study advances the field by incorporating governmental and farmer perspectives into the assessment framework, adapting the per capita standard method to better reflect market dynamics and human behavior. We systematically analyze regional potential variations and government-farmer interactions, establishing a robust foundation for understanding farmer behavior and informing land ticket market policies.
Focusing on Chongqing's urban-rural integration phase (2025-2035), three key dimensions are investigated: the scale and determinants of land ticket supply potential, the correlation between regional economic development and supply potential, and how economic disparities affect rural land stocks, farmer willingness, and government behavior. The methodology combines questionnaire surveys across four village types (characteristic protection, aggregation enhancement, urban-rural integration, and relocation consolidation) in key land ticket outflow areas with innovative modeling techniques. This approach uniquely integrates subjective factors into potential estimation, delivering comprehensive insights for policy optimization and sustainable land management during urban-rural integration.
2.1 Study area overview
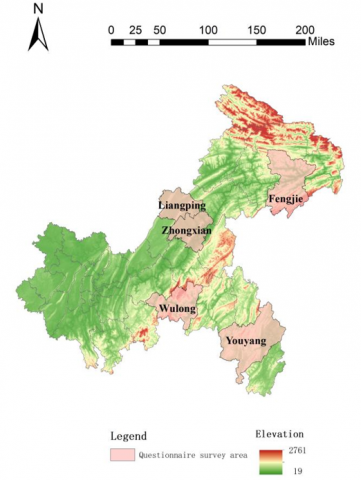
Chongqing (Latitude: 28°10’ N -32°13’ N, Longitude: 105°17’ E -110°11’ E), as a municipality plays a pivotal role in China's urban-rural integration. The central government directly governs this strategically important region. Administratively, Chongqing comprises three key regions: The Main Urban Area (Latitude: 29°31’ N to 29°34’ N, Longitude: 106°28’ E to 106°35’ E), the northeastern Three Gorges Reservoir Area (Latitude: 29°35’ N to 31°49’ N, Longitude: 107°56’ E to 110°17’ E), and the southeastern Wuling Mountain Area (Latitude: 28°46’ N to 30°10’ N, Longitude: 107°30’ E to 109°10’ E). The Main Urban Area serves as the primary recipient of land tickets, while the northeastern and southeastern regions are the main sources of land tickets [4, 16, 19]. Our study concentrates on 17 districts and counties within the northeastern and southeastern regions, which account for the primary outflow of land tickets (Figure 1).
2.2 Data sources
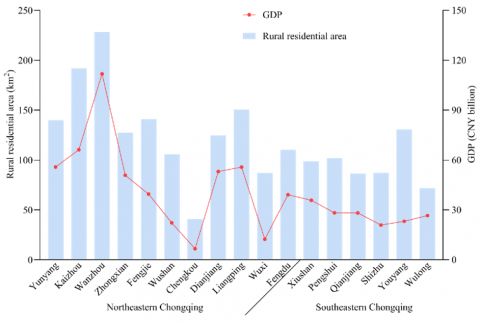
This study integrates multiple authoritative datasets to ensure comprehensive and accurate analysis. We obtained rural residential area data and historical land ticket supply records from the Chongqing Rural Land Exchange. For population projections we analyzed 2035 urbanization rate and rural population plans for each district and county [32]. Our research team conducted field surveys in five representative districts (Fengjie, Liangping, Wulong, Youyang, and Zhongxian) to assess local government capacity, reclamation enthusiasm, and farmer willingness. Expert panels then extrapolated these findings to evaluate conditions in other districts. We supplemented this with 2022 GDP statistics from the Chongqing Municipal Bureau of Statistics (Figure 2) [33]. We implemented several preprocessing steps to ensure data quality and consistency. First, we imputed missing values using the mean or median of each variable. Next, we identified and addressed outliers through robust statistical methods. Finally, we validated by cross-referencing secondary sources and conducting statistical tests to ensure reliability and accuracy.
2.3 Farmers' reclamation willingness survey
2.3.1 Survey design
To comprehensively understand how different village types affect farmers' willingness to reclaim land, this study selected four typical types of villages in the main outflow areas of land ticket: characteristic protection villages, aggregation enhancement villages, urban-rural integration villages, Researchers based the selection of these villages on the timing of land ticket implementation and reclamation work, historical land ticket transaction volumes, and the enthusiasm of each district and county for reclamation efforts. We selected five districts and counties (Fengjie, Liangping, Wulong, Youyang, and Zhongxian) as key survey areas. Using a random number sequence method, we randomly picked 21 townships from the village lists provided by local authorities to carry out field surveys. We based the sampling on at least 5% of the registered households in each village, ultimately collecting 543 valid questionnaires (see Table 1).
Table 1. Number of valid questionnaires on farmers' reclamation willingness in the surveyed districts and counties
|
District/ County |
Characteristic Protection |
Aggregation Enhancement |
Urban-Rural Integration |
Relocation and Consolidation |
Total |
|
Fengjie |
32 |
22 |
26 |
24 |
104 |
|
Liangping |
30 |
38 |
30 |
23 |
121 |
|
Zhongxian |
40 |
24 |
16 |
17 |
97 |
|
Wulong |
12 |
25 |
48 |
27 |
112 |
|
Youyang |
33 |
32 |
26 |
18 |
109 |
|
Total |
147 |
141 |
146 |
109 |
543 |
2.3.2 Survey items and methods
To fully understand how the government organizes land ticket and farmers' willingness to reclaim land, and to provide a basis for expert to assess reclamation willingness in other districts and counties, we primarily adopt on-side questionnaires and district-level consultations. Given the difficulty in locating registered households (due to issues such as empty registration and proxy households) and the fact that most rural households have migrated to cities, we conducted random sampling during household visits, covering as many collective economic organizations, population groups, transportation conditions, and housing types as possible. The survey included questions on the ownership and area of homesteads and rural houses, their intended use, and farmer’s reclamation willingness. Additionally, we visited village collectives to gather information on the basic situation of the villages, the abandonment and idleness of other rural construction land, and their future development plans. We also held Consultations with the district planning and natural resources bureaus, relevant township governments, and sub-district offices to understand the reclamation work mechanism (including project organization, and personnel composition, etc.), the progress of past reclamation projects, the current implementation status of projects, major challenges (including solutions), future reclamation plans (with a focus on the next five years), factors affecting reclamation work, overall considerations for revitalizing other rural construction land, and suggestions for reclamation and land ticket trading work. Compared with conventional unidimensional household surveys, this study developed a tri-level data collection system integrating households (micro-level), village collectives (meso-level), and governmental departments (macro-level), establishing a three-dimensional spatial data network that significantly enhances informational completeness.
We conducted the survey over a six-months period, with trained enumerators administering the questionnaires. To ensure high response rates, we made multiple visits to households and provided incentives such as small gifts. We collected data through electronic devices, and then subjected the entered datasets to validity range screening and logical consistency checks—steps taken to minimize errors and ensure the authenticity and reliability of the data.
2.3.3 Survey items and methods
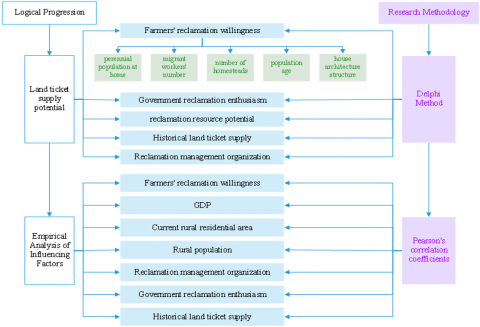
Land use is a fundamental right of farmers, and their willingness plays a pivotal role in shaping decisions on land transfer or withdrawal decisions. This study takes farmers' land supply willingness—a core determinant of land ticket supply potential—as its theoretical foundation. In sights for policy improvement. Building upon prior research, five key influencing factors, including land reclamation management institutions, to assess land ticket supply potential. We employ the Delphi method to determine indicator weights, then use a multi-criteria comprehensive evaluation approach to calculate the adjusted potential coefficient, thus deriving the actual supply potential. We design a quantitative analytical framework to empirically examine the critical determinants of land ticket supply, providing a data-driven basis for policy refinement and optimization. This research contributes a structured methodology to quantify the interplay between institutional, socio-economic, and administrative factors influencing land ticket supply dynamics, ultimately offering actionable insights for policy improvement (Figure 3).
Figure 3. Technical roadmap
2.4 Land ticket supply conversion potential coefficient model
2.4.1 Indicator selection
To estimate land potential, we typically start with the unused land area and exclude a series of areas unsuitable for potential use to determine the final available area [34]. In this study, we selected the reclamation resource potential as an indicator, which refers to the current area of rural residential points that have not yet been utilized as land tickets. Additionally, the reclamation process is influenced by both government regulations and farmers' reclamation demands [35]. Therefore, this study assessed the government's regulatory behavior through the reclamation management organization and its enthusiasm, and measured the impact of farmers' reclamation demands using their reclamation willingness. Lastly, considering that market potential estimates often incorporate historical data [36], the historical supply of land ticket was included as an indicator.
Reclamation Management Organization: This refers to the management of land ticket initiation, planning, construction, and final acceptance by district and county reclamation management departments. Effective reclamation management boost reclamation efficiency, carbs disorderly and repetitive construction, and makes it easier to verify whether the reclamation process complies with regulations—thus preventing fund misuse. While the costs of reclamation management count as part of the transaction costs in land ticket production, they are relatively small compared to the total value that land tickets generate.
Government's Enthusiasm for Reclamation: This primarily reflects the enthusiasm of district, county and township governments toward land ticket reclamation. When governments are highly enthusiastic, they will take the initiative to promote the benefits of reclamation to farmers, encourage their participation and potentially boost the supply of land ticket. The government's role is mainly to create a favorable environment for land ticket reclamation, so it cannot directly decide whether farmers will supply land tickets.
Reclamation Resource Potential: This mainly refers to the total amount of rural residential land available for reclamation. Rural residential land is the source of land ticket supply. As China's rural population continues to migrate to cities, the quantity of rural residential land available for reclamation is increasing, which is significantly linked to the growth in reclamation potential.
Historical Land Ticket Supply: The historical supply of land ticket in recent years can help predict future supply volumes. Given that land reclamation serves multiple purposes, when assessing the potential of land ticket reclamation, it is necessary to include historical land ticket supply as an indicator. Moreover, policy factors make land ticket supply more stable than demand, allowing people to measure it directly more easily and obtain relatively accurate data.
Farmers' Reclamation Willingness: This refers to the attitude of farmers towards land ticket reclamation. Farmers, as the suppliers in the land ticket market, hold the decision-making power over reclamation, so their attitudes significantly affect the volume of land available for reclamation. Due to traditional beliefs, farmers may choose to retain rural construction land which can directly make the land unavailable for reclamation. Therefore, farmers' attitudes also serve as a relatively important indicator.
2.4.2 Weight determination
To evaluate the significance of each indicator in the conversion potential coefficient model, this study consulted 21 experts from the fields of land reclamation, land management, land planning, and land economics. The Delphi Method was employed to determine the weights and rankings of the indicators [37]. The Delphi process was conducted in two rounds. In the first round, experts independently assessed the importance of each indicator and assigned preliminary weights. The results were aggregated and anonymized feedback was provided to all participants. In the second round, experts were given the opportunity to revise their ratings based on the summarized group responses from the first round. Consensus was considered to be reached when the interquartile range of assigned weights for each indicator was less than 0.1. As a result, the final weights assigned to reclamation management organization, government reclamation enthusiasm, reclamation resource potential, historical land ticket supply, and farmers’ reclamation willingness were 0.1, 0.1, 0.4, 0.2, and 0.2, respectively. The indicators of reclamation management organization, government reclamation enthusiasm, and historical land ticket supply were categorized into three levels: good, average, and poor, with corresponding values of 0.8, 0.5, and 0.3. The reclamation resource potential, given its high impact and significantly regional differences, was divided into four levels: high, relatively high, average, and low, with corresponding values of 0.9, 0.7, 0.5, and 0.3. The reclamation willingness of farmers was assessed based on the survey data from the five typical districts and counties, and the levels were assigned according to the similarity principle by experts to evaluate other districts and counties [38].
Expert Selection and Assessment Process: We selected experts based on their extensive experience and recognized expertise in land reclamation, management, planning, and economics. The selection criteria required candidates to have at least 10 years of professional experience, a proven track record of published research in relevant fileds, and active involvement in land-related policy formulation or implementation. For the consultation process, we conducted multiple rounds of Delphi surveys. In the first round, the experts independently assign weights to each indicator based on their judgment. In the subsequent rounds, we shared the group's average weights assignments with all participants and asked them to reconsider and adjust their initial assessments. We continued this iterative process until the panel reached consensus, ultimately determining the final weights by averaging the experts' assignments from the last round.
2.4.3 The land ticket reclamation conversion potential coefficient model
Based on the determined weights and levels of each indicator, the land ticket reclamation conversion potential coefficient (![]() ) for each district and county was calculated using Eq. (1):
) for each district and county was calculated using Eq. (1):
$X=\sum_{i=1}^5 W_i \cdot P_i$ (1)
where, $X$ stands for the potential coefficient of land ticket reclamation conversion. The indices $i$ range from 1 to 5 , corresponding to the weight $(W)$ of five factors: reclamation management organization, government reclamation enthusiasm, reclamation resource potential, historical land ticket supply, and farmers' willingness to reclaim. The value $P_i$ donates the level assigned to each indicator in a specific district or county.
Since suburban reclaimed land is often used local purposes and does not enter the land ticket market, this study only calculated the reclamation data for the 17 districts and counties in the southeastern and northeastern regions of Chongqing.
Model Limitations: While the model comprehensively assesses reclamation potential, it assumes that the weights assigned to each indicator remain static and do not change over time. This may introduce some bias, especially in regions where economic conditions and policy environments are evolving rapidly. Future research can explore dynamic weighting methods to address this limitation.
2.5 Land ticket supply potential estimation model
To predict the future supply of land tickets, this study uses an improved per capita standard method to estimate the supply potential of land tickets. Specified in the Land Development and Consolidation Planning Manual, the per capita standard method calculates the potential for rural residential land consolidation by comparing current land use with planned land use at the end of the planning period. It assumes that surplus land—left after reducing per capita or household land use to national or regional standards, can be converted into construction land indicators. However, not all such surplus land can be reclaimed as land tickets within a specific timeframe, even with various implementation measures, because we must consider the needs of rural production and living land.
The land ticket supply potential ($K$) was estimated using the following Eq. (2):
$K=(K 1-K 2 \times P) \times X$ (2)
where, $K$ represents the potential supply of land tickets, $K 1$ stands for the current area of rural residential land points, $K 2$ denotes the planned per capita construction land area, $P$ refers to the projected rural population by $2035, X$ indicates the potential coefficient for land ticket reclamation and conversion.
According to the Chongqing Urban and Rural Planning Village Planning Guide (Trial Edition), the planned per capita construction land area for districts and counties in the northeastern and southeastern Chongqing is 120 m². We therefore set K2 at 120 m². For the projected rural population in 2035, we drew on data from the Chongqing Municipal Development and Reform Commission, which includes the urbanization rate and rural population plans for each district and county [32].
Model Validation: To ensure the model's accuracy, we validated it using historical data from 2008 to 2022. We compared the model's predictions with actual land ticket supply data, and the results revealed a high degree of correlation, confirming the model's reliability.
3.1 Farmer's willingness to reclaim current residential houses
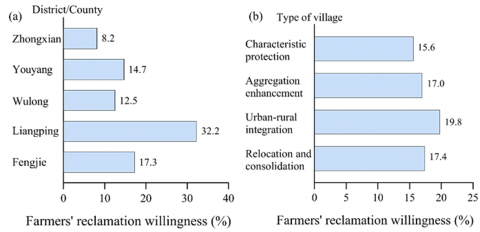
The willingness of farmers to reclaim their current residential houses varied significantly across districts and counties, but showed minimal variation among the four village types of Figure 4. Among the surveyed areas, Liangping farmers demonstrated the highest reclamation willingness at 32.2% to reclaim their current houses, followed by Fengjie (17.3%), Youyang (14.7%), Wulong (12.5%), and Zhongxian (8.2%). Liangping's notably higher rate may stem from its effective publicity campaigns and early start in reclamation work [35]. The proportion of farmers willingness to reclaim their current residential houses was relatively consistent, averaging around 17.5% (Figure 4(b)), suggesting that village type had limited impact on farmers' reclamation willingness.
Figure 4. Farmers' willingness to reclaim current residential houses in surveyed districts and counties (a) and villages (b)
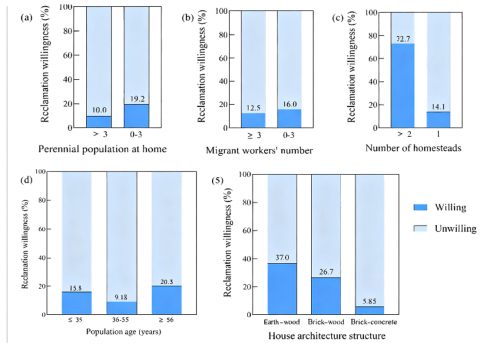
Further analyses showed that household and housing characteristics strongly influenced farmers' willingness to reclaim their current homes (Figure 4). Specifically, the number of resident family members correlated more strongly with reclamation willingness than the number of migrant workers in the household (Figure 5(a) and 5(b)). Households with fewer resident members and lower land dependence showed greater willingness to reclaim their homes. Farmers owning multiple homesteads were significantly more willingness to reclaim than those with just one (Figure 5(c)). Among the 172 households with multiple homesteads across the five districts and counties, 125 (72.7%) expressed reclamation willingness. In contrast, only 44 of the 313 single-homestead households (14.1%) intended to reclaim. Additionally, rural housing structure significantly influenced farmers' reclamation decisions (Figure 5(e)). Different house structures entail varying sunk costs [39, 40], which indirectly affect farmers' reclamation willingness. Farmers with earth-wood (37.0%) or brick-wood (26.7%) structures showed significantly higher reclamation rates than those with brick-concrete structures (5.8%). Age significantly influenced reclamation willingness, with farmers aged 20-35 and 56+ demonstrating higher willingness than middle-aged farmers (36-55 years) (Figure 5(d)). Younger farmers (20-35 years) showed greater reclamation willingness due to three key factors: (1) stronger confidence in future prospects despite uncertainty [41], (2) weaker hometown attachment, and (3) greater mobility. In contrast, middle-aged farmers (36-55 years) prioritized retaining rural properties as a pension safeguard [40]. Older farmers (56+ years) typically demonstrated the highest reclamation rates, as many relocated to urban areas to live with their children, leaving rural homes vacant.
Figure 5. Effects of the perennial population at home (a), migrant workers' number (b), number of homesteads (c), population age (d), and house architecture structure (e) on farmers' willingness to reclaim current residential houses in surveyed districts and counties
3.2 Land ticket supply potential in Chongqing
3.2.1 Conversion coefficient of reclamation potential
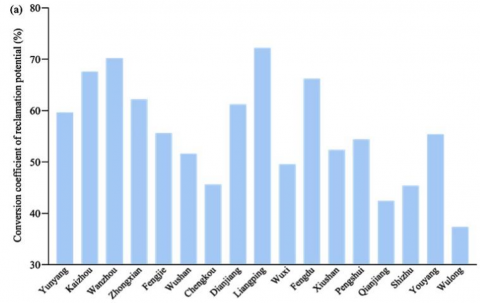
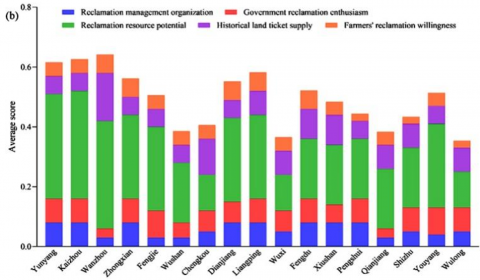
The 17 districts and counties in the northeastern and southeastern regions of Chongqing showed significant variation in reclamation conversion potential coefficients (Figure 6(a)). Liangping, Wanzhou, Kaizhou, Fengdu, Zhongxian, Dianjiang, and Yunyang all exceeded 60% conversion rates. Fengjie, Wushan, Wuxi, Xiushan, Pengshui, and Youyang ranged between 50-60%, while Chengkou, Shizhu, Qianjiang, and Wulong remained below 50%. The key factors drove the variationin conversion coefficients across districts and counties: reclamation resource potential and farmers' reclamation willingness (Figure 6(b)). While most areas demonstrated strong reclamation management organization and high government support, significant disparities in resource potential and farmer willingness created the observed coefficient differences. While most areas demonstrated strong reclamation management organization and high government support, significant disparities in resource potential and farmer willingness created the observed coefficient differences.
3.2.2 Land ticket supply potential of rural residential points
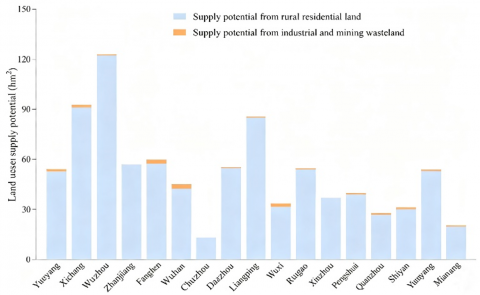
Based on the improved per capita standard method and the conversion potential coefficient model estimated Chongqing's total rural residential land ticket supply potential at 883.36 km² (Figure 5). Three districts-Wanzhou, Kaizhou, and Liangping-dominated the supply potential, each exceeding 85 km² and collectively representing 34.1% of northeast and southeast Chongqing's total potential. Six districts (Yunyang, Zhongxian, Fengjie, Dianjiang, Fengdu, and Youyang) showed moderate potentials of 54-60 km², contributing 37.9% to the regional total. The remaining eight districts and counties had relatively lower supply potentials, each below 45 km², accounting for only 28.0% of the total potential.
Wanzhou showed the highest land ticket supply potential (112.92 km2), despite scoring lower in reclamation management organization and government enthusiasm (Figure 4(b)). This resulted from its extensive rural residential areas and strong farmer reclamation willingness. Liangping, while having only moderately sized rural residential areas overall, achieved high supply potential through its larger individual residential plots and abundant idle construction land, despite its smaller rural population. Kaizhou's high potential stemmed from its substantial rural population burden and low urbanization rate [42], which drove strong government reclamation support and effective organizational management.
3.2.3 Land ticket supply potential of industrial and mining wasteland
Pursuant to the Chongqing Municipal Government's Work Plan for Geological Environment Remediation of Historical Legacy and Closed Mines (Yufu Ban Fa [2018] No. 55), Chongqing plans to fully restore abandoned open-pit mines within 50 km of the Yangtze River and its major tributaries by 2035. The city currently contains 49.01 km² of historical legacy mines, with approximately 44.11 km² (90%) eligible for land ticket designation [43]. Industrial and mining wasteland with land ticket potential is concentrated in Wushan and Fengjie counties (Figure 7), where rugged terrain and ecological sensitivity—combined with Three Gorges Reservoir resettlement pressures—create urgent remediation needs for these degraded lands.
Figure 7. Land ticket supply potential in 17 counties of Chongqing
3.2.4 Total land ticket supply potential and its characteristics in Chongqing
Integrating rural residential areas and industrial and mining wasteland, potential yields a total land ticket supply of 927.74 km² in Chongqing (Figure 5)—a threefold increase over the 2008–2022 cumulative totals (rural: 251.57 km²; mining: 245.73 km²) [44]. This substantial supply potential enables Chongqing's land ticket market to support extensive urban development needs. However, the ongoing real estate market slump has progressively reduced land ticket demand, creating severe market oversupply. Market projections indicate this supply-demand imbalance will persist throughout the next decade, requiring strategic measures to stimulate demand absorption.
3.3 Analysis of factors influencing land ticket supply potential in Chongqing
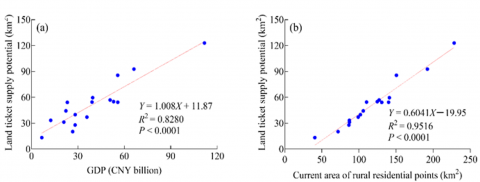
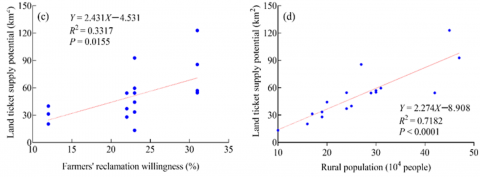
The analysis of the relationship between land ticket supply potential and various factors revealed several significant correlations. The supply potential of land tickets was positively correlated with the local economic development, the current area of rural residential points, farmers' willingness to reclaim their current residential houses, and the rural population size (Table 2). These factors collectively play a decisive role in determining the supply potential of land tickets. Specifically, the districts and counties with better economic conditions, larger areas of rural residential points, higher farmers' reclamation willingness, and larger rural populations tended to have higher land ticket supply potential (Figure 8(a)-8(d)).
In contrast, land ticket supply potential showed no significant correlation with reclamation management organizations, government enthusiasm for reclamation, or historical land ticket supply (Table 2). This lack of correlation likely stems from two factors: most districts and counties already have sound reclamation management and high government enthusiasm, and historical land ticket supply has generally been moderate (Figure 4(b)).
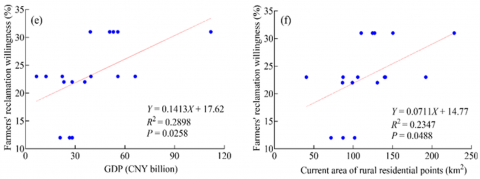
Farmers' reclamation willingness —a subjective factor —also positively correlated with local economic conditions and the current area of rural residential points. Districts and counties with stronger economic performance and larger rural residential areas see higher farmers' willingness to reclaim land (Figure 8(e)-8(f)). This suggests that economic conditions and the availability of land resources significantly influenced farmers' decisions regarding about land reclamation.
Table 2. Pearson's correlation coefficients between land ticket supply potential, reclamation willingness, and surveyed factors (N =17)
|
|
Farmers' Reclamation Willingness (%) |
GDP (CNY billion) |
Current Rural Residential Area (km2) |
Rural Population (104 people) |
Reclamation Management Organization |
Government Reclamation Enthusiasm |
Historical Land Ticket Supply (km2) |
|
Farmers' Reclamation Willingness (%) |
1.000 |
0.538** (0.078, 0.810) |
0.484** (0.005, 0.783) |
0.400 (-0.100, 0.739) |
0.191 (-0.319, 0.615) |
-0.201 (-0.621, 0.310) |
0.244 (-0.268, 0.649) |
|
Land Ticket Supply Potential (km2) |
0.576** (0.132, 0.828) |
0.910*** (0.763, 0.968) |
0.975*** (0.932, 0.991) |
0.847***(0.619, 0.944) |
0.089 (-0.409, 0.546) |
-0.147 (-0.586, 0.359) |
0.253 (-0.260, 0.654) |
4.1 Local economic development and land ticket supply potential
Our study reveals a significantly positive correlation between local economic development and land ticket supply potential in Chongqing. This correlation highlights that economic conditions play a pivotal role in shaping land ticket supply potential. Districts and counties with robust economies tend to have higher land ticket supply potential, probably because they can better support land reclamation activities and farmers are more willing to participate in these activities [15].
However, this positive correlation may also widen exacerbate regional disparities [16]. Economically prosperous areas may secure more land ticket resources, potentially marginalizing pushing less developed regions to the margins. Wang et al. [4] argued that when land tickets target low-potential-value land, they generate substantial differential gains, which in turn facilitated the implementation of land tickets systems. Whereas, our study reveals a contrasting pattern: counties with weaker economic show poorer land ticket implementation, and farmers here are less willing to reclaim their current housing due to inadequate understanding of land tickets. In contrast, counties with stronger economies have higher government enthusiasm for reclamation and greater farmer willingness to participate. This regional imbalance may concentrate land ticket resources excessively in economically prosperous areas, thereby undermining the overarching goal of urban-rural integration [30].
To illustrate these challenges and the effectiveness of the land ticket system works in practice, let’s take Liangping District as an example. Here, the land ticket system has been successfully implemented, unlocking a reclamation potential of 85 km² (Figure 5). The local government has actively promoted the benefits of land tickets, offering financial incentives and support to farmers. This has significantly boosted farmers’ willingness to participate in reclamation, driving more efficient allocation of land resources [38]. In contrast, consider Fengjie County, where implementing the land ticket system has hit snags due to limited financial resources and lower farmer engagement (Figure 4(b)). Despite having similar reclamation potential, the lack of targeted government interventions has led to minimal farmer participation. This starkly highlights the differing outcomes across districts or counties [30].
To tackle these challenges and advance balanced urban-rural integration, local government should implement differentiated interventions tailored to actual conditions of each district and county. In economically less developed areas, governments should roll out targeted measures to boost farmers’ enthusiasm for reclamation, refine reclamation management, and step up publicity efforts around land ticket reclamation. They can leverage policy tools such as financial subsidies, tax incentives, and capacity-building programs to encourage farmers to participate in land reclamation and land ticket trading. In contrast, in economically developed areas, the local government should focus on highlighting the mutual benefits of land transfer and the appreciation potential of construction land, thereby easing reclamation demand. Additionally, governments should tailor the supply structure of land tickets according to local industrial structures, improve supply quality, and ensure the effectively implemented across regions with varying economic levels.
4.2 Farmers' reclamation willingness and land ticket supply potential
Farmers' willingness to reclaim their land is a critical factor affecting the supply potential of land tickets. Our study shows that household and housing characteristics significantly influence this willingness. Specifically, households with fewer members at home, those with multiple homesteads, and those living in earth-wood or brick-wood houses tend to have a higher willingness to reclaim land (Figure 3). Additionally, younger farmer (aged 20-35) and older farmers (aged 56 years and above) are more willing to reclaim their land than middle-aged farmers (aged 36-55). These results indicate that farmers' decisions on land reclamation are significantly impacted by their dependence on land, the sunk costs tied to housing structures, and the future expectations of different age groups [41].
Previous studies have found that both government regulations and farmers' own demands influence their willingness to reclaim land [35, 45], and that government regulations sometimes conflict with farmers' needs [46]. However, our study did not observe such conflicts. This may stem from the fact that, for farmers, the value of the idle land targeted by land tickets is lower than the benefits brought by the land tickets themselves. Additionally, the land homogenization strategy under the land ticket policy generates higher economic benefits for less developed areas than for more developed ones [39], whereas land ticket revenue has a relatively weak stimulus effect on less developed counties. This reflects the influence of factors such as housing sunk costs, income levels, and emotional attachment [40, 41], for farmers in less developed areas, the comprehensive value of idle land outweighs the economic returns they could gain by converting it into land tickets. In contrast, more developed areas offer more employment opportunities and sources of income, which reduces farmers' dependence on land [41], and thus making them more willing to participate in land reclamation.
To boost the supply potential of land tickets, it is essential to address these factors. Policies should target farmers with specific housing conditions or age profiles by offering tailored incentives. For instance, we could provide financial rewards to households with multiple homesteads or older housing structures to encourage land reclamation. Additionally, we can launch awareness campaigns to educate both young and elderly farmers about the benefits of land reclamation, which would boost their participation in such activities [30]. These measures can help enhance Chongqing’s overall land ticket supply potential.
4.3 Land ticket supply market potential and demand absorption
This study’s results indicated that Chongqing has substantial potential land ticket supply, reaching 927.74 km² (Figure 5). This figure far exceeds the historical supply and transaction volumes of land tickets from 2008 to 2022, which stand at 51.57 km² and 245.73 km², respectively [44]. Such a large supply potential can bring significant revenue to rural development, promote urban-rural integration, and drive rural revitalization. However, the recent slump in the real estate market has caused to a continuous decline in demand for land tickets, leaving the market with a significant oversupply.
Whether the land ticket market can maintain a long-term supply-demand balance hinges on the real estate market’s development trends [4]. Housing price expectations have an asymmetric impact: the shock from expected price declines is stronger than that from expected price increases [47]. Additionally, China’s low fertility rate is projected to significantly push down future housing prices [48]. As a result, the real estate market will likely stay in a prolonged recession, with little chance of short-term recovery. This will keep land ticket demand sluggish, unable to absorb the large supply potential. Demand for land tickets has fallen far more sharply than supply, creating a marked oversupply in the market. This issue not only undermines the effective operation of the land ticket system but also hurts farmers’ benefits from land reclamation.
To address the issue of oversupply and promote urban-rural integration, several strategies are proposed:
First, expand demand-side channels for land ticket usage. Beyond the traditional use of land tickets for urban construction land, we should explore new ways to use them to support rural development and ecological restoration projects [49, 50]. To achieve this, we can establish a dedicated fund—funded by land ticket revenue—to support rural infrastructure projects, and develop guidelines for local governments to allocate land tickets to rural development initiatives. These measures will boost land ticket demand and help balance the market [22].
Second, expand the functional diversity of land tickets. We can use land tickets for more purposes beyond urban construction, including ecological restoration and agricultural development. To achieve this, we can introduce new categories of land tickets tailored to specific needs like ecological restoration and agricultural development, and offer incentives to developers to use land tickets for these purposes. These approaches can enhance the market value and demand for land tickets.
Third, implement hierarchical management. We should adopt a tiered management approach, tailoring land ticket policies to local economic levels and resource conditions to ensure effective implementation across different regions. These can be achieved by developing regional land ticket policies that consider local economic conditions and resource availability, and by establishing a monitoring and evaluation system to assess the effectiveness of these policies. These approaches can help optimize the use of land tickets and promote regional balance.
Fourth, promoting the nationalization of the land ticket system. We should advance the nationalization of the land ticket system to optimize cross-regional resource allocation. To do this, we can establish a national land ticket exchange platform to facilitate interregional land tickets trading and develop a set of national standards for land ticket issuance and use. For instance, China’s western region has great potential for land reclamation, while the eastern region – the country’s main urbanization hub – has a high demand for new construction land indicators [51]. By promoting the nationalization of the land ticket system, we can optimize resource allocation between the eastern and western regions, solving the problem of supply and demand imbalance in the land ticket market. In this process, the central government should provide necessary financial support and policy guidance to help economically weaker regions for implementing the land ticket system, ensuring fairness and effectiveness of the system nationwide. These approaches can help address the issue of market imbalance and promote urban-rural integration.
Finally, the government can intervene in the liquidity of land tickets by determining appropriate scales for land ticket reserves and choosing the right timing to release them. This stabilizes land ticket prices and enhances market stability. These can be achieved by establishing a land ticket reserve system to manage the supply of land tickets, and by implementing a price stabilization mechanism to prevent market fluctuations. At the same time, we should strengthen the supervision of the land ticket market to prevent market manipulation and speculative, ensuring fairness and transparency. These approaches can help stabilize land ticket prices and enhance market stability.
4.4 Model limitations and improvements
Although this model comprehensively evaluates reclamation potential, assuming static weights for each indicator may introduce biases. To address this, this study conducted 10,000 Monte Carlo Carlo simulations to test the sensitivity of weight fluctuations within ±20%. Table 3 shows that the original potential coefficient has a small gap with the simulated mean and falls within the 95% confidence interval, confirming the robustness of the weight setting. Further Sobol global sensitivity analysis indicates that reclamation resource potential is the dominant influencing factor, while farmers' willingness to reclaim is a secondary factor (Table 4). This conclusion not only verifies the rationality of the initial weight setting but also provides a quantitative basis for policy formulation—focusing on accurate measurement of resource potential and continuity of historical trends, while balancing government guidance and farmers' micro-level willingness.
Table 3. Pearson's correlation coefficients between land ticket supply potential
|
Statistic |
Reference Value |
Analog Values |
Standard Deviation |
95% CI |
|
Potential Coefficient |
0.5582 |
0.4929 |
0.0929 |
(0.3108,0.6749) |
Table 4. Sobol first-order sensitivity contributions of each variable
|
Variables |
Reclamation Management Organization |
Government Reclamation Enthusiasm |
Land Ticket Supply Potential (km2) |
Historical Land Ticket Supply (km2) |
Farmers' Reclamation Willingness (%) |
|
First-Order Sensitivity Contributions |
0.033 |
0.048 |
0.766 |
0.133 |
0.019 |
This study comprehensively analysis of the supply potential of land tickets in Chongqing and the relevant factors influencing this potential. The generated findings reveal that locally economic development and farmers' reclamation willingness to reclaim land are key determinants of land ticket supply potential: districts and counties with stronger economic conditions and higher farmers' reclamation willingness to reclaim tend to have greater supply potential. These insights underscore that economic development and policy interventions are critical to improving land reclamation efficiency and boosting farmers' participation in reclamation activities.
The study also highlights that land tickets in Chongqing have substantial supply potential, reaching to 927.74 km2, —far exceeding historical supply and transaction volumes. However, the recent downturn in the real estate market has driven a steady drop in the demand for land tickets, leaving the market with a significant oversupply. This scenario calls for stronger demand absorption capacity and better optimization of land ticket utilization.
To address the oversupply issue and advance urban-rural integration, we propose several policy recommendations. First, broaden the use of land tickets to boost demand: expand their traditional role in urban construction land to cover other areas, such as supporting or upgrading rural infrastructure and funding ecological restoration projects. Second, enhance the functional diversity of land tickets by applying them tectological protection and agricultural development which will enhance their market value and demand. Third, implement hierarchical management through a tiered approach that tailor land ticket policies to local conditions, thereby optimize their use and promote regional balance. Fourth, promote the nationalization of the land ticket system to enable across-regions resource optimization. Finally, intervene in land ticket liquidity by regulating reserve scales and release timings to stabilize prices and strengthen market stability. While the nationalization strategy for land tickets theoretically aligns with the existing land reserve system to some extent, its effective implementation is profoundly constrained by two core external factors: the shifting macroeconomic development phase (characterized by slowing urbanization leading to contraction in quota demand) and local fiscal resource endowments (where revenue deceleration induces insufficient payment capacity). These factors collectively constitute the primary institutional feasibility and operational barriers currently facing this strategy.
Future research should expand the study scope, explore market demand, and take into account the dynamic nature of farmers' willingness to reclaim land. These efforts will yield deeper insights into the land ticket system and help formulate more effective policies for urban-rural integration.
Sincere thanks to Jiafei Bai for guiding the model construction of this paper, to Xiaojun Chen for providing data assistance, and to Xuemei Tang and Shanqiang Lai for their valuable suggestions—all of which have helped refine the manuscript.
|
$i$ |
range from 1 to 5 |
|
$K$ |
the potential supply of land tickets |
|
$K1$ |
the current area of rural residential land points |
|
$K2$ |
the planned per capita construction land area |
|
$P_i$ |
the level assigned to each indicator in a specific district or county |
|
$P$ |
the projected rural population by 2035 |
|
$W_i$ |
(corresponding to reclamation management organization, government reclamation enthusiasm, reclamation resource potential, historical land ticket supply, and farmers' willingness to reclaim) thermal conductivity, W.m-1. K-1 |
|
X |
the potential coefficient for land ticket reclamation and conversion |
[1] Fang, C. (2022). Theoretical analysis on the mechanism and evolution law of urban-rural integration development. Acta Geographica Sinica, 77(4): 759-776. https://doi.org/10.11821/dlxb202204001
[2] Wang, Y., Tian, L., Wang, Z., Wang, C., Gao, Y. (2023). Effects of transfer of land development rights on urban-rural integration: Theoretical framework and evidence from Chongqing, China. Land, 12(11): 2045. https://doi.org/10.3390/land12112045
[3] Zhou, J., Zeng H. (2022) .Analysis on the effectiveness and mechanism of land ticket system based on synthetic control method. Scientific and Technological Management of Land and Resources, 39(5): 78-91. https://doi.org/10.3969/j.issn.1009-4210.2022.05.007
[4] Wang, Y., Yang, A., Liu, Y., Yang, Q. (2024). Effects of the land bill system in Chongqing municipality on the integrated development of urban and rural areas and implications. Progress in Geography, (5): 888-904. https://doi.org/10.18306/dlkxjz.2024.05.004
[5] Li, W.M., Li, B.K. (2020). The exploration and practice on achieving the ecologic product values by expanding the ecologic function of Dipiao System in Chongqing. Journal of Chongqing Institute of Technology, 4: 1-5. https://doi.org/10.3969/j.issn.1674-8425(s).2020.04.001
[6] Zhang, N., Yu, L. (2023). Conservation easement practice of American experience and its enlightenment and imolications. World Agriculture, 1: 57-65. https://doi.org/10.13856/j.cn11-1097/s.2023.01.005
[7] Zhou, S.Y. (2024). Localization construction of conservation easement system. Journal of HeiLongJiang Vocational Institute of Ecological Engineering, 37(3): 79-84. https://doi.org/10.3969/j.issn.1674-6341.2024.03.15
[8] Que, Z. (2024). Theoretical proof and systematic positioning of protecting servitude rights. Journal of Jiangxi University of Finance and Economics, 6: 113-125. https://doi.org/10.13676/j.cnki.cn36-1224/f.20240925.001
[9] Fan, W., Zhang, Y., Chen, N., Nie, W. (2024). A review of rural land capitalization: Current status and further research. Land, 13(3): 401. https://doi.org/10.3390/land13040401
[10] Cheng, L., Xu, Z., Li, J. (2022). Promote or demote? Investigating the impacts of China’s transferable development rights program on farmers’ income: A case study from Chongqing. International Journal of Environmental Research and Public Health, 19(21): 13751. https://doi.org/10.3390/ijerph192013751
[11] Liang, J., Liang, J., Li, L. (2023). Operational mechanism of land tickets under the territorial spatial planning system. Natural Resources Information, 62-67. https://doi.org/10.3969/j.issn.1674-3709.2023.12.011
[12] Gu, H.L., Liu, Y.Y., Wang, Q.B. (2020). Spillover effects on transaction of land development right and regional economic growth: Empirical analysis based on land quota trading policy in Chongqing. China Population Resources and Environment, 3: 126-134. https://doi.org/10.12062/cpre.20191011
[13] Zhang, Z.L., Li, P.H. (2022). The impact of land development right transaction on urban-rural income gap and its mechanism: An example of the practice of Chongqing land ticket. Chinese Rural Economy, 14: 36-49.
[14] Gu, H., Liu, Y., Wang, Q. (2020). Spillover effects on transaction of land development right and regional economic growth: Empirical analysis based on land quota trading policy in Chongqing. China Population, Resource and Environment, 30(3): 126-134.
[15] Fan, W., Chen, N., Li, X., Wei, H., Wang, X. (2020). Empirical research on the process of land resource-asset-capitalization—A case study of Yanba, Jiangjin District, Chongqing. Sustainability, 12(3): 1236. https://doi.org/10.3390/su12031236
[16] Wei, S., Huang, J., Zhang, Z. (2025). The impact of land development rights transfer on urban–rural spatial justice: A case study of Chongqing’s land quota trading. Land, 14(1): 174. https://doi.org/10.3390/land14020174
[17] Tan, X.L. (2010). An economic analysis of the game between each beneficiary in land ticket trade. Reformation and Strategy, 3: 91-93. https://doi.org/10.3969/j.issn.1002-736X.2010.03.023
[18] Wen, L.J., Yang, S.J., Qi, M.N., Zhang, A.L. (2024). How does China’s rural collective commercialized land market run? New evidence from 26 pilot areas, China. Land Use Policy, 136: 106969. https://doi.org/10.1016/j.landusepol.2023.106969
[19] Tian, T., Hao, M., Zhang, Z., Ran, D. (2024). Urbanization in dynamics: The influence of land quota trading on land and population urbanization. Land, 13(2): 163. https://doi.org/10.3390/land13020163
[20] Du, X., Wang, L., Tang, F., Xu, S., Muhammad, S., Nath, B., Niu, Z. (2023). Estimation and development-potential analysis of regional housing in Ningbo city based on high-resolution stereo remote sensing. Remote Sensing, 15(16): 3953. https://doi.org/10.3390/rs15163953
[21] Liu, J., Meng, W., Li, Y., Huang, B. (2024). The allocative efficiency of construction land quota in rural China: A perspective of bidders’ behavior and regret psychology. Environmental Science and Pollution Research, 31(8): 11968-11982. https://doi.org/10.1007/s11356-024-31873-6
[22] Ding, W., Rao, J., Zhu, H. (2024). Analysis of the evolution of the policy of linking the increase and decrease in urban and rural construction land in China based on the content analysis method. Land, 13(3): 329. https://doi.org/10.3390/land13030329
[23] Hajduga, P. (2023). Analysis of changes in trade in developed land property in Poland between 2017 and 2020. Biblioteka Regionalisty, 23: 22-31. https://doi.org/10.15611/br.2023.1.03
[24] Wang, H., Cao, Y., Wu, X., Zhao, A., Xie, Y. (2022). Estimation and potential analysis of land population carrying capacity in Shanghai metropolis. International Journal of Environmental Research and Public Health, 19(14): 8240. https://doi.org/10.3390/ijerph19148240
[25] Muhammed, E., El-Shazly, A., Morsy, S. (2023). Building rooftop extraction using machine learning algorithms for solar photovoltaic potential estimation. Sustainability, 15(14): 11004. https://doi.org/10.3390/su151411004
[26] Heck, R., Rudi, A., Lauth, D., Schultmann, F. (2024). An estimation of biomass potential and location optimization for integrated biorefineries in Germany: A combined approach of GIS and mathematical modeling. Sustainability, 16(16): 6781. https://doi.org/10.3390/su16166781
[27] Huang, X.N., Tian, Q.X., Liu, S.G., Yu, H.E. (2024). Evaluation and potential calculation of intensive and economical land use in development zone in new development stage based on GIS and multi-factor comprehensive evaluation method. ShangDong Land and Resources, 7: 66-72. http://doi.org/10.12128/j.issn.1672-6979.2024.04.009
[28] Huang, Z., Fu, Y., Li, J., Yin, S., et al. (2022). Consolidation potential of rural residential areas based on village types: Taking Liaocheng City as an example. China Land Science, 36(12): 78-90. http://doi.org/10.11994/zgtdkx.20221107.151016
[29] Yang, W.W., Wang, Y.P. (2017). Comparison analysis on calculation method of land arrangement potential in rural residential areas. Hubei Agricultural Sciences, 10(3): 3941-3946. https://doi.org/10.4236/jacen.2021.103018
[30] Zhao, W., Dong, X., Zhang, Z. (2022). On potential and model of rural residential lands consolidation based on cold-hot spot analysis. Journal of Southwest China Normal University (Natural Science Edition), 47: 64-71. https://doi.org/10.13718/j.cnki.xsxb.2022.02.012
[31] Feng, Y., Guo, X., Yang, Q., Li, X. (2014). Study on supply-demand balance of Chongqing’ land ticket index in the perspective of optimal allocation of urban and rural-rural construction land. Journal of Southwest University, 36: 107-113. https://doi.org/10.13718/j.cnki.xdzk.2014.05.019
[32] Huang, Z.J., Shi, T., Tong, D. (2025). Understanding the role of government in regional industrial evolution: Evidence from land supply in China. Papers in Regional Science, 104(1): 100070. https://doi.org/10.1016/j.pirs.2024.100070
[33] Chongqing Municipal Bureau of Statistics. Chongqing Statistical Yearbook 2022. https://tjj.cq.gov.cn/zwgk_233/tjnj/2022/zk/indexeh.htm.
[34] Xie, J.H., Yang, G.Q., Wang, G., Song, Y., Yang, F. (2021). How do different rural-land-consolidation modes shape farmers’ ecological production behaviors? Land Use Policy, 109: 105592. https://doi.org/10.1016/j.landusepol.2021.105592
[35] Wu, Z., Zhu, D. (2020) Willingness of Public participation in land reclamation of abandoned mines in Ganzhou City, Jiangxi Province. Bulletin of Soil Water Conservation. 40(3): 133-141. https://doi.org/10.13961/j.cnki.stbctb.2020.04.019
[36] Zheng, L., Zou, H.Y., Duan, X.F., Lin, Z.G., Du, H.B. (2023). Potential determinants affecting the growth of China’s ocean economy: An input-output structural decomposition analysis. Marine Policy, 150: 105520. https://doi.org/10.1016/j.marpol.2023.105520
[37] Dalkey, N., Helmer, O. (1963). An experimental application of the Delphi method to the use of experts. Management Science, 9(3): 458-467. https://doi.org/10.1287/mnsc.9.3.458
[38] Yep, R., Forrest, R. (2016). Elevating the peasants into high-rise apartments: The land bill system in Chongqing as a solution for land conflicts in China? Journal of Rural Studies, 47(B): 474-484. https://doi.org/10.1016/j.jrurstud.2016.07.017
[39] Yan, Y., Yang, Q., Su, K., Bi, G., Li, Y. (2022). Farmers’ willingness to gather homesteads and the influencing Factors—An empirical study of different geomorphic areas in Chongqing. International Journal of Environmental Research and Public Health, 19(9): 5252. https://doi.org/10.3390/ijerph19095252
[40] Chen, H.X., Zhao,L.M., Zhao, Z.Y. (2017). Influencing factors of farmers’ willingness to withdraw from rural homesteads: A survey in Zhejiang, China. Land Use Policy, 68: 524-530. https://doi.org/10.1016/j.landusepol.2017.08.017
[41] Xia, T., Carayannis, E. G., Sindakis, S., Showkat, S., Kanellos, N. (2024). Technology transfer for sustainable rural development: Evidence from homestead withdrawal with compensation in Chengdu–Chongqing. The Journal of Technology Transfer, 49(1): 303-333. https://doi.org/10.1007/s10961-023-10038-6
[42] Han, J., Tan, M. (2025). Dramatic decoupling between population and construction land in rural China. Land, 14(3): 605. https://doi.org/10.3390/land14030605
[43] Zhang, F., Hou, K.H., Zhu, X.Y., Cao, L.Y., Pu, Y.R. (2015). The effect study of a mine land reclamation based on the method of fuzzy comprehensive evaluation analysis. Applied Mechanics and Materials, 744-746: 2417-2421. https://doi.org/10.4028/www.scientific.net/AMM.744-746.2417
[44] Li, Z.T. (2025). Evaluating and optimising Chongqing’s land-ticket scheme: Evidence from an S-CAD framework. Journal of Economics and Law, 2(2): 68-74. https://doi.org/10.62517/JEL.202514211
[45] Song, B., Han, X., Lv, S., Fang, Q., Wang, Z., Li, H. (2024). What affects the willingness of farmers to participate in forest ticket trading? Empirical analysis based on incomplete information theory. Forests, 15(5): 821. https://doi.org/10.3390/f15050821
[46] Zhang, H., Bai, Z., Wang, J., Zhang, J., et al. (2013) Internal mechanism and stakeholder analysis on public participation of mining land reclamation. Chinese Land Science, 8: 73-78. https://doi.org/10.3969/j.issn.1001-8158.2013.08.011
[47] Wei, Q. (2023). House price expectations and household consumption. Journal of Economic Dynamics and Control, 151: 104652. https://doi.org/10.1016/J.JEDC.2023.104652
[48] Hui, E.C.M., Zheng, X., Hu, J. (2012). Housing price, elderly dependency and fertility behaviour. Habitat International, 36(2): 304-311. https://doi.org/10.1016/j.habitatint.2011.10.006
[49] Zang, Y., Zhu, J., Han, X., Lv, L. (2023). Dynamics between population growth and construction land expansion: Evidence from the Yangtze River economic belt of China. Land, 12(7): 1288. https://doi.org/10.3390/land12071288
[50] Su, K., Wu, J., Yan, Y., Zhang, Z., Yang, Q. (2022). The functional value evolution of rural homesteads in different types of villages: Evidence from a Chinese traditional agricultural village and homestay village. Land, 11(6): 903. https://doi.org/10.3390/land11070903
[51] Yang, S., Wen, L. (2023). Regional heterogeneity in China’s rural collectively owned commercialized land market: An empirical analysis from 2015–2020. Land, 12(2): 441. https://doi.org/10.3390/land12030441