Abdi Majid Yusuf Ibey*![]() | Farhia Abdinor Abdulle
| Farhia Abdinor Abdulle![]() | Maryamo Mohamed Abdiaziz
| Maryamo Mohamed Abdiaziz![]() | Anfa Mohamed Ali
| Anfa Mohamed Ali![]() | Nafis Abdi Hersi
| Nafis Abdi Hersi![]()
© 2025 The authors. This article is published by IIETA and is licensed under the CC BY 4.0 license (http://creativecommons.org/licenses/by/4.0/).
OPEN ACCESS
Life expectancy in Somalia remains critically low due to the complex interplay of economic, environmental, and political factors. This study aims to examine the determinants of life expectancy in Somalia from 1985 to 2022. Using the Autoregressive Distributed Lag (ARDL) model and VECM Granger causality tests, the analysis incorporates GDP, income inequality, CO₂ emissions, institutional quality, and internal conflict as key explanatory variables. The ARDL bounds test confirms a long-run cointegration relationship among these factors. The results reveal that GDP has a positive and significant impact on life expectancy (coefficient = 0.0675, p = 0.0163), while income inequality (-27.582, p = 0.0257) and CO₂ emissions (-0.176, p = 0.0324) negatively affect life expectancy in the long run. Additionally, weak institutional quality (-2.187, p = 0.000) and internal conflict (-0.103, p = 0.002) significantly reduce life expectancy. The error correction term is negative and highly significant (-1.536, p = 0.000), indicating a strong adjustment toward equilibrium. The study concludes that fostering inclusive economic growth, improving governance, reducing inequality, and addressing environmental degradation are essential to improving life expectancy in Somalia.
life expectancy, economic growth, income inequality, CO₂ emissions, institutional quality, Somalia, ARDL model
Life expectancy is a crucial indicator of a nation's overall health and development, reflecting the quality of healthcare, economic prosperity, and social stability [1]. In many countries, economic growth, environmental sustainability, and political stability play a decisive role in shaping public health outcomes. While higher GDP per capita is often linked to improved access to healthcare, nutrition, and sanitation [2], income inequality can limit these benefits by restricting essential services for lower-income groups [3]. The relationship between economic growth and life expectancy is well-documented; however, studies indicate that beyond a certain income threshold, unequal distribution of wealth negates the benefits of economic progress [4, 5]. Environmental factors such as CO₂ emissions and pollution have also been shown to negatively impact life expectancy, with air pollution contributing to an estimated 8.7 million premature deaths globally in 2018 [6]. Furthermore, political instability and weak institutional frameworks exacerbate health disparities by disrupting essential public health services and limiting access to healthcare [7, 8]. Somalia, a fragile state with a history of armed conflict, economic instability, and climate-related challenges, presents a unique case where these factors intersect in complex ways to shape health outcomes.
Existing research on the determinants of life expectancy has primarily focused on developed economies, where strong institutions and stable governance support long-term public health improvements [9]. However, in conflict-affected and economically fragile states like Somalia, the relationship between economic growth, environmental degradation, and political instability remains underexplored. While previous studies have found that GDP growth tends to increase life expectancy [10], Evidence suggests that in highly unequal societies, the benefits of economic growth are disproportionately distributed, leading to widening health disparities [11]. Additionally, although environmental factors, such as CO₂ emissions and climate change, are widely recognized as determinants of global mortality rates [12], their specific impact on Somalia's public health system remains unclear due to limited environmental data. Moreover, internal conflict and weak institutions in Somalia have repeatedly disrupted healthcare services, exacerbated poverty, and contributed to persistently high mortality rates [13]. Despite these challenges, few empirical studies have examined how these factors collectively influence life expectancy in Somalia, leaving a significant research gap.
This study aims to analyze the long-term impact of economic, environmental, and political factors on life expectancy in Somalia from 1985 to 2022. Specifically, it investigates the roles of GDP growth, income inequality, CO₂ emissions, internal conflict, and institutional quality in shaping health outcomes. By integrating these factors, the research seeks to determine whether their effects on life expectancy are immediate or long-term, offering valuable insights into how economic, environmental, and political challenges interact to influence health trends in Somalia. Ultimately, the study aims to answer the central question: How do economic growth, environmental sustainability, and political stability collectively influence life expectancy in Somalia?
Understanding the key drivers of life expectancy is essential for policymakers, particularly in fragile states where economic, environmental, and political challenges converge. This study provides a comprehensive empirical analysis of Somalia’s public health determinants, offering insights that can inform targeted policy interventions aimed at reducing mortality rates and improving health outcomes. The findings have direct implications for policy reforms, including strategies for reducing income inequality, strengthening healthcare infrastructure, implementing environmental regulations, and improving governance. Moreover, this study contributes to the broader literature by analyzing the role of political instability in determining life expectancy, a critical but often overlooked factor in economic research.
The remainder of the paper is structured as follows: Section 2 reviews relevant literature on the relationships between economic growth, environmental sustainability, political stability, and life expectancy. Section 3 outlines the methodology, detailing the data sources and econometric models used for analysis. Section 4 presents the results and discussion, while Section 5 provides conclusions and policy implications based on the study’s findings.
2.1 Economic factors (GDP and income inequality) and life expectancy
Empirical studies show a positive relationship between GDP and life expectancy, especially in low-income countries, where economic growth improves access to healthcare, nutrition, and sanitation [4]. However, this effect diminishes in high-income countries, where income inequality becomes a major determinant of health outcomes [3]. Countries like Japan achieve high life expectancy through strong healthcare systems despite lower GDP per capita, while the U.S. suffers from lower life expectancy due to high inequality [14, 15].
In developing regions, GDP growth enhances life expectancy but often benefits the wealthy more, with inequality limiting broader health gains [16, 17]. Sub-Saharan Africa faces compounded challenges from low GDP, inequality, and poor health infrastructure, resulting in persistently low life expectancy [18, 19]. Somalia represents an extreme case where conflict, poverty, and weak governance undermine the impact of economic growth on health, despite some positive effects [10, 20]. Overall, income distribution and institutional quality critically shape the GDP–life expectancy link.
2.2 Environmental factor (CO₂ emissions) and life expectancy
Empirical evidence shows that CO₂ emissions significantly harm human health by contributing to air pollution, climate-related disasters, and food insecurity [21]. The Environmental Kuznets Curve (EKC) suggests that environmental degradation initially rises with economic growth but declines as countries adopt cleaner technologies [22]. However, developed nations remain major CO₂ emitters, where emissions still pose health risks despite technological advances and strong environmental policies [12, 23, 24].
In developing countries, economic growth often comes with higher CO₂ emissions, worsening air quality, and reduced life expectancy [25, 26]. Studies in China, India, and ASEAN countries reveal that emissions are linked to rising respiratory and cardiovascular diseases [27, 28]. Additionally, climate change-driven food insecurity and disease outbreaks further threaten health outcomes, especially in rural areas [29, 30].
Sub-Saharan Africa, while contributing minimally to global emissions, suffers disproportionately from their impacts. Climate-induced droughts, food insecurity, air pollution from biomass use, and the spread of infectious diseases like malaria significantly lower life expectancy in the region [31-34]. Overall, the findings underscore that CO₂ emissions adversely affect life expectancy worldwide, with developing and vulnerable regions facing the greatest risks.
2.3 Political factors (internal conflict and institutional quality) and life expectancy
Empirical studies consistently show that internal conflict and institutional quality are critical determinants of life expectancy. Internal conflicts disrupt healthcare systems, displace populations, and divert resources from public health, leading to increased mortality and lower life expectancy [7, 8]. Evidence from OECD and emerging economies indicates that conflict significantly reduces life expectancy, with women often disproportionately affected [35, 36].
Strong institutions mitigate these effects by ensuring equitable resource distribution and effective service delivery [37]. Countries with high institutional quality, like New Zealand and Costa Rica, maintain higher life expectancy even amid economic or health crises [38, 39]. Conversely, weak institutions, as seen in Venezuela, Syria, and Nigeria, exacerbate health challenges, contributing to declining life expectancy [40-42].
Sub-Saharan Africa faces compounded challenges of weak institutions and frequent conflicts, which severely undermine health outcomes, particularly among women and children [43, 44]. In Somalia, improving institutional quality has shown positive effects on environmental conditions and indirectly on health outcomes [45]. Overall, the evidence highlights that stable governance and strong institutions are essential for improving and sustaining life expectancy in both developed and developing regions.
3.1 Data and sources
This study examines the factors influencing life expectancy in Somalia from 1985 to 2022, a period marked by significant historical, political, and socio-economic changes that have shaped public health. The late 1980s saw the onset of political unrest, culminating in the 1991 civil war and the subsequent collapse of the state, which severely disrupted healthcare services. Recurrent famine crises (1992, 2011, 2017, and 2022), disease outbreaks, and widespread malnutrition further exacerbated mortality rates. However, from the early 2000s onward, the expansion of private healthcare, increased NGO interventions, and gradual political stabilization contributed to improved healthcare access. Additionally, economic, political, and environmental factors have played a crucial role in shaping life expectancy trends. This period is well-documented by global organizations such as the WHO, World Bank, and UN, ensuring reliable data for analysis. Prior to 1985, no comprehensive life expectancy data existed for Somalia, making this the logical starting point for the study.
The choice of this topic is driven by the need to understand the multi-dimensional factors influencing life expectancy in Somalia, a country that has faced decades of economic struggles, political instability, and environmental challenges. Existing research often focuses on isolated determinants, but this study integrates economic (GDP, income inequality), political (internal conflict, institutional quality), and environmental (CO₂ emissions) factors to provide a holistic analysis.
GDP is chosen as a variable impacting life expectancy in Somalia because higher GDP is often associated with better healthcare infrastructure, improved nutrition, and access to essential public services, all of which contribute to longer life expectancy [46]. Studies [47-50] highlight how economic development enhances public health outcomes by increasing government investment in healthcare.
Income inequality is chosen as a variable impacting life expectancy in Somalia because high income inequality limits access to healthcare, education, and proper nutrition, disproportionately affecting lower-income populations and increasing mortality rates. Wilkinson and Pickett [3] argued that greater income inequality leads to worse health outcomes and shorter life expectancy due to heightened social stress and reduced investment in public health. Additionally, previous studies have analyzed income inequality [51-53] as a key factor influencing life expectancy in both developed and developing countries, highlighting its significant role in public health disparities.
CO₂ emissions are chosen as a variable impacting life expectancy in Somalia because environmental degradation and climate change significantly affect public health, particularly in fragile states with weak healthcare systems. Rising CO₂ levels contribute to air pollution, extreme weather events, and food insecurity, all of which increase mortality rates. Lelieveld et al. [6] highlighted that prolonged exposure to air pollution from CO₂ emissions is strongly linked to respiratory diseases, cardiovascular conditions, and premature deaths, especially among vulnerable populations. Furthermore, previous studies explored the impact of CO₂ emissions on life expectancy, reinforcing the connection between environmental factors and public health outcomes [54-56].
In the Somali context, the selection of CO₂ as the sole environmental indicator is driven by data limitations, as alternative environmental health indicators (e.g., particulate matter, air quality indices) are not consistently available for the full study period. CO₂ emissions are widely accepted in the literature as a proxy for broader environmental degradation, reflecting underlying industrial activity, deforestation, and fuel consumption. In fragile countries like Somalia, CO₂ emissions also correlate with indirect health risks through climate-induced challenges such as drought, water scarcity, and food insecurity, all of which are known to influence life expectancy.
Internal conflict is chosen as a variable impacting life expectancy in Somalia because prolonged violence and instability disrupt essential public services, destroy healthcare infrastructure, and displace populations, leading to higher mortality rates. Ghobarah et al. [57] found that civil conflicts significantly increase disease burdens and reduce life expectancy due to weakened healthcare systems and lack of access to medical care. Similarly, Li and Wen [58] highlighted that conflict diverts government resources away from health and social welfare, worsening overall public health. Somalia’s ongoing instability since the 1991 civil war has led to widespread displacement, famine, and inadequate medical services [59], making internal conflict a critical factor in understanding fluctuations in life expectancy.
Institutional quality is chosen as a variable impacting life expectancy in Somalia because strong institutions are essential for effective healthcare systems, public service delivery, and overall governance, which directly influence health outcomes [60]. Weak institutions often lead to corruption, mismanagement of healthcare resources, and inadequate policy implementation, worsening mortality rates [61]. Additionally, previous studies examined the impact of institutional quality on life expectancy [62, 63], highlighting its critical role in shaping public health outcomes.
The study’s dependent variable, life expectancy (LE), was examined along with independent variables like the area's gross domestic product (GDP), Income inequality (INQ), Carbon dioxide emissions (CO2), Internal conflict (IC), and Institutional quality (IQ). The life expectancy (LE) and CO2 Emissions (CO2) data were obtained from SESERIC, the Gross Domestic Product (GDP) data were obtained from World Development Indicators (WB), Income inequality (INQ) data were obtained from the World Inequality Database (WID), which provides the most consistent long-term data for Somalia from 1985 to 2022. Other databases, such as the World Bank or the UN, do not offer continuous inequality data for Somalia over this period. WID constructs inequality estimates based on national accounts and regional modeling when household survey data are missing, which is common for fragile states like Somalia. Internal conflict (IC) data were obtained from ICRG published by PRS, while the Institutional quality (IQ) data were obtained from Freedom House. All data relevant to different variables were acquired annually. Table 1 provides a thorough explanation of the variables used in the research, as well as their sources and data descriptions.
Table 1. Variable description and data source
|
Symbol |
Variable |
Measurement |
Source |
|
LE |
Life Expectancy |
Life Expectancy at Birth, Both Sexes |
SESRIC |
|
GDP |
Gross Domestic Product |
Gross Domestic Product (constant 2015 US$) |
World Development indicators (WB) |
|
INQ |
Income inequality |
Gini coefficient of Post-tax national income, The coefficient is an index ranging from 0 to 1, with 0 meaning no inequality and 1 meaning perfect inequality |
World Inequality Database (WID) |
|
CO2 |
Carbon dioxide emissions |
Total CO₂ emissions (millions of metric tons) |
SESRIC |
|
IC |
Internal conflict |
It is assessment rating contains three components: (a) civil war/ coup threat, (b) terrorism/political violence, (c) civil disorder |
ICRG published by PRS |
|
IQ |
Institutional quality |
Composite index of political and civil rights |
Freedom House |
3.2 Econometric model specification
The Autoregressive Distributed Lag (ARDL) model, developed by Pesaran et al. [64], was employed to examine the short-run and long-run effects of the independent variables on life expectancy in Somalia. The ARDL model is particularly suitable when variables are integrated at I(0) or I(1), which is the case in this study, making it an appropriate choice for analyzing the relationship between the selected factors and life expectancy. It effectively addresses spurious regression issues by incorporating lag dynamics, which are essential for accurate modeling in non-stationary time series analysis [65]. The model is suited for comparing short-run and long-run elasticities for small samples based on OLS assumptions to examine the existence of cointegration between the components of interest [66].
The relationship between Economic, Political, and Environmental Factors on Life Expectancy was examined using the following functional model:
$\mathrm{LE}=\mathrm{f}\left(\mathrm{GDP}, \mathrm{INQ}, \mathrm{CO}_2, \mathrm{IC}, \mathrm{IQ}\right)$ (1)
To explore the long-term link between LE, GDP, INQ, CO2, IC, and IQ, we employ the following equation derived from Eq. (1):
$\begin{gathered}\mathrm{LE}_t=\beta_0+\beta_1 \mathrm{GDP}_{\mathrm{t}}+\beta_2 \mathrm{INQ}_{\mathrm{t}}+\beta_3 \mathrm{CO2}_{\mathrm{t}}+\beta_4 \mathrm{IC}_{\mathrm{t}}+ \beta_5 \mathrm{IQ}_{\mathrm{t}}+\varepsilon_{\mathrm{t}}\end{gathered}$ (2)
To get the direct Elasticities of coefficients and make the estimation process smooth, we use the logarithm of the variables, which helps in selecting appropriate time series models derived from Eq. (2):
$\begin{gathered}\mathrm{LLE}_t=\beta_0+\beta_1 \mathrm{LGDP}_t+\beta_2 \mathrm{LINQ}_t+\beta_3 \mathrm{LCO2}_t+ \beta_4 \mathrm{LIC}_t+\beta_5 \mathrm{LIQ}_t+\varepsilon_t+\varepsilon_t\end{gathered}$ (3)
where, β0, β1, β2, β3, β4, and β5 are the slope coefficients, ε is the error term, t is the time period, and L is the logarithm function.
Eq. (3) may be reformulated as an ARDL expression as follows:
$\begin{gathered}\Delta L L E_t=\beta_0+\sum_{j=0}^q \beta_1 \Delta L L E_{t-l}+ \sum_{i=0}^p \beta_2 \Delta L G D P_{t-i}+\sum_{i=0}^p \beta_3 \Delta L I N Q_{t-i}+ \sum_{i=0}^p \beta_4 \Delta L C O 2_{t-i}+\sum_{i=0}^p \beta_5 \Delta L I C_{t-i}+ \\ \sum_{i=0}^p \beta_6 \Delta L I Q_{t-i}+\alpha_1 \operatorname{LLE}_{t-1}+\alpha_2 \operatorname{LGDP}_{t-1}+ \alpha_3 \operatorname{LINQ}_{t-1}+\alpha_4 \operatorname{LCO2}_{t-1}+\alpha_5 \operatorname{LIC}_{t-1}+ \alpha_6 \operatorname{LIQ}_{t-1}+\varepsilon_t\end{gathered}$ (4)
The symbol Δ represents the first difference operator, which is used to transform the variables into their short-run changes. LLEt denotes life expectancy (measured by the natural logarithm of Life expectancy) at time t. The terms LGDP, LINQ, LCO2, LIC, and LIQ represent the lagged values of Gross Domestic Product, Income Inequality, Carbon dioxide emissions, internal conflict, and institutional quality, respectively. β0 is the constant term in the model. The coefficients β1, β2, β3, β4, β5, and β5 capture the short-run effects of the independent variables on economic growth, while α1, α2, α3, α4, α5, and α6 represent the long-run coefficients, indicating the equilibrium relationship between the variables. Finally, ε is the error term, which accounts for random disturbances or unexplained variations in the model.
The short-run dynamic parameters are derived through the estimation of an error correction model (ECM). The details are outlined as follows:
$\begin{gathered}\Delta L L E_t=\beta_0+\sum_{j=0}^q \beta_1 \Delta L L E_{t-l}+ \sum_{i=0}^p \beta_2 \Delta L G D P_{t-i}+\sum_{i=0}^p \beta_3 \Delta L I N Q_{t-i}+ \sum_{i=0}^p \beta_4 \Delta L C O 2_{t-i}+\sum_{i=0}^p \beta_5 \Delta L I C_{t-i}+ \\ \sum_{i=0}^p \beta_6 \Delta L I Q_{t-i}+\delta E C M_{t-i}+\varepsilon_t\end{gathered}$ (5)
The term ECMt-i represents the lagged error correction term, which captures the deviation from the long-run equilibrium in the previous period. It is derived from the long-run cointegration relationship estimated in the ARDL model. The coefficient δ measures the speed of adjustment, indicating how quickly the system returns to the long-run equilibrium following a shock. A negative and statistically significant value of δ signifies convergence to equilibrium, reflecting the economy's ability to correct deviations over time.
After validating the existence of long-run cointegration, we analyzed the VECM Granger causality to guarantee the reliability of our results. A series of diagnostic tests was conducted to validate the ARDL model. The Jarque-Bera test confirmed that the residuals were normally distributed, while the Breusch-Godfrey test indicated the absence of autocorrelation. Heteroskedasticity was assessed using the Breusch-Pagan-Godfrey test, which confirmed the absence of heteroskedasticity. Finally, the CUSUM and CUSUM of squares tests demonstrated the stability of the model's parameters, further reinforcing the reliability of our results.
4.1 Descriptive statistics and correlation analysis
The descriptive analysis in Table 2 shows that life expectancy (LLE) has a mean of 3.91 with low variability (std. dev. 0.16), while GDP (LGDP) has the highest variability (std. dev. 0.61), indicating significant fluctuations in economic growth. Internal conflict (LIC) also exhibits notable variation (std. dev. 0.50), suggesting periods of instability. The correlation analysis indicates that GDP (0.472) positively correlates with life expectancy, implying that economic growth enhances well-being. However, internal conflict (-0.607) has a strong negative correlation with life expectancy, suggesting that instability reduces longevity. CO2 emissions (-0.243) show a weak negative relationship with life expectancy, while income inequality (LINQ) and institutional quality (LIQ) have near-zero correlations, implying minimal direct influence.
Table 2. Descriptive and correlation analysis
|
Variables |
LLE |
LGDP |
LINQ |
LCO2 |
LIQ |
LIC |
|
Mean |
3.90600 |
21.8285 |
-0.583 |
-0.453 |
1.9342 |
1.039 |
|
Median |
3.925 |
21.65 |
-0.582 |
-0.485 |
1.945 |
1.098 |
|
Maximum |
4.044 |
22.93 |
-0.580 |
0.003 |
1.945 |
1.945 |
|
Minimum |
3.279 |
21.103 |
-0.587 |
-0.741 |
1.871 |
0.000 |
|
Std. Dev. |
0.156 |
0.607 |
0.001 |
0.184 |
0.027 |
0.499 |
|
Observations |
38 |
38 |
38 |
38 |
38 |
38 |
|
Correlation |
|
|||||
|
LLE |
1 |
|
|
|
|
|
|
LDGP |
0.472 |
1 |
|
|
|
|
|
LINQ |
0.027 |
-0.045 |
1 |
|
|
|
|
LCO2 |
-0.243 |
-0.163 |
-0.756 |
1 |
|
|
|
LIQ |
-0.045 |
0.404 |
-0.431 |
0.448 |
1 |
|
|
LIC |
-0.607 |
-0.678 |
0.003 |
0.140 |
-0.119 |
1 |
4.2 Unit root tests
The unit root test results in Table 3 indicate the stationarity properties of the variables using both the Augmented Dickey-Fuller (ADF) and Phillips-Perron (PP) tests. The lag length for ADF and PP tests was selected based on the Akaike Information Criterion (AIC), which optimizes the balance between model fit and complexity. This ensures that autocorrelation is addressed and the unit root tests are correctly specified. The results show that LLE and LINQ are stationary at the level, as their test statistics are significant at the 5% level or better, rejecting the null hypothesis of a unit root. This means that these variables are integrated of order zero, I(0). On the other hand, LGDP, LCO2, LIQ, and LIC are non-stationary at the level but become stationary after first differencing, indicating that they are integrated of order one, I(1). These findings suggest that the variables exhibit mixed stationarity, making the ARDL bounds testing approach a suitable method for analyzing long-run relationships among them.
Table 3. Unit root tests
|
VARIABLES |
ADF |
|||
|
Level |
First difference |
|||
|
Intercept |
Trend and Intercept |
Intercept |
Trend and Intercept |
|
|
LLE |
-2.920856* |
-3.817985** |
- |
- |
|
LGDP |
1.183600 |
-1.732125 |
-4.634739*** |
-5.012943*** |
|
LINQ |
-3.002459** |
-2.763216 |
- |
- |
|
LCO2 |
-1.670232 |
-1.029189 |
-3.765464*** |
-4.176928** |
|
LIQ |
-1.966131 |
-3.180645 |
-3.464102** |
-3.507664* |
|
LIC |
-1.617121 |
-2.546210 |
-6.353284*** |
-6.277164*** |
|
VARIABLES |
PP |
|||
|
Level |
First difference |
|||
|
Intercept |
Trend and Intercept |
Intercept |
Trend and Intercept |
|
|
LLE |
-3.054728** |
-3.456964* |
- |
- |
|
LGDP |
0.909421 |
-1.387117 |
-4.695795*** |
-5.012943*** |
|
LINQ |
-2.998738** |
-2.966145 |
- |
- |
|
LCO2 |
-1.750763 |
-1.190091 |
-3.732716*** |
-4.097005** |
|
LIQ |
-2.096550 |
-2.220991 |
-5.830952*** |
-5.771365*** |
|
LIC |
-1.755958 |
-2.641873 |
-6.343780*** |
-6.276000*** |
4.3 Lag selection criteria
The lag length selection criteria presented in Table 4 provide different statistical measures to determine the optimal lag order for the model, including the Likelihood Ratio (LR) test, Final Prediction Error (FPE), Akaike Information Criterion (AIC), Schwarz Criterion (SC), and Hannan-Quinn Criterion (HQ). Since the Akaike Information Criterion (AIC) is chosen as the selection criterion, the optimal lag length is determined based on the lowest AIC value. The lowest AIC value is -25.07115, which corresponds to lag 2. Therefore, based on the AIC criterion, the optimal lag length for the model is 2, meaning that two lags should be included in the econometric analysis to ensure proper model specification and capture the dynamic relationships among the variables effectively.
Table 4. Lag length selection
|
Lag |
LogL |
LR |
FPE |
AIC |
SC |
HQ |
|
0 |
290.0524 |
NA |
5.65e-15 |
-15.78069 |
-15.51677 |
-15.68857 |
|
1 |
480.1261 |
306.2298 |
1.12e-18 |
-24.34034 |
-22.49290* |
-23.69553 |
|
2 |
529.2807 |
62.80864* |
6.39e-19* |
-25.07115* |
-21.64019 |
-23.87365* |
4.4 ARDL bound test
The F-Bounds Test results in Table 5 indicate strong evidence of a long-run cointegration relationship among the variables. The computed F-statistic (15.01018) is significantly higher than the upper bound critical values at all significance levels, including the 1% level (4.15). Since the F-statistic exceeds the upper bound, the null hypothesis of no cointegration is rejected, confirming that the variables move together in the long run. This justifies the estimation of a long-run ARDL model, allowing for an analysis of both short-run and long-run relationships between the dependent and independent variables.
Table 5. F-bounds test
|
|
Bounds Test Critical Values |
||
|
F-Statistics |
Significance |
Lower bound |
Upper bound |
|
15.01018 |
10% |
2.08 |
3 |
|
5% |
2.39 |
3.38 |
|
|
2.5% |
2.7 |
3.73 |
|
|
1% |
3.06 |
4.15 |
|
4.5 Long-run and short-run estimates
The ARDL long-run coefficient estimates in Table 6 examine the impact of various factors on life expectancy (LE) in Somalia. The results show that economic growth (GDP) has a positive and significant effect (0.067522, p = 0.0163, CI: [0.016, 0.119]), indicating that higher GDP per capita contributes to improved life expectancy. This finding is consistent with Abdulrahman and Chawsheen [17], who reported that increases in per capita GDP significantly enhance life expectancy, particularly in upper-middle, lower-middle, and low-income countries, emphasizing its critical role in promoting better health in these economic contexts. Similar conclusions were drawn by researchers who also found a strong positive relationship between economic growth and life expectancy [48, 67, 68].
However, income inequality (LINQ) (-27.58248, p = 0.0257, CI: [-50.366, -4.800]) has a negative and significant impact, suggesting that greater income disparities reduce life expectancy in the long run. This finding is consistent with Sart et al. [69] who reported that income inequality negatively affects life expectancy in new EU member states. Similarly, SenGupta [11] found that income inequality has an adverse effect on life expectancy in African countries, further reinforcing the argument that economic disparities contribute to poorer health outcomes across different regions.
Carbon emissions (LCO2) (-0.176244, p = 0.0324, CI: [-0.334, -0.018]) have a negative and significant impact on life expectancy, underscoring the detrimental health effects of environmental degradation. In the context of Somalia, rapid environmental degradation, including deforestation, desertification, and pollution, has worsened air quality and increased health risks such as respiratory diseases, which contribute to lower life expectancy [70]. This finding aligns with Szymańska [71], who reported a statistically significant negative relationship between CO2 emissions and life expectancy in 27 EU countries, and Khan et al. [72], who found similar results in developing nations.
Moreover, institutional quality (LIQ) (-2.187165, p = 0.0000, CI: [-3.056, -1.318]) and internal conflict (LIC) (-0.103137, p = 0.0020, CI: [-0.164, -0.042]) show strong negative effects, indicating that weak governance and persistent instability significantly reduce life expectancy in Somalia. In Somalia, decades of political instability, armed conflict, and weak governance have severely impacted public health services, displaced millions, and hindered access to clean water and sanitation, further exacerbating health crises and lowering life expectancy [73, 74]. This finding is consistent with Omosuyi [75], who found that poor institutional quality negatively affects life expectancy in Nigeria, and Alhiraki et al. [76], who reported that internal conflicts, such as the Syrian war, have led to a dramatic rise in mortality rates, significantly reducing life expectancy.
Table 6 shows that GDP has a positive and significant impact on life expectancy (0.0675, 95% CI: [0.016, 0.119]), confirming that economic growth improves health outcomes. Income inequality has a strong negative effect (-27.582, CI: [-50.366, -4.800]), meaning higher inequality reduces life expectancy. CO₂ emissions also have a negative and significant effect (-0.176, CI: [-0.334, -0.018]), highlighting the health risks of environmental degradation. Similarly, internal conflict (-0.103, CI: [-0.164, -0.042]) and weak institutional quality (-2.187, CI: [-3.056, -1.318]) reduce life expectancy. All key variables have confidence intervals that do not cross zero, confirming the robustness of the long-run results.
Overall, the findings suggest that economic growth enhances life expectancy, whereas income inequality, environmental degradation, weak institutions, and internal conflict significantly deteriorate health outcomes in Somalia over the long run.
Table 6. ARDL long-run coefficient estimates
|
Variable |
Coefficient |
Std. Error |
t-Statistic |
Prob. |
95% Confidence Interval |
|
LGDP |
0.067522 |
0.026214 |
2.57577 |
0.0163 |
[0.013, 0.122] |
|
LINQ |
-27.58248 |
11.63103 |
-2.37146 |
0.0257 |
[-51.523, -3.641] |
|
LCO2 |
-0.176244 |
0.077776 |
-2.26605 |
0.0324 |
[-0.334, -0.018] |
|
LIQ |
-2.187165 |
0.428250 |
-5.10721 |
0.0000 |
[-3.056, -1.318] |
|
LIC |
-0.103137 |
0.029854 |
-3.45477 |
0.0020 |
[-0.164, -0.042] |
|
C |
-9.390297 |
6.622558 |
-1.41792 |
0.1686 |
[-23.020, 4.240] |
Table 7. ARDL short-run coefficient estimates
|
Variable |
Coefficient |
Std. Error |
t-Statistic |
Prob. |
95% Confidence Interval |
|
D(LLE(-1)) |
0.753200 |
0.103270 |
7.29347 |
0.0000 |
[0.543, 0.963] |
|
D(LCO2) |
-0.016045 |
0.221093 |
-0.07257 |
0.9427 |
[-0.473, 0.441] |
|
D(LCO2(-1)) |
1.396242 |
0.222512 |
6.27492 |
0.0000 |
[0.943, 1.849] |
|
D(LIC) |
0.017782 |
0.039750 |
0.44734 |
0.6585 |
[-0.064, 0.100] |
|
CointEq(-1)* |
-1.536006 |
0.134567 |
-11.414 |
0.0000 |
[-1.811, -1.261] |
The ARDL short-run coefficient estimates in Table 7 analyze the short-term dynamics influencing life expectancy (LLE) in Somalia. The lagged dependent variable D(LLE(-1)) (0.753200, p = 0.0000) is positive and highly significant, indicating a strong persistence of life expectancy over time. Carbon emissions (D(LCO2)) (-0.016045, p = 0.9427) have an insignificant effect in the short run, but the lagged carbon emissions (D(LCO2(-1))) (1.396242, p = 0.0000) are positive and significant, suggesting that the lagged CO₂ emissions in the short run may reflect the role of increased economic activities associated with higher emissions, such as energy use, construction, and manufacturing, which temporarily improve income, employment, and access to healthcare. However, the long-run negative impact confirms that these gains are unsustainable when environmental degradation persists. Internal conflict (D(LIC)) (0.017782, p = 0.6585) is statistically insignificant, indicating no immediate short-run impact on life expectancy. This finding contrasts with Li and Wen [58], who argue that intrastate conflict has a significant immediate negative effect on both male and female mortality rates, though they note that it does not have strong lingering effects. The error correction term CoinEq(-1) (-1.536006, p = 0.0000, CI: [-1.811, -1.261]) is negative, significant, and greater than one in absolute value, confirming a strong adjustment process toward the long-run equilibrium. This suggests that deviations from the long-run relationship are corrected at a fast rate of 153.6% per period, implying a stable long-run relationship where shocks to life expectancy are quickly adjusted.
4.6 Diagnostics of estimated ARDL model
The diagnostic test results in Table 8 assess the validity and reliability of the estimated ARDL model. The serial correlation test yields an F-statistic of 0.837941 with a p-value of 0.3691, indicating that the model does not suffer from autocorrelation, meaning the residuals are uncorrelated over time. The heteroskedasticity test results in an F-statistic of 1.555321 with a p-value of 0.2211, suggesting that the variance of the errors is constant, meaning there is no heteroskedasticity issue. The normality test produces a test statistic of 0.648734 with a p-value of 0.722985, showing that the residuals follow a normal distribution. Since all p-values are above the conventional significance levels (1%, 5%, and 10%), the null hypotheses of no serial correlation, homoscedasticity, and normality cannot be rejected, confirming that the model satisfies the key diagnostic checks and is robust for inference and policy analysis.
Table 8. The results of diagnostic tests
|
Diagnostic Results |
||
|
|
F-statistic |
Prob. |
|
Serial Correlation |
0.837941 |
0.3691 |
|
Heteroskedasticity |
1.555321 |
0.2211 |
|
Normality |
0.648734 |
0.722985 |
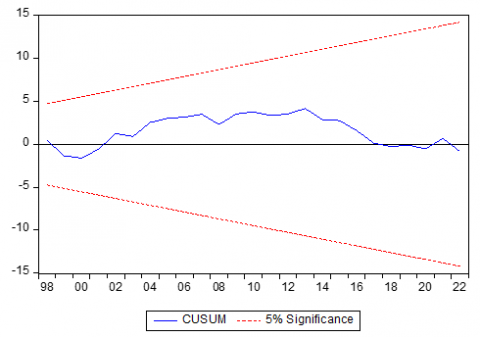
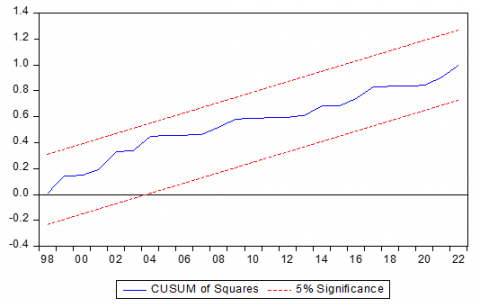
In Figure 1, the CUSUM plot shows that the blue line consistently remains within the 5% significance thresholds (red dashed lines) throughout the sample period, indicating parameter stability. Similarly, in Figure 2, the CUSUM of Squares plot indicates that the squared residuals remain below critical bounds, indicating that the ARDL model is structurally stable.
Figure 1. CUSM test
Figure 2. CUSM of square tests
4.7 VECM Granger causality robustness checking
The Johansen cointegration test results presented in Table 9 confirm the presence of a long-run relationship among the variables. Both the Trace test and Maximum Eigenvalue test indicate the rejection of the null hypothesis of no cointegration at the 1% significance level, as the trace statistic (186.4629) and max-eigen statistic (67.41757) exceed their respective critical values, with p-values of 0.0000. The tests further suggest that there are three cointegrating equations, as indicated by significant test statistics up to "at most 2", after which the null hypothesis fails to be rejected (p-values above 0.05). This implies that the variables share a stable long-run equilibrium, meaning they move together over time.
Table 9. VECM Granger causality robustness checking
|
|
Unrestricted Cointegration Rank Test (Trace) |
Unrestricted Cointegration Rank Test (Maximum Eigenvalue) |
||
|
Hypothesized No. of CE(s) |
Trace Statistic |
Prob.** |
Max-Eigen Statistic |
Prob.** |
|
None * |
186.4629 |
0.0000 |
67.41757 |
0.0000 |
|
At most 1 * |
119.0453 |
0.0000 |
61.20417 |
0.0000 |
|
At most 2 * |
57.84113 |
0.0044 |
35.78028 |
0.0036 |
|
At most 3 |
22.06085 |
0.2951 |
15.59171 |
0.2496 |
|
At most 4 |
6.469137 |
0.6400 |
6.451765 |
0.5559 |
|
At most 5 |
0.017372 |
0.8950 |
0.017372 |
0.8950 |
Life expectancy in Somalia remains critically low due to the complex interplay of economic, environmental, and political factors. This study employs the Autoregressive Distributed Lag (ARDL) model to analyze the relationship between these factors and life expectancy in Somalia from 1985 to 2022. Descriptive statistics indicate a positive correlation between GDP and life expectancy, while internal conflict and CO₂ emissions have negative effects. Unit root tests reveal a mix of stationary and non-stationary variables, justifying the use of the ARDL approach. The optimal lag length for capturing dynamic relationships is determined to be two. The ARDL bounds test confirms the existence of long-run cointegration among the variables, highlighting their sustained influence on life expectancy. Long-run estimates show that while GDP significantly increases life expectancy, income inequality, CO₂ emissions, weak institutional quality, and internal conflict reduce it. In the short run, past CO₂ emissions appear to have a positive effect on life expectancy, whereas internal conflict has no immediate impact. Diagnostic tests confirm the model’s reliability, showing no issues related to serial correlation, heteroskedasticity, or non-normality, while stability tests validate the consistency of the estimated parameters. Additionally, the VECM Granger causality test supports the presence of long-run relationships, reinforcing the idea that economic, political, and environmental factors collectively shape life expectancy trends in Somalia.
To improve life expectancy in Somalia, policymakers should prioritize inclusive economic growth by investing in healthcare infrastructure, social services, and equitable income distribution to mitigate the negative effects of income inequality. Strengthening governance and institutional quality is essential for enhancing public health services and ensuring effective policy implementation. Addressing environmental degradation through stricter regulations on CO₂ emissions, promoting renewable energy, and adopting climate adaptation strategies will help mitigate health risks associated with pollution. Furthermore, efforts to resolve conflicts and promote political stability should be reinforced to reduce the adverse impact of instability on healthcare systems and overall well-being. International partnerships should also be leveraged to support healthcare capacity building, while targeted social policies should focus on vulnerable populations to ensure equitable access to essential services.
Despite its contributions, this study has certain limitations. First, it relies on annual time-series data, which may not fully capture short-term fluctuations or seasonal variations in the determinants of life expectancy. Second, the analysis focuses on macro-level indicators such as GDP, CO₂ emissions, income inequality, and institutional quality, while micro-level factors like healthcare accessibility, dietary patterns, and disease prevalence are not explicitly considered. Additionally, while the ARDL model effectively analyzes both short-run and long-run relationships, it does not fully address potential endogeneity issues, which could affect the causal interpretations of the findings.
For future research, scholars could examine disaggregated regional data to assess variations in life expectancy across different parts of Somalia, taking rural-urban disparities into account. Expanding the scope to include healthcare system efficiency, nutritional factors, and disease prevalence could provide a more comprehensive understanding of health outcomes. Moreover, employing alternative econometric techniques, such as Structural Equation Modeling (SEM) or machine learning approaches, could enhance the robustness of the results and offer deeper insights into the complex determinants of life expectancy in Somalia.
The authors would like to thank Jamhuuriya University of Science and Technology for supporting this study.
[1] Stiperski Matoc, M., Stiperski, Z., Matoc, L., Valožić, L. (2024). Life expectancy in relation to societal development level: Significant discordant factors. Central European Journal of Public Health, 32(2): 85-94. https://doi.org/10.21101/cejph.a8162
[2] WHO. (2021). Global expenditure on health: Public spending on the rise? https://iris.who.int/bitstream/handle/10665/350560/9789240041219-eng.pdf?sequence=1.s.
[3] Wilkinson, R.G., Pickett, K.E. (2009). Income inequality and social dysfunction. Annual Review of Sociology, 35(1): 493-511. https://doi.org/10.1146/annurev-soc-070308-115926
[4] Preston, S.H. (1975). The changing relation between mortality and level of economic development. Population Studies, 29(2): 231-248. https://doi.org/10.1080/00324728.1975.10410201
[5] Lai, E.T., Chiang, T.L., Kim, C.Y., Hashimoto, H., Marmot, M., Woo, J. (2023). The determinants of longevity: The perspectives from East Asian economies. Journal of the American Geriatrics Society. https://doi.org/10.1111/jgs.18418
[6] Lelieveld, J., Klingmüller, K., Pozzer, A., Burnett, R.T., Haines, A., Ramanathan, V. (2019). Effects of fossil fuel and total anthropogenic emission removal on public health and climate. Proceedings of the National Academy of Sciences, 116(15): 7192-7197. https://doi.org/10.1073/pnas.1819989116
[7] Collier, P. (1999). On the economic consequences of civil war. Oxford Economic Papers, 51(1): 168-183. https://doi.org/10.1093/oep/51.1.168
[8] Garry, S., Checchi, F. (2020). Armed conflict and public health: Into the 21st century. Journal of Public Health, 42(3): e287-e298. https://doi.org/10.1093/pubmed/fdz095
[9] Knowles, S., Owen, P.D. (2010). Which institutions are good for your health? The deep determinants of comparative cross-country health status. The Journal of Development Studies, 46(4): 701-723. https://doi.org/10.1080/00220380903428399
[10] Warsame, A.A. (2023). Environmental pollution and life expectancy in Somalia: Do renewable energy, urbanization, and economic growth matter? Environmental Science and Pollution Research, 30(51): 110528-110538. https://doi.org/10.1007/s11356-023-30114-6
[11] SenGupta, S. (2024). Human capital impacts of income inequality: An extensive empirical analysis from the African continent. SAGE Open, 14(2): 21582440241251472. https://doi.org/10.1177/21582440241251472
[12] Rahman, M.M., Rana, R., Khanam, R. (2022). Determinants of life expectancy in most polluted countries: Exploring the effect of environmental degradation. PLoS ONE, 17(1): e0262802. https://doi.org/10.1371/journal.pone.0262802
[13] Morrison, J., Malik, S.M.M.R. (2023). Population health trends and disease profile in Somalia 1990–2019, and projection to 2030: Will the country achieve Sustainable Development Goals 2 and 3? BMC Public Health, 23(1): 66. https://doi.org/10.1186/s12889-022-14960-6
[14] Bramajo, O., Mehta, N. (2024). The role of cardiovascular mortality in life expectancy gaps after age 50 between us and other high-income countries. Innovation in Aging, 8(Supplement_1): 657-657. https://doi.org/10.1093/geroni/igae098.2148
[15] Shirai, T., Tsushita, K. (2024). Lifestyle medicine and Japan’s longevity miracle. American Journal of Lifestyle Medicine, 18(4): 598-607. https://doi.org/10.1177/15598276241234012
[16] Cheong, T.S., Wan, G., Chui, D.K.H. (2022). Unveiling the relationship between economic growth and equality for developing countries. China & World Economy, 30(5): 1-28. https://doi.org/10.1111/cwe.12435
[17] Abdulrahman, I., Chawsheen, S.A. (2024). Income-based economic determinants of life expectancy in four groups of countries classified by their levels of income. Scientific Annals of Economics and Business, 71(4): 641-662. https://doi.org/10.47743/saeb-2024-0028
[18] Agyei, E., Kumah, E. (2024). Navigating the complex terrain of healthcare systems in Sub-Saharan Africa: Challenges and opportunities for progress. Discover Health Systems, 3(1): 39. https://doi.org/10.1007/s44250-024-00108-3
[19] Odusanya, I.A., Akinlo, A.E. (2021). Income inequality and population health in sub-Saharan Africa: A test of income inequality-health hypothesis. Journal of Population and Social Studies, 29: 235-254. http://doi.org/10.25133/JPSSv292021.015
[20] Morrison, J., Malik, S.M.M.R. (2024). Health equity in Somalia? An evaluation of the progress made from 2006 to 2019 in reducing inequities in maternal and newborn health. International Journal for Equity in Health, 23(1): 46. https://doi.org/10.1186/s12939-023-02092-1
[21] Swenson, M.H., Daley, D.M. (2024). Health impacts. In Elgar Encyclopedia of Climate Policy. Edward Elgar Publishing, pp. 100-105. https://doi.org/10.4337/9781802209204.ch19
[22] Almeida, D., Carvalho, L., Ferreira, P., Dionísio, A., Haq, I.U. (2024). Global dynamics of environmental Kuznets curve: A cross-correlation analysis of income and CO2 emissions. Sustainability, 16(20): 9089. https://doi.org/10.3390/su16209089
[23] Majeed, M.T., Ozturk, I. (2020). Environmental degradation and population health outcomes: A global panel data analysis. Environmental Science and Pollution Research, 27(13): 15901-15911. https://doi.org/10.1007/s11356-020-08167-8
[24] Wang, Z., Sami, F., Khan, S., Alamri, A.M., Zaidan, A.M. (2023). Green innovation and low carbon emission in OECD economies: Sustainable energy technology role in carbon neutrality target. Sustainable Energy Technologies and Assessments, 59: 103401. https://doi.org/10.1016/j.seta.2023.103401
[25] Guo, A., Ullah, O., Zeb, A., Din, N.U., Hussain, S. (2025). Unveiling health dynamics: Exploring the impact of CO2 emissions, urbanization, and renewable energy on life expectancy and infant mortality in SAARC countries (1990–2022). Natural Resources Forum, 49(2): 1795-1822. https://doi.org/10.1111/1477-8947.12460
[26] Shaari, M.S., Majekodunmi, T.B., Sulong, A., Esquivias, M.A., Yusoff, W.S. (2024). Examining the interplay between green technology, CO2 emissions, and life expectancy in the ASEAN-5 countries: Insights from the panel FMOLS and DOLS approaches. Discover Sustainability, 5(1): 456. https://doi.org/10.1007/s43621-024-00706-4
[27] Zhang, Z., An, R., Guo, H., Yang, X. (2025). Effects of PM2.5 exposure and air temperature on risk of cardiovascular disease: Evidence from a prospective cohort study. Frontiers in Public Health, 12: 1487034. https://doi.org/10.3389/fpubh.2024.1487034
[28] Abidoye, B.O., Odusola, A.F. (2015). Climate change and economic growth in Africa: An econometric analysis. Journal of African Economies, 24(2): 277-301. https://doi.org/10.1093/jae/eju033
[29] Abbas, M., Ribeiro, P.F., Santos, J.L. (2023). Farming system change under different climate scenarios and its impact on food security: An analytical framework to inform adaptation policy in developing countries. Mitigation and Adaptation Strategies for Global Change, 28(8): 43. https://doi.org/10.1007/s11027-023-10082-5
[30] Wang, Y., Chong, K.C., Ren, C. (2024). Impact of compound warm and wet events on dengue fever infection in South and Southeast Asian countries. Environmental Research, 263: 120091. https://doi.org/10.1016/j.envres.2024.120091
[31] Akinsipe, O.D., Kammen, D.M. (2024). The African fulcrum to bend the curve of the climate crisis to a just transition. Environmental Research Communications, 6(7): 075030. https://doi.org/10.1088/2515-7620/ad61c3
[32] Kur, K.K. (2024). Does environmental degradation and renewable energy consumption influence health outcomes? Evidence from Sub-Saharan Africa. Global Journal of Emerging Market Economies, 16(3): 411-430. https://doi.org/10.1177/09749101241238288
[33] Uny, I., Chasima, T., Caes, L., Kambalame, L., Chamba, M.V., Kalumbi, L., Orina, F., Price, H., Lucas, S., Nyikuri, M., Semple, S., Meme, H. (2024). Exploring the use of solid fuels for cooking and household air pollution in informal settlements through photovoice: The fuel to pot study in Ndirande (Malawi) and Mukuru (Kenya). PLoS ONE, 19(12): e0316095. https://doi.org/10.1371/journal.pone.0316095
[34] Siraj, A.S., Santos-Vega, M., Bouma, M.J., Yadeta, D., Carrascal, D.R., Pascual, M. (2014). Altitudinal changes in malaria incidence in highlands of Ethiopia and Colombia. Science, 343(6175): 1154-1158. https://doi.org/10.1126/science.1244325
[35] Adu-Acheampong, F., Jensen, G.A. (2019). Longevity in retrospect, does conflict matter? A panel data analysis of different countries’ experiences. Journal of Economics, 7(2): 25-40. https://doi.org/10.15640/jeds.v7n2a3
[36] Plümper, T., Neumayer, E. (2006). The unequal burden of war: The effect of armed conflict on the gender gap in life expectancy. International Organization, 60(3): 723-754. https://doi.org/10.1017/S0020818306060231
[37] Athanasakis, K. (2022). 'Inclusive' health systems increases healthy life expectancy. Rural and Remote Health, 22(2): 7014. https://doi.org/10.22605/RRH7014
[38] Hale, T., Angrist, N., Goldszmidt, R., Kira, B., Petherick, A., Phillips, T., Webster, S., Cameron-Blake, E., Hallas, L., Majumdar, S., Tatlow, H. (2021). A global panel database of pandemic policies (Oxford COVID-19 Government Response Tracker). Nature Human Behaviour, 5(4): 529-538. https://doi.org/10.1038/s41562-021-01079-8
[39] Voorend, K., Abarca, D.A. (2023). Costa Rica’s social policy response to the pandemic: From potential for universalism to austerity-as-usual. Global Social Policy, 23(2): 364-368. https://doi.org/10.1177/14680181231180532
[40] Doocy, S., Page, K.R., Liu, C., Hoaglund, H., Rodríguez, D.C. (2022). Venezuela: Out of the headlines but still in crisis. Bulletin of the World Health Organization, 100(8): 466. https://doi.org/10.2471/BLT.22.288269
[41] Tarnas, M.C., Hamze, M., Tajaldin, B., Sullivan, R., Parker, D.M., Abbara, A. (2024). Exploring relationships between conflict intensity, forced displacement, and healthcare attacks: A retrospective analysis from Syria, 2016–2022. Conflict and Health, 18(1): 70. https://doi.org/10.1186/s13031-024-00630-4
[42] Olawade, D.B., Wada, O.Z., Aderinto, N., Odetayo, A., Adebisi, Y.A., Esan, D.T., Ling, J. (2025). Factors contributing to under-5 child mortality in Nigeria: A narrative review. Medicine, 104(1): e41142. https://doi.org/10.1097/MD.0000000000041142
[43] Mooketsane, K.S., Phirinyane, M.B. (2015). Health governance in sub-Saharan Africa. Global Social Policy, 15(3): 345-348. https://doi.org/10.1177/1468018115600123d
[44] Otorkpa, O.J., Yusuf, A.M., Aborode, A.T. (2024). Climate and conflict-induced child nutrition crisis in Sub-Saharan Africa. Conflict and Health, 18(1): 59. https://doi.org/10.1186/s13031-024-00621-5
[45] Warsame, A.A., Sheik-Ali, I.A., Mohamed, J., Sarkodie, S.A. (2022). Renewables and institutional quality mitigate environmental degradation in Somalia. Renewable Energy, 194: 1184-1191. https://doi.org/10.1016/j.renene.2022.05.109
[46] Iuga, I.C., Nerişanu, R.A., Iuga, H. (2024). The impact of healthcare system quality and economic factors on the older adult population: A health economics perspective. Frontiers in Public Health, 12: 1454699. https://doi.org/10.3389/fpubh.2024.1454699
[47] Chen, Z., Ma, Y., Hua, J., Wang, Y., Guo, H. (2021). Impacts from economic development and environmental factors on life expectancy: A comparative study based on data from both developed and developing countries from 2004 to 2016. International Journal of Environmental Research and Public Health, 18(16): 8559. https://doi.org/10.3390/ijerph18168559
[48] Felice, E., Andreu, J.P., D’Ippoliti, C. (2016). GDP and life expectancy in Italy and Spain over the long run: A time-series approach. Demographic Research, 35: 813-866. https://doi.org/10.4054/DemRes.2016.35.28
[49] Soriano, B., Garrido, A. (2016). How important is economic growth for reducing undernourishment in developing countries? Food Policy, 63: 87-101. https://doi.org/10.1016/j.foodpol.2016.07.004
[50] Ebenstein, A., Fan, M., Greenstone, M., He, G., Yin, P., Zhou, M. (2015). Growth, pollution, and life expectancy: China from 1991–2012. American Economic Review, 105(5): 226-231. https://doi.org/10.1257/aer.p20151094
[51] Hill, T.D., Jorgenson, A. (2018). Bring out your dead!: A study of income inequality and life expectancy in the United States, 2000–2010. Health & Place, 49: 1-6. https://doi.org/10.1016/j.healthplace.2017.11.001
[52] Mackenbach, J.P. (2002). Income inequality and population health. BMJ, 324(7328): 1. https://doi.org/10.1136/bmj.324.7328.1
[53] Hu, Y., Van Lenthe, F.J., Mackenbach, J.P. (2015). Income inequality, life expectancy and cause-specific mortality in 43 European countries, 1987–2008: A fixed effects study. European Journal of Epidemiology, 30: 615-625. https://doi.org/10.1007/s10654-015-0066-x
[54] Emodi, N.V., Inekwe, J.N., Zakari, A. (2022). Transport infrastructure, CO2 emissions, mortality, and life expectancy in the Global South. Transport Policy, 128: 243-253. https://doi.org/10.1016/j.tranpol.2022.09.025
[55] Polcyn, J., Voumik, L.C., Ridwan, M., Ray, S., Vovk, V. (2023). Evaluating the influences of health expenditure, energy consumption, and environmental pollution on life expectancy in Asia. International Journal of Environmental Research and Public Health, 20(5): 4000. https://doi.org/10.3390/ijerph20054000
[56] Azam, M., Adeleye, B.N. (2024). Impact of carbon emissions sources on life expectancy in Asia and the Pacific region. Natural Resources Forum, 48(1): 35-57. https://doi.org/10.1111/1477-8947.12303
[57] Ghobarah, H.A., Huth, P., Russett, B. (2003). Civil wars kill and maim people—Long after the shooting stops. American Political Science Review, 97(2): 189-202. https://doi.org/10.1017/S0003055403000613
[58] Li, Q., Wen, M. (2005). The immediate and lingering effects of armed conflict on adult mortality: A time-series cross-national analysis. Journal of Peace Research, 42(4): 471-492. https://doi.org/10.1177/0022343305054092
[59] Mohamed, J., Abdi, M.J., Mohamed, A.I., Muhumed, M.A., Abdeeq, B.A., Abdi, A.A., Abdilahi, M.M., Ali, D.A. (2024). Predicting the short and long term effects of food price inflation, armed conflicts, and climate variability on global acute malnutrition in Somalia. Journal of Health, Population and Nutrition, 43(1): 68. https://doi.org/10.1186/s41043-024-00557-9
[60] Kouadio, M., Njong Mom, A. (2025). Health expenditure, governance quality, and health outcomes in West African countries. The International Journal of Health Planning and Management, 40(2): 427-441. https://doi.org/10.1002/hpm.3887
[61] Sibanda, K., Qoko, A., Gonese, D. (2024). Health expenditure, institutional quality, and under-five mortality in Sub-Saharan African countries. International Journal of Environmental Research and Public Health, 21(3): 333. https://doi.org/10.3390/ijerph21030333
[62] Ibrahim, R.L., Ajide, K.B. (2021). The role of income level and institutional quality in the non-renewable energy consumption and life expectancy nexus: Evidence from selected oil‐producing economies in Africa. OPEC Energy Review, 45(3): 341-364. https://doi.org/10.1111/opec.12212
[63] Vatamanu, A.F., Onofrei, M., Cigu, E., Oprea, F. (2025). Renewable energy consumption, institutional quality and life expectancy in EU countries: A cointegration analysis. Energy, Sustainability and Society, 15(1): 2. https://doi.org/10.1186/s13705-024-00507-7
[64] Pesaran, M.H., Shin, Y., Smith, R.J. (2001). Bounds testing approaches to the analysis of level relationships. Journal of Applied Econometrics, 16(3): 289-326. https://doi.org/10.1002/jae.616
[65] Ghouse, G., Khan, S.A., Rehman, A.U., Bhatti, M.I. (2021). ARDL as an elixir approach to cure for spurious regression in nonstationary time series. Mathematics, 9(22): 2839. https://doi.org/10.3390/math9222839
[66] Natsiopoulos, K., Tzeremes, N.G. (2022). ARDL: An R package for the analysis of level relationships. Journal of Open Source Software, 7(79): 3496. https://doi.org/10.21105/joss.03496
[67] Jetter, M., Laudage, S., Stadelmann, D. (2019). The intimate link between income levels and life expectancy: Global evidence from 213 years. Social Science Quarterly, 100(4): 1387-1403. https://doi.org/10.1111/ssqu.12638
[68] Miladinov, G. (2020). Socioeconomic development and life expectancy relationship: Evidence from the EU accession candidate countries. Genus, 76(1): 2. https://doi.org/10.1186/s41118-019-0071-0
[69] Sart, G., Bayar, Y., Danilina, M. (2024). Impact of education and income inequalities on life expectancy: Insights from the new EU members. Frontiers in Public Health, 12: 1397585. https://doi.org/10.3389/fpubh.2024.1397585
[70] Diiso, A.A., Hassan, S.A., Ali, K.A. (2024). Assessing the respiratory and eye effects of biomass for healthy adult populations in Mogadishu, Somalia. International Journal of Design & Nature and Ecodynamics, 19(4): 1355-1361. https://doi.org/10.18280/ijdne.190428
[71] Szymańska, A. (2024). An empirical assessment of the relationship between life expectancy at birth and carbon dioxide emissions in 27 European Union Countries. Panoeconomicus, 72(4): 583-603. https://doi.org/10.2298/PAN220906013S
[72] Khan, F., Sarwar, G., Khan, M.A., Noor, S., Rehman, Z.U. (2025). Assessing the link between environmental quality and life expectancy in developing nations: An empirical analysis for sustainable development. International Social Science Journal, 75(256): 295-310. https://doi.org/10.1111/issj.12553
[73] Kahow, M.H., Halane, S.A., Ali, A., Shah, R. (2024). ‘Health Camp’ model: A unique approach for child vaccination in non-state armed actor controlled, inaccessible geographies in Somalia. Global Health Action, 17(1): 2391598. https://doi.org/10.1080/16549716.2024.2391598
[74] Dahir, M.Y., Hassan, M.S., Hossain, M.M. (2025). Sanitation facilities in Somali households: Evidence from a multilevel analysis of the 2020 health and demographic survey. The International Journal of Health Planning and Management, 40(3): 549-556. https://doi.org/10.1002/hpm.3899
[75] Omosuyi, O. (2023). Globalization–Health outcomes nexus and institutional intermediation in Nigeria. Journal of Economic and Administrative Sciences. https://doi.org/10.1108/JEAS-05-2023-0115
[76] Alhiraki, O.A., Fahham, O., Dubies, H.A., Abou Hatab, J., Ba'Ath, M.E. (2022). Conflict-related excess mortality and disability in Northwest Syria. BMJ Global Health, 7(5): e008624. https://doi.org/10.1136/bmjgh-2022-008624