Andi Hidayat Rizal*![]() | Elia Hunggurami
| Elia Hunggurami![]() | Andi Kumalawati
| Andi Kumalawati![]() | Raditya Rizky Arioka
| Raditya Rizky Arioka![]()
© 2025 The authors. This article is published by IIETA and is licensed under the CC BY 4.0 license (http://creativecommons.org/licenses/by/4.0/).
OPEN ACCESS
This study utilizes the value engineering (VE) methodology for constructing the 27.88 km Oepoli-Noelelo Cross-Border Postal Access Road in Kupang Regency, East Nusa Tenggara Province (NTT)—Indonesia), a road that runs between Indonesia and Timor Leste. The project has an estimated initial cost of IDR 725,935,512,000. This study aims to identify potential cost efficiencies while maintaining the required functionality and quality. The focus is on optimizing areas such as excavation and embankment (earthworks), geosynthetics, and granular pavement, as well as adjusting unit price analysis or a combination of these two approaches, to achieve the maximum overall cost reduction. The VE implementation stages include information gathering, analysis, creativity, and recommendations. Using Pareto's Law and functional analysis, the study identified three highest-cost work items: excavation and embankment, geosynthetics, and granular pavement. The findings indicate that the third alternative offers the lowest cost, resulting in construction savings of IDR 43,234,104,000—equivalent to 5.96% of the total initial design construction cost. Overall, applying value engineering to this road project yields significant savings.
access roads, border posts, cost efficiency, infrastructure, value engineering
The border region between Indonesia and Timor-Leste holds significant economic and social potential. To fully realize this potential, developing adequate access road infrastructure to the state border crossing post (SBCP) or PLBN (in Indonesia), is crucial. This infrastructure will facilitate the movement of goods, services, and people, encouraging local economic growth, improving community welfare, and strengthening bilateral relations [1, 2]. However, the development of this infrastructure often encounters substantial cost challenges, including budget constraints [3], fluctuations in material prices, and potential inefficiencies in project design and implementation [4]. Additionally, budgeting frequently prioritizes routine expenditures over infrastructure development, leading to inadequate and poor infrastructure in the country [5]. For instance, the access road project to the Oepoli–Noelelo PLBN in Kupang Regency, NTT, Indonesia, spans a total length of 27.88 km with an estimated cost of around IDR725,935,512,000, which translates to approximately IDR26 billion per kilometre. This figure is notably higher than that of national road projects in the same area, such as the 15.3 km Kupang Central Axis Road, which has a contract value of about IDR 57 billion, or roughly IDR 3.7 billion per kilometre. This cost disparity can significantly burden the Indonesian Government's State Budget (IGSB) or APBN (in Indonesia). Therefore, a systematic and innovative approach is essential to identify and implement more cost-efficient solutions without compromising quality and functionality.
One approach that can be applied to address this issue is value engineering (VE), which aims to optimize project functionality at the lowest cost without sacrificing quality and performance [6-8]. VE is a systematic approach to increasing project value by optimizing functionality and reducing costs. Although VE has become an important tool in construction and infrastructure development since World War II [9, 10], its application in road construction projects, particularly in specific sectors, has not been fully utilized to address cost overruns and quality issues [11]. Previous research indicates that some of the leading causes of the use of value engineering in construction projects include high project implementation costs, difficulty, long gaps between design and implementation, and project complexity [12]. According to Wood and Gidado [13], construction projects are often called complex projects; however, there seems to be no universally accepted definition of project complexity in the construction industry. However, the ability to measure complexity early in a project will result in a better understanding of the project [14]. Therefore, project complexity in construction will be very beneficial in managing projects successfully and reducing risks associated with complexity. In project management, complexity is recognised as one of the factors that most influence the success of any project, such as planning and controlling activities, organisation selection, identification of goals and objectives, and project outcomes [15, 16]. In addition, construction projects are no exception as many researchers have linked high levels of complexity to construction project outcomes including, but not limited to, cost overruns, delays, low quality, poor safety conditions, disputes between partners, improper risk management, low client satisfaction levels, and poor communication between stakeholders [17-21]. In addition, VE's ability to focus on project functions, harness group creativity, and generate synergies makes it superior to other cost reduction methods.
The primary objective of this study is to apply VE principles specifically and practically to the border crossing access road project between Indonesia and Timor Leste. This involves identifying and eliminating unnecessary work or components while exploring and proposing alternatives that meet project requirements at the lowest possible cost. The goal of cost optimization will be achieved without compromising—and even improving—the project's established performance and quality standards, which aligns with the core value proposition of VE. This study aims to demonstrate how a large-scale road construction project can be completed within the allocated budget by utilising a proactive and systematic approach to cost optimization. This will enhance the overall efficiency and effectiveness of critical transportation infrastructure. VE is a valuable tool for achieving significant cost savings through rigorous analysis and optimization of design parameters, material selection, and construction processes.
The novelty of this study lies in its empirical application of VE to a high-cost and strategic border infrastructure project within the Indonesian context. By applying VE across three scenarios, this research seeks to identify and eliminate unnecessary costs while exploring alternatives that fulfil project requirements at a lower cost—without sacrificing performance. A specific focus on border access road projects, which face unique cost challenges, aims to demonstrate their potential to generate savings in cost, time, and materials, ultimately improving the efficiency and effectiveness of transportation infrastructure in border regions.
2.1 Principles of VE
According to Save International 2007, VE is a comprehensive process conducted by a multidisciplinary team that aims to enhance project value by thoroughly analyzing the relationship between project functions and costs [22]. Yan [23] describes VE as a new branch of management technology that effectively reduces costs while increasing economic efficiency. Unlike other value management approaches, VE enhances value by modifying functions and costs (Function Value/Cost). The ultimate goal is to improve project functions to elevate the overall value of the construction outcomes [24]. VE applies to almost all products and projects, making it more than just a method for cost reduction.
To enhance the value of a project, VE requires a systematic approach that involves implementing a structured VE work plan [25]. It is most effective when conducted by a multidisciplinary team of professionals and subject matter experts. The key characteristics of VE include: (1) a VE work plan (also known as a 6-phase workshop) supported by a team of professionals; (2) a focus on functions; (3) an emphasis on value enhancement; and (4) cost-effectiveness. For VE to be successful, all of these components must be in place [26, 27].
VE or value analysis, primarily focuses on function analysis [28]. The main objective of value engineering is to accomplish the essential functions of a reliable product while minimizing costs. It aims to optimize the relationship between product features and costs. In this context, "function" refers to a product's characteristics that fulfil users' specific needs. "Cost" encompasses the entire life cycle cost of the product, including all development, design, manufacturing, and usage expenses. "Value" is the ratio of a product's function to the cost incurred to achieve that function. This relationship is expressed in the following Eq. (1).
$V=\frac{F}{C}$ (1)
where, $V$ = value; $F$ = function; $C$ = cost.
The relationship between function (F) and cost (C) indicates that a lower cost for optimal function enhances the overall value. VE can be defined as a systematic approach to increasing the "value" of goods, products, and services through functional analysis. VE seeks to find a balance among function, quality, and cost. The main goal of the VE approach is to promote awareness of value while improving a company's professional competence and technological excellence. Key parameters of this concept include function, quality, life cycle cost, total cost, and waste. Based on the established equation, value is directly proportional to function and inversely proportional to cost.
The core principles of VE include:
2.2 Systematic VE work plan
Successful VE implementation relies on following a systematic and organized work plan. This structured approach is essential for conducting thorough studies, encouraging creative problem-solving, and generating viable alternatives that enhance the project's overall value. According to Yadav et al. [29], the implementation of VE can be effectively guided by a work plan, which provides an organized framework for the process.
A well-defined VE work plan is crucial for a successful value management exercise. Through this plan, specific areas for value analysis can be thoroughly explored, leading to the development of innovative alternatives. The work plan should involve a multidisciplinary team with representatives from various technical fields to execute this program effectively. This collaborative approach results in a broader range of ideas, significantly impacts decision-making and cost considerations across all services, and promotes better communication among team members.
On the other hand, Mahadik [30] described the implementation of VE in a structured process known as a VE work plan. The purpose of this work plan is to assist the study team in systematically identifying and focusing on the key functions of the project in order to generate innovative ideas that can enhance overall value. A VE work plan typically consists of several interrelated phases:
2.3 Application of VE to road projects
VE is a widely recognized approach utilized across various industries, with significant application in construction and infrastructure development. It is a proactive process that analyzes project components to identify opportunities for cost reduction without compromising performance or quality. Here are some key benefits and opportunities associated with VE in road projects:
2.4 Cost analysis methods in VE
Accurate and comprehensive cost analysis is the foundation of practical VE. It empowers project teams to systematically identify cost-saving opportunities without sacrificing quality, enabling informed decisions regarding material selection, labour rates, technology adoption, and equipment utilization. This analytical rigour is crucial for minimizing financial risk, preventing cost overruns, and strategically prioritizing project elements. Some standard cost estimation methods in construction and VE include:
2.4.1 Elemental Cost Analysis (ECA)
This method involves breaking down a construction project into its fundamental constituent elements (e.g., foundations, structural framework, finishes, mechanical systems) and assigning detailed cost estimates to each. These estimates are typically derived from expert judgment, established industry standards, and historical cost data from similar projects.
2.4.2 Comparative analysis
This method estimates project costs by comparing them to similar, completed projects. The underlying principle is that projects with comparable characteristics (size, scope, complexity, type, location) will likely have similar cost profiles.
2.4.3 Parametric estimation
This data-driven approach uses statistical and historical data to establish quantitative relationships between key project parameters (e.g., linear length, complexity rating, square footage) and construction costs. This method assumes that specific project characteristics have a predictable impact on costs.
2.4.4 Life Cycle Cost Analysis (LCA)
This method evaluates the total cost of ownership of a product or service over its lifetime, including initial capital costs, ongoing operating costs, and future maintenance and disposal costs. LCA emphasizes long-term cost savings, even if they require a higher initial investment, by comparing options based on long-term performance and proven cost records.
2.4.5 Benchmarking
Involves comparing the project's cost and schedule with other similar projects or established industry standards. This method helps identify areas where the project can learn from the successes or failures of others and identifies opportunities for improving value and efficiency.
2.4.6 Actual cost
While this is the most reliable method because it relies on actual costs incurred, applying it in the early stages of a project or program is generally complex when detailed cost data is unavailable.
2.5 Comparison of equipment-based and unit-pricing VE alternatives
2.5.1 Equipment-based VE alternatives
This approach focuses on optimizing the costs associated with acquiring, operating, and maintaining construction equipment. Since heavy equipment often represents a significant capital and operational expense in road construction, this area provides substantial opportunities for value enhancement. Key cost components to consider include:
Additional factors influencing total equipment costs are internal and external labor, spare parts, and indirect ownership costs, such as management and utilities. Equipment costs are typically structured using various rate models (e.g., hourly rate, multiple hourly rates, single rate, tiered rate) to ensure accurate allocation to specific projects and cost centers.
Key value engineering opportunities in this approach include:
2.5.2 Unit-pricing-based VE alternatives
This approach focuses on optimizing the costs of individual, recurring work units within a construction project. Payment is based on the quantity of work completed, making unit pricing the primary focus for cost control. Each unit price is designed to reflect all direct and indirect costs associated with performing a specific, defined portion of the work. This typically includes the unit material cost, unit labour cost, allocated equipment cost per unit, and a portion of overhead and profit margin.
VE opportunities within this approach include:
This approach offers high flexibility for projects where final work quantities may be uncertain, simplifies contract negotiations due to straightforward pricing, and allows for cost adjustments as actual quantities become apparent during project implementation. It also facilitates direct comparison of alternatives for specific work packages. However, the disadvantages include the risk of quantity overruns if initial estimates are inaccurate, which may provide less incentive for contractors to seek overall project efficiencies beyond individual units and may lead to disputes over measurement.
3.1 Research location
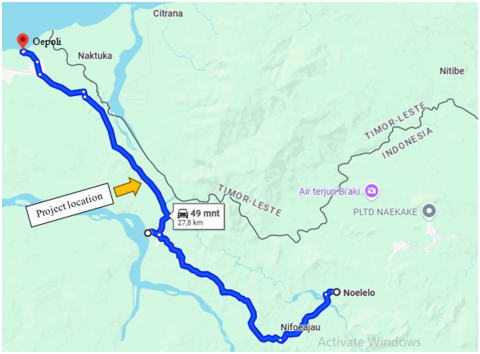
Figure 1 shows the location of the Oepoli – Noelelo PLBN Access Road Construction project in Kupang Regency, NTT, with a length of 27.88 km and a width of 6 m, and the road conditions are hilly, have many bends, steep inclines and declines, and are often cut off due to flooding in the rainy season due to the lack of permanent bridges and adequate drainage. In general, the Oepoli – Noelelo PLBN access road is a route that connects the PLBN, which borders Timor Leste, to Noelelo Village or the surrounding area in Kupang Regency, NTT-Indonesia. This road starts from the Oepoli PLBN area (coordinates -9.34368°S, 124.02966°E), a centre of border activity that is busy with cross-country activities. The other end is Noelelo Village (coordinates -9.44865°S, 124.16723°E) or the main road that connects the area with the centre of Kupang Regency or other NTT areas.
Before paving, the road consisted of rocky and dirt surfaces that were easily damaged, especially during the rainy season. The lack of permanent bridges and adequate drainage often cuts the road off and makes it difficult for vehicles to navigate, especially large or heavily loaded vehicles. The poor road conditions left the Oepoli area and its surroundings relatively isolated, hampering the distribution of goods and access to basic services for the local community.
Figure 1. Oepoli – Noelelo PLBN road section
3.2 VE methodology
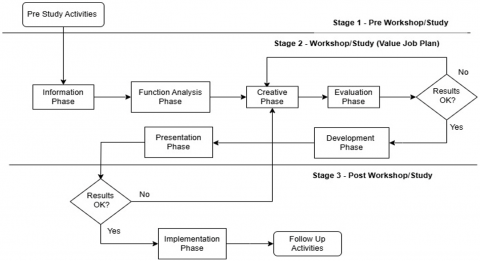
In this paper, the VE study follows a standard methodology consisting of three main stages: pre-workshop, workshop, and post-workshop, which includes six sequential phases: information, analysis, creative, evaluation, development, and presentation (Figure 2). In the case of the Oepoli-Noelelo PLBN access road construction project, the application of the VE methodology will involve the following steps:
Figure 2. Value study process flow diagram by SAVE International
3.2.1 Data collection (information phase)
3.2.2 Functional analysis (analysis phase)
3.2.3 Alternative development (creative phase)
3.2.4 Alternative evaluation (evaluation phase)
In this paper, several decision criteria for selecting the best alternative will be explored, focusing not only on cost but also on the following factors:
3.2.5 Further development (development phase)
3.2.6 Presentation of results (presentation phase)
3.3 Measuring value
"Value" in VE is generally measured as the ratio of function to cost (Value = Function/Cost). Increased value can be achieved by improving function at the same or lower cost, or by maintaining the same function at a lower cost. In this project, measuring value involves:
3.4 Pareto testing
Pareto testing is based on Pareto's Law, which determines the highest cost of the project being reviewed. The highest cost obtained from the results of this test has the potential to be analysed as VE. The steps taken include:
$\begin{aligned} & \% { Cumulative\ of\ total\ component\ cost } \\ & \qquad=\frac{{ Job \ components }}{{ Number\ of\ job\ components }}\end{aligned}$ (2)
$\begin{aligned} & \% { Cost\ of\ job\ components } \\ = & \frac{{ Job\ components }}{{ Number\ of\ job\ components }}\end{aligned}$ (3)
4.1 Information stage
At the initial stage of applying value engineering, researchers collected information related to the Oepoli – Noelelo Cross-Border Post (PLBN) Access Road Construction project through the project's technical team. The team utilized a uniform cost model to evaluate each function's cost. This approach enabled them to identify the overall project cost and the specific activities or sub-sections that were significantly impacted and provided the highest value.
The data collection conducted yielded the following information about the research project:
The project Budget Plan (BP) data is collected at this stage. From the BP, similar work items are grouped by their respective functions to facilitate analysis, resulting in a Breakdown Cost Model (BCM). Next, work items are reviewed in order of highest to lowest cost to identify the tasks with the most significant budget weight. Table 1 shows that the main activity descriptions are listed along with the total costs before applying value engineering and the percentage of each task to the total work. Table 1 clearly shows a very high concentration of cost in "Earthworks and Geosynthetics (Division 3)", which reached 85.27% of the total project cost. This proportion is highly unusual for a road project, even in challenging terrain.
Table 1. Cost model
|
Division |
Job Description |
Total Cost (IDR) |
(%) |
|
1 |
General |
1,843,272,166.67 |
0.28 |
|
2 |
Drainage |
10,904,535,908.21 |
1.65 |
|
3 |
Earthworks and geosynthetics |
562,749,563,567.89 |
85.27 |
|
4 |
Preventive widening |
- |
- |
|
5 |
Granular pavement |
34,836,778,325.33 |
5.28 |
|
6 |
Asphalt paving |
30,952,607,324.92 |
4.69 |
|
7 |
Structure |
14,660,016,229.46 |
2.22 |
|
8 |
Bridge rehabilitation |
- |
- |
|
9 |
Daily work and miscellaneous work |
3,994,601,022.97 |
0.61 |
|
10 |
Maintenance work |
- |
- |
|
|
Total cost |
659,941,374,545.46 |
100. |
|
Value added tax (10%) |
65,994,137,454.55 |
|
|
|
|
Overall Total |
725,935,512,000 |
|
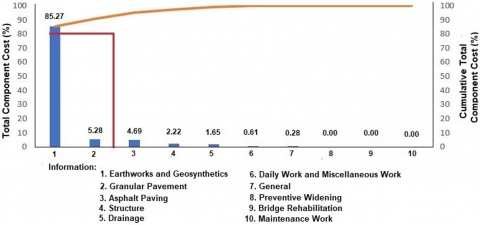
Based on Figure 3, this Pareto chart shows the total component costs (%) of several types of work, sorted from largest to smallest. This identified Pareto cost model was tested using Eqs. (1) and (2). The orange line (cumulative effect) represents the cumulative cost percentage. That is the sum of the cost percentages of the first two jobs (Earthworks and Pavement and Granular Pavement), resulting in a cumulative point on this line. Next, the blue bars represent the causes/problems, where each bar represents a type of work (e.g., Earthworks and Pavement, Granular Pavement, etc.), and its height indicates the percentage of costs incurred for that particular job.
Figure 3. Pareto chart
Based on the Pareto principle (80/20 rule), we can identify the primary problem by looking at the bars contributing approximately 80% of the total cost. In this chart, "Earthworks and Pavement" is the primary cause, contributing 85.27% of the total cost. This is the highest and most dominant bar. Other jobs, such as Granular Pavement (5.28%), Asphalt Pavement (4.69%), and so on, have much smaller cost percentages. Thus, the main priority to focus on is "Earthworks and Pavement." Significant overall cost savings will be achieved by optimizing or reducing costs on these projects. This observation strongly supports the Pareto principle in practice, suggesting that focusing VE efforts on these high-impact areas can lead to considerable savings for the overall project. Thus, the VE process becomes highly efficient by avoiding the dilution of efforts across less significant cost items.
4.2 Analysis stage
At this stage, a function analysis is performed first, where a function is defined as a system related to each other in a relationship (why-why, if-then), consisting of verbs and nouns. Next, a function analysis shows the cost/worth comparison in each work item to be reviewed. The analysis is carried out on the primary function (basic function) symbolized by the letter (B), against the supporting function (secondary function) symbolized by the letter (S). If the cost/worth ratio is > 1, it is necessary to conduct value engineering on the work item. The analysis is carried out on two divisions, namely Division 3 and Division 5, as shown in Tables 2 and 3.
Based on the functional analysis results, a cost/worth ratio greater than 1 was obtained for two reviewed items: earthworks and geosynthetics (1.001), and granular pavement work (1.224). This indicates that both work items have unnecessary costs, suggesting that further analysis is necessary [32]. Although the cost/worth ratio for earthworks and geosynthetics (Division 3) is slightly above 1, at 1.001 (as shown in Table 2), its significance is considerable. This division accounts for over 85% of the total project cost (Table 1). Even minor inefficiencies in cost components of this magnitude can result in substantial monetary waste, making it an excellent target for VE, despite the small ratio. This emphasizes that even small inefficiencies can be significant for high-cost items.
In contrast, the cost/worth ratio for granular pavement works (Division 5) is notably higher at 1.224 (as shown in Table 3). This suggests that this division has a relatively greater level of unnecessary costs per functional unit. Potential reasons for this could include material over-specification, inefficient procurement practices, or suboptimal granular layer construction methods. Therefore, this division offers considerable opportunities for VE efforts, despite its lower overall cost contribution compared to earthworks.
Table 2. Analysis of earthwork and geosynthetic functions (Division 3)
| No. |
Description |
Function (Forming the Road Body) |
Type |
Cost (in millions, IDR) |
Worth (in millions, IDR) |
|||
|
Verb |
Noun |
|||||||
|
1 |
Regular excavation |
Forming |
Road body |
B |
507,216 |
507,216 |
||
|
2 |
Rock excavation |
Forming |
Road body |
B |
48,325 |
48,325 |
||
|
3 |
Routine embankment from excavation results |
Forming |
Road body |
B |
1,025 |
1,025 |
||
|
4 |
Selected embankment from excavation sources |
Forming |
Road body |
B |
5,765 |
5,765 |
||
|
5 |
Preparation of road body |
Tidy up |
Road body |
S |
419 |
- |
||
|
Total number |
562,750 |
562,331 |
||||||
|
Cost/Worth |
1.001 |
|||||||
Table 3. Analysis of granular pavement function (Division 5)
|
No. |
Description |
Function (Road Surface Layer) |
Type |
Cost (in millions, IDR) |
Worth (in millions, IDR) |
|
|
Verb |
Noun |
|||||
|
1 |
Class A aggregate foundation layer |
Coating |
Road body |
B |
28,452 |
28,452 |
|
2 |
Class S aggregate foundation layer |
Coating |
Roadside |
S |
6,385 |
- |
|
Total number |
34,837 |
28,452 |
||||
|
Cost/Worth |
1.224 |
|||||
4.3 Creative stage
The creative stage is a phase focused on creative thinking, generating various ideas for the VE analysis. During this stage, brainstorming techniques are employed to address specific problems by gathering diverse ideas that must meet certain criteria for success. According to Kumbhar [33], Brainstorming is a creative technique aimed at generating new ideas and solving problems. While it is typically conducted in groups, it can also be done individually. Brainstorming aims to promote free thinking, allowing everyone to express their ideas without fear of judgment. This approach fosters an open and innovative environment. Based on the findings from the analysis stage, the creative stage concentrates on divisions 3 (earthworks and geosynthetics) and 5 (granular pavement work), which have the highest cost weights.
The main problems identified were earthworks and geosynthetics (regular excavation, rock excavation, embankment from excavated materials and selected embankment from excavated sources) and granular pavement works (A and S aggregate base courses). To address these problems, various alternative value engineering techniques were analyzed and quantified to achieve benefits in terms of cost reduction, quality of work, and time savings, including:
(1) Alternative I
This option involves replacing the current transportation equipment, specifically the Dump Truck (DT) with an 8-ton capacity, with a DT that has a 4-ton capacity. This change is due to the limited availability of 8-ton capacity dump trucks, making it more feasible to utilise the more widely available 4-ton capacity dump trucks in Kupang Regency. However, it is important to note that choosing the 4-ton dump truck means we will need to use twice as many units as the 8-ton dump trucks.
(2) Alternative II
This option involves modifying the analysis of unit prices for earthworks and geosynthetics (Division 3) and granular pavement work (Division 5). The adjustments were made by replacing the introductory price based on the Decree of the Governor of East Nusa Tenggara Number 42/KEP/HK/2020, which concerns the Reference Price of Non-Metallic Minerals and Rocks in East Nusa Tenggara Province for the year 2020. The price change is necessary because the introductory unit price set by the NTT Governor is lower than that of the introductory unit price from the NTT Provincial P2JN Work Unit. Therefore, utilizing the NTT Governor's unit price is more economical from a pricing standpoint. However, this alternative does not consider the cost of levies, C excavation taxes, or other factors affecting the implementation.
(3) Alternative III
This alternative proposes a combination of changes from alternatives I and II. The modifications involve replacing the transportation equipment initially planned (DT) with a capacity of 8 tons with one with a capacity of 4 tons. Additionally, we will use the introductory price established by the Decree of the Governor of East Nusa Tenggara Number 42/KEP/HK/2020, which concerns the reference price of non-metallic minerals and rocks in East Nusa Tenggara Province for the year 2020. To support the implementation of these three alternatives, an initial design of work items for Divisions 3 and 5 has been created, as illustrated in Tables 4 and 5. Furthermore, Tables 6 and 7 compare alternative work 1 and 2 price weights for Divisions 3 and 5.
Table 4. Preliminary design for earthworks and geosystems (Division 3)
|
No. |
Description (m3) |
Quantity (in millions, IDR) |
Unit Price (in millions, IDR) |
Total Price (in millions, IDR) |
|
1 |
Regular Excavation |
12,996,029 |
39,028 |
507,215 |
|
2 |
Rock Excavation |
251,006 |
194,193 |
48,744 |
|
3 |
Routine embankment from excavation results |
60,649 |
16,910 |
1,026 |
|
4 |
Selected embankment from excavation sources |
36,991 |
155,870 |
5,766 |
|
Total |
562,749 |
|||
Table 5. Preliminary design for granular pavement works (Division 5)
|
No. |
Description (m3) |
Quantity (in millions, IDR) |
Unit Price (in millions, IDR) |
Total Price (in millions, IDR) |
|
1 |
Class A aggregate foundation layer |
42,514 |
669,228 |
28,452 |
|
2 |
Class S aggregate foundation layer |
10,665 |
598,633 |
6,385 |
|
Total Price of Work |
|
34,836 |
||
Table 6. Alternative designs for earthworks and geosystems (Division 3)
|
No. |
Description (m3) |
Quantity (in millions, IDR) |
Unit Price (in millions, IDR) |
Total Price (in millions, IDR) |
||
|
Alternative I |
Alternative II |
Alternative I |
Alternative II |
|||
|
1 |
Regular Excavation |
12,996,029 |
37,43 |
39,03 |
486,467 |
507,209 |
|
2 |
Rock Excavation |
251,006 |
183,89 |
194,22 |
46,157 |
48,750 |
|
3 |
Routine embankment from excavation results |
60,649 |
16,91 |
16,906 |
1,025 |
1,025 |
|
4 |
Selected embankment from excavation sources |
36,991 |
155,85 |
45,628 |
5,765 |
1,688 |
|
Total Price of Work |
539,414 |
558,672 |
||||
Table 7. Alternative designs for granular pavement work (Division 5)
|
No. |
Description (m3) |
Quantity (in millions, IDR) |
Unit Price (in millions, IDR) |
Total Price (in millions, IDR) |
||
|
Alternative I |
Alternative II |
Alternative I |
Alternative II |
|||
|
1 |
Class A aggregate foundation layer |
42,514 |
759,973 |
429,591 |
32,309 |
18,264 |
|
2 |
Class S aggregate foundation layer |
10,665 |
907,340 |
391,000 |
9,677 |
4,170 |
|
Total Price of Work |
41,986 |
22,434 |
||||
4.4 Evaluation stage
4.4.1 Replacement of material transport equipment (8 tons to 4 tons)
The 27.88 km road construction project on the Oepoli and Neolelo PLBN sections, Kupang-NTT, was initially estimated to cost IDR 725,935,500. After engineering, which involved replacing the transport equipment from a DT with a capacity of 8 Tons to a DT with a capacity of 4 Tons in the Division 3 work, the total project cost was successfully reduced from IDR 562,749,563 to IDR 539,414,210. Table 8 shows a comparison of costs before and after VE, with the details of the revised project costs being:
The cost reduction was mainly attributed to significant declines in earthworks and geosynthetics costs, which were partially offset by a rise in granular pavement costs. Smaller trucks provided operational advantages in this specific project context, contributing to the overall cost savings. Nevertheless, the increase of 20.52% in granular pavement costs (as shown in Table 9) raises important considerations regarding equipment optimization. This suggests that 4-ton trucks are more efficient for earthworks due to their manoeuvrability in challenging terrains. However, they are less cost-effective for transporting granular pavement materials because more trips are needed to transport the same volume. This situation underscores that the selection of optimal equipment is highly dependent on the context and requires a comprehensive analysis at the project level to ensure that optimizing one area does not lead to inefficiencies in another.
Table 8. Comparison of costs before and after VE
|
No. |
Cost Components |
Initial Fee (in millions, IDR) |
Revision Fee (in millions, IDR) |
Absolute Change (in millions, IDR) |
Percentage Change (%) |
|
1 |
Earthworks and geosynthetics |
562,749,563 |
539,414,210 |
-23,335,390 |
-4.15 |
|
2 |
Granular pavement |
34,836,778 |
41,986,700 |
+7,150,900 |
+20.52 |
|
3 |
Other jobs (Divisions 1, 2, 4, 6, 7, 8, 9, and 10) |
62,355,033 |
62,355,033 |
0 |
0 |
|
4 |
Value added tax (10%) |
65,994,137 |
64,375,594 |
-1,618,543 |
-2.45 |
|
Total Project Cost |
725,935,512 |
708,131,537 |
-17,803,960 |
-2.45 |
|
Table 9. Comparison of project costs before and after changes in unit prices
|
No. |
Cost Components |
Initial Fee (in million, IDR) |
Revision Fee (in million, IDR) |
Absolute Change (in million, IDR) |
Percentage Change (%) |
|
1 |
Earthworks and geosynthetics |
562,749,563 |
558,672,410 |
-4.077.190 |
-0.72 |
|
2 |
Granular pavement |
34,836,778 |
22,434,170 |
-12.402.630 |
-35.6 |
|
3 |
Other jobs (Divisions 1, 2, 4, 6, 7, 8, 9, and 10) |
62,355,033 |
62,355,033 |
0 |
0 |
|
4 |
Value added tax (10%) |
65,994,137 |
64,346,161 |
-1,647,976 |
-2.49 |
|
Total Project Cost |
725,935,512 |
707,807,774 |
-18.127.730 |
-2.5 |
|
4.4.2 Changes in unit price of work
In the Oepoli–Neolelo PLBN project context, a key value engineering element was the revision of the basic unit prices for materials. The NTT Governor's Decree on benchmark prices for minerals and rocks introduced lower official reference prices for materials such as sand, gravel, and geosynthetics. These prices were established in contrast to previous cost calculations that relied on contractor figures or outdated NTT Provincial P2JN Working Unit estimates. The new unit prices, based on the most recent benchmark (NTT Governor's Decree No. 42/KEP/HK/2020), resulted in savings of approximately IDR 18,127,738,000 from the initial budget, with a total difference of IDR 725,935,512,000 – IDR 707,807,774,000.
The most significant savings were in granular pavement, amounting to approximately IDR 12.4 billion, followed by additional savings in earthworks and geosynthetics, totalling around IDR 4.1 billion. This aligns with the general principle that "total cost = unit price × volume," where a decrease in unit price directly reduces total costs proportionally to the quantity of work.
4.5 Development stage
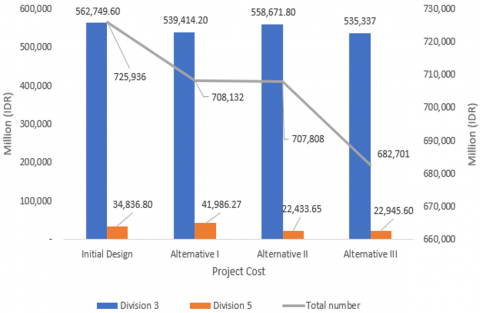
The study results indicate that Alternative I, which involves replacing the transport equipment from a capacity of 8 tons to a capacity of 4 tons, offers a more favourable option compared to the initial design. This change results in a cost reduction of IDR 708,131,537. Similarly, Alternative II, which entails a minor adjustment in labour costs, leads to a total cost decrease of IDR 707,807,740. When comparing the initial design cost of IDR 725,935,500 with these two alternatives, we see a cost reduction of approximately 2.45% for Alternative I and 2.49% for Alternative II. As a result, the development stage also includes the creation of Alternative III, which combines the features of Alternatives I and II, as illustrated in Figure 4. Alternative III significantly reduces project costs of IDR 682,701,410, resulting in savings of IDR 43,234,090, or about 5.96%.
The impressive performance of Alternative III, which achieved savings of 5.96%, results from operational changes (such as the use of dump trucks) and financial adjustments (like unit price modifications). This outcome highlights a fundamental principle of Value Engineering: synergy. It shows that making isolated improvements may only lead to limited results. In contrast, taking a comprehensive approach that targets multiple cost drivers and leverages various opportunities—such as enhancing equipment efficiency and optimizing procurement—can generate significantly greater value. This demonstrates that the cost inefficiencies within the project require a multifaceted Value Engineering solution.
Figure 4. Comparison chart of alternative VE uses
4.6 Recommendation/presentation stage
After analyzing the various alternative ideas, the final stage of value engineering is the recommendation stage. During this stage, recommendations are made based on the results of the analysis. These recommendations serve as input for making cost-saving decisions in the Oepoli – Noelelo PLBN Access Road Construction project. It has been identified that the work elements with the highest potential costs in the Oepoli – Noelelo PLBN Access Road Construction package are earthworks, geosynthetics, and granular pavement work. Additionally, alternatives and innovations have been identified from applying value engineering in the construction package for the Oepoli – Noelelo PLBN section, as illustrated in Table 10.
Table 10. Recapitulation of comparison of access road construction projects before and after value engineering
|
Division |
Job Description |
Initial Design Cost (in million, IDR) |
Alternative I (in million, IDR) |
Alternative II (in million, IDR) |
Alternative III (in million, IDR) |
|
|
General |
1,843.3 |
1,843.3 |
1,843.3 |
1,843.3 |
|
|
Drainage |
10,904.5 |
10,904.5 |
10,904.5 |
10,904.5 |
|
|
Earthworks and geosynthetics |
562,749.6 |
539,414.2 |
558,672.4 |
535,337.0 |
|
|
Preventive widening |
- |
- |
- |
- |
|
|
Granular pavement |
34,836.8 |
41,986.7 |
22,434.2 |
22,945.6 |
|
|
Asphalt paving |
30,952.6 |
30,952.6 |
30,952.6 |
30,952.6 |
|
|
Structure |
14,660.0 |
14,660.0 |
14,660.0 |
14,660.0 |
|
|
Bridge rehabilitation |
- |
- |
- |
- |
|
|
Daily work and miscellaneous work |
3,994.6 |
3,994.6 |
3,994.6 |
3,994.6 |
|
|
Maintenance work |
- |
- |
- |
- |
|
|
Total cost |
659,941.4 |
643,755.9 |
643,461.6 |
620,637.6 |
|
|
Value added tax (10%) |
65,994.1 |
64,375.6 |
64,346.2 |
62,063.8 |
|
|
Overall Total |
725,935.5 |
708,131.5 |
707,807.8 |
682,701.4 |
Effective VE begins with identifying critical success factors (CSFs) early. Lin and Lin [34] investigated the theory that identifying CSFs early is key to conducting a VE study. VE implementation involves the client and a cross-disciplinary team of experts to create a project plan that fulfils all required functions at the lowest possible cost. The involved parties are responsible for designing solutions to achieve the same or better project performance at a lower total cost [35].
The challenges of financing large and complex infrastructure are highlighted in this 27.88 km PLBN access road construction project, funded directly by the government through the Indonesian Ministry of Public Works and Public Housing. However, according to Soleymani et al. [36], the increasing need to build and manage infrastructure projects is always a significant challenge, along with a lack of funds to realize them. Therefore, infrastructure project financing is unique in size, complexity, and high investment costs, making financing this project costly.
One key finding is the efficiency of using 4-ton trucks for earthworks with short haul distances and complex site conditions. Medium-sized trucks are more productive, faster, and agile for shorter haul distances [37]. The improved manoeuvrability of 4-ton trucks can speed up work cycles, especially in confined areas or with many turns, and reduce the overall earthwork time. Furthermore, smaller trucks are easier to operate on uneven or muddy terrain, increasing efficiency and reducing the risk of delays. Smaller trucks also have lower purchase and rental prices, resulting in significant cost savings in this project. While the operating cost per trip may be slightly lower for smaller trucks, increased trip frequency can lead to higher transportation costs for these materials. Dobromirov et al. [38] indirectly supports this by showing that operations with smaller trucks can have higher costs.
The total project cost decreased by Rp17,803,960, primarily due to reduced costs for earthworks and geosynthetics. This is due to a combination of potentially lower operating costs per unit of work for a 4-ton truck and increased earthwork efficiency due to better manoeuvrability. However, there is an increase in granular pavement costs from Rp34,836,800 to Rp41,986,700. Although the volume of granular pavement material is the same, using a 4-ton truck requires twice the number of trips compared to an 8-ton truck. This increased trip frequency can lead to higher overall transportation costs for this material, indirectly supported by the fact that operations with smaller trucks can have higher costs.
Another approach in this study involved adjusting material unit prices based on the latest regulations, resulting in direct cost savings through work volume efficiencies. VE has been shown to reduce costs while maintaining project quality standards [39] and achieving essential project functions at the lowest cost [40]. VE implementation also supports sustainable infrastructure by optimizing resource use and controlling long-term costs. Therefore, VE is highly relevant in modern road project management because it prioritizes value and sustainability without sacrificing final road quality.
Additionally, Alternative III was selected as the optimal solution due to its 5.96% cost savings and several strategic reasons, including: local equipment availability, operational flexibility, minimal increase in technical and quality risks, and reduced risk of project delays due to equipment breakdowns. The availability of local equipment, related to replacing 8-ton dump trucks with 4-ton trucks, is highly feasible due to the greater availability of 4-ton trucks in Kupang Regency, reducing dependence on mobilizing heavy equipment from outside the region and supporting the local economy. Smaller dump trucks more easily handle operational flexibility related to winding and muddy road conditions, increasing work cycle efficiency and reducing downtime.
On the other hand, the change in unit prices based on NTT Governor Decree No. 42/KEP/HK/2020 provides a strong and transparent legal basis for adjusting material costs, supported by official and up-to-date market price data. However, Alternative III does not change the technical specifications of the materials or the essential road structure design. Savings are achieved through logistics optimization and unit price adjustments, rather than by substituting lower-quality materials, thus maintaining the quality and durability of the road. Essentially, utilising more common means of transportation in the region and unit material prices relevant to the local market creates a more sustainable ecosystem, potentially reducing long-term operational and maintenance costs. Therefore, Alternative III, which combines logistics optimization and unit price adjustments, is a more practical, lower-risk solution that provides sustainable added value for the project and communities in the border region.
This study successfully applied a VE approach to reduce the Indonesia-Timor Leste Border Post Access Road construction costs in Oepoli-Noelelo. Through a systematic VE methodology, including Pareto analysis, earthworks and geosynthetics, as well as granular pavement, were identified as high-cost items with potential savings. Three alternatives were developed: replacing the hauling equipment from 8-ton DT to 4-ton DT, changing the unit price of work based on the latest regulations, and a combination of both. The optimality of Alternative III lies not only in its cost savings but also in its high feasibility due to the availability of local equipment and regulatory support, minimal increase in technical risks, and potential long-term value through operational efficiency and better budget management. The application of VE was proven to significantly reduce project costs without sacrificing quality and functionality, confirming its crucial role in optimizing infrastructure projects amidst budget constraints and complexity.
|
BP |
budget plan |
|
BCM |
breakdown cost model |
|
DED |
detailed engineering designs |
|
DT |
dump truck |
|
EE |
engineer estimates |
|
FAST |
function analysis system technique |
|
IDR |
Indonesian rupiah |
|
RI |
republic of Indonesia |
|
SBCP |
state border crossing post |
|
OE |
owner estimates |
|
VE |
value engineering VE |
[1] Metherall, N., Fretes, D.R.D., Mandibondibo, F., Caucau, T. (2022). Assessing the development impact of the Sota border post connecting Indonesia and Papua New Guinea. Papua Journal of Diplomacy and International Relations, 2(2): 95-122. https://doi.org/10.31957/pjdir.v2i2.2209
[2] Siregar, R.A.H., Nugroho, L. (2023). Assessment of economic and social conditions of the community: Before and after the Jagoi Babang state cross border post, West Kalimantan, Indonesia. Proceeding International Seminar Business, Economy Social Science Technology, 3(1):176-183. https://doi.org/10.33830/isbest.v3i1.1332
[3] Jagadeeswar, Y. (2015). Issues, challenges and opportunities of infrastructure development in India. International Journal of Management and Social Science Research Review, 1(7): 30-36. https://www.academia.edu/113973241/Issues_Challenges_and_Opportunities_of_Infrastructure_Development_in_India.
[4] Olatunji, O.A., Orundami, A.O., Ogundare, O. (2018). Causal relationship between material price fluctuation and project’s outturn costs. Built Environment Project and Asset Management, 8(4): 358-371. https://doi.org/10.1108/BEPAM-12-2017-0119
[5] Okpalaoka, C. (2021). Infrastructural challenges in Nigeria and the effect on the Nigerians economy: A review of literature. Environmental and Earth Sciences Research Journal, 8(4): 159-162. https://doi.org/10.18280/eesrj.080403
[6] Ilayaraja, K., Zafar Eqyaabal, M. (2015). Value engineering in construction. Indian Journal of Science and Technology, 8(32): 3-10. https://doi.org/10.17485/ijst/2015/v8i32/87285
[7] Rane, N.L. (2016). Application of value engineering techniques in construction projects, International Journal of Engineering Sciences & Research Technology, 5(7): 1409-1415. https://doi.org/10.5281/zenodo.58597
[8] Sharma, P., Srikonda, R. (2021). Application of value engineering in affordable housing in India. International Journal of Engineering Technologies and Management Research, 8(2): 29-40. https://doi.org/10.29121/ijetmr.v8.i2.2021.865
[9] Chen, W.T., Merrett, H.C., Liu, S,S., Fauzia, N., Liem, F.N. (2022). A decade of value engineering in construction projects. Advances in Civil Engineering, 1-13. https://doi.org/10.1155/2022/2324277
[10] Younis Elfargani, M.S. (2023). Value engineering techniques and its application in construction projects. Journal of Engineering and Applied Sciences Technology, 5(3): 1-6. https://doi.org/10.47363/jeast/2023(5)171
[11] Gohar, H. (2025). Value engineering in infrastructure projects leveraging asphalt recycling for cost efficiency and sustainability. International Journal of Scientific and Research Publications, 15(4): 124-132. https://doi.org/10.29322/IJSRP.15.04.2025.p16015
[12] Miladi Rad, K., Aminoroayaie Yamini, O. (2016). The methodology of using value engineering in construction projects management. Civil Engineering Journal, 2(6): 262-269. https://doi.org/10.28991/cej-030986
[13] Wood, H., Gidado, K. (2008). Project complexity in construction. COBRA 2008, 1-13.
[14] Damayanti, R.W., Hartono, B., Wijaya, A.R. (2021). Clarifying megaproject complexity in developing countries: A literature review and conceptual study. International Journal of Engineering Business Management, 13. https://doi.org/10.1177/18479790211027414
[15] Cristóbal, J.R.S. (2017). Complexity in project management. Procedia Computer Science, 121: 762-766. https://doi.org/10.1016/j.procs.2017.11.098
[16] Lafhaj, Z., Rebai, S., AlBalkhy, W., Hamdi, O., Mossman, A., Alves Da Costa, A. (2024). Complexity in construction projects: A literature review. Buildings, 14(3): 680. https://doi.org/10.3390/buildings14030680
[17] Ma, L., Fu, H. (2020). Exploring the influence of project complexity on the mega construction project success: A qualitative comparative analysis (QCA) method. Engineering, Construction and Architectural Management, 27(9): 2429-2449. https://doi.org/10.1108/ECAM-12-2019-0679
[18] Tafesse, S. (2021). A review on the critical factors causing delay of delivery time in construction projects, International Journal of Engineering Technologies, 6(4): 69-81. https://doi.org/10.19072/ijet.815025
[19] Albtoush, A.M.F., Doh, S.I., Rahman, R.A., Al-Momani, A.H. (2022). Critical success factors of construction projects in Jordan: An empirical investigation. Asian Journal Civil Engineering, 23(7): 1087-1099. https://doi.org/10.1007/s42107-022-00470-8
[20] Trinh, M.T., Feng, Y. (2020). Impact of project complexity on construction safety performance: Moderating role of resilient safety culture. Journal Construction Engineering Management, 146(2): 04019103. https://doi.org/10.1061/(asce)co.1943-7862.0001758
[21] Nguyen, L.D., Le-Hoai, L., Tran, D.Q., Dang, C.N., Nguyen, C.V. (2019). Effect of project complexity on cost and schedule performance in transportation projects. Construction Management Economics, 37(7): 384-399. https://doi.org/10.1080/01446193.2018.1532592
[22] SAVE International Value Standard. (2007). Value methodology standard and body of knowledge. https://www.academia.edu/5624796/VM_Standards.
[23] Yan, L. (2012). Value engineering application in construction project management. In 2012 International Conference on Industrial Control and Electronics Engineering, Xi'an, China, pp. 1265-1268. https://doi.org/10.1109/ICICEE.2012.336
[24] Adnan, T.M., Hasan, S., Rahman, M.S., Das, A. (2018). An analytical way to reduce cost of a product through value engineering employment (case study: Walton). International Journal of Scientific Engineering and Research, 9(2): 527-533.
[25] Chen, W.T., Liao, S.L. (2010). A job-plan based performance evaluation for construction value engineering study. Journal of the Chinese Institute of Engineers 33(2): 317-333. https://doi.org/10.1080/02533839.2010.9671620
[26] Tanko, B.L., Abdullah, F., Mohamad Ramly, Z., Enegbuma, W.I. (2018). An implementation framework of value management in the Nigerian construction industry. Built Environment Project and Asset Management, 8(3): 305-319. https://doi.org/10.1108/BEPAM-09-2017-0078
[27] Abdelghany, M., Rachwan, R., Abotaleb, I., Albughdadi, A. (2015). Value engineering applications to improve value in residential projects. In Proceedings, Annual Conference–Canadian Society for Civil Engineering, pp. 27-30.
[28] Xu, B. (2009). Application research on the investment control of construction project with value engineering at design stage. In 2009 International Conference on Information Management, Innovation Management and Industrial Engineering, Xi'an, China, 3: 411-414. https://doi.org/10.1109/ICIII.2009.408
[29] Yadav, N.B., Kacha, R., Sharma, N.D., Rathod, H.A. (2013). A review on value engineering techniques in Indian context. International Journal of Civil, Structural, Environmental and Infrastructure Engineering Research and Development, 3(5): 1-8.
[30] Mahadik, U.A. (2015). Value engineering for cost reduction and sustainability in construction projects. IOSR Journal of Mechanical and Civil Engineering, 1(1): 95-97.
[31] Bytheway, C.W. (2007). FAST Creativity and Innovation: Rapidly Improving Processes, Product Development and Solving Complex Problems. J. Ross Publishing.
[32] Hendriks, F., Vogtländer, J.G., Janssen, G.M.T. (2006). The eco-costs/value ratio: A tool to determine the long-term strategy for delinking economy and environmental ecology. International Journal Ecodynamics, 1(2): 136-148. https://doi.org/10.2495/ECO-V1-N2-136-148
[33] Kumbhar, K.N. (2018). Brainstorming technique: Innovative quality management tool for library. Current Trends in Library Management, 1-2.
[34] Lin, Y.C., Lin, L.K. (2006). Critical success factors for knowledge management studies in construction. In 2006 Proceedings of the 23rd ISARC, Tokyo, Japan, pp. 768-772. https://doi.org/10.22260/ISARC2006/0142
[35] Leung, M.Y., Ng, S.T., Cheung, S.O. (2002). Improving satisfaction through conflict stimulation and resolution in value management in construction projects. Journal of Management in Engineering, 18(2): 68-75. https://doi.org/10.1061/(asce)0742-597x(2002)18:2(68)
[36] Soleymani, H., Ravanshadnia, M., Montazer, M. (2021). Transportation infrastructure project financing; highways capital structure design techniques. Shock and Vibration, 2021(1): 4988577. https://doi.org/10.1155/2021/4988577
[37] Song, S., Marks, E., Pradhananga, N. (2017). Impact variables of dump truck cycle time for heavy excavation construction projects. Journal of Construction Engineering and Project Management, 7(2): 11-18. https://doi.org/10.6106/JCEPM.2017.7.2.011
[38] Dobromirov, V., Meike, U., Evtiukov, S., Bardyshev, O. (2020). Safety of transporting granular road construction materials in urban environment. Transportation Research Procedia, 50: 86-95. https://doi.org/10.1016/j.trpro.2020.10.011
[39] Ismaeil, E.M. (2024). Sustainability-based value engineering management as an integrated approach to construction projects. Buildings, 14(4): 903. https://doi.org/10.3390/buildings14040903
[40] Wao, J., Mqsi, S. (2015). A review of the value engineering methodology: Limitations and solutions for sustainable construction. In 55th SAVE International Annual Conference: SAVE Value Summit, pp. 7-9.