S. Ramkumar*![]() | Martin Joel Rathnam
| Martin Joel Rathnam![]() | K. Aanandha Saravanan
| K. Aanandha Saravanan![]() | T. Nivethitha
| T. Nivethitha![]()
© 2025 The authors. This article is published by IIETA and is licensed under the CC BY 4.0 license (http://creativecommons.org/licenses/by/4.0/).
OPEN ACCESS
The failure of the sinoatrial (SA) node has been responsible for nearly 2% of deaths in the Indian population that occur without timely medical attention. Action potentials (APs) are generated by the coordinated activity of several hundred thousand tiny, resistively linked cells in the SA node, which is known as the rhythm generator or natural pacemaker of the mammalian heart. This article aims to investigate the variations in the forward and backward sodium currents in sinoatrial node cells of rabbits that affect the generation of action potentials. Specifically, it seeks to understand how reductions in hyperpolarization-activated Na⁺ currents affect the natural pacemaker’s ability to initiate action potentials, and by extension, contribute to cardiac disorders. Sinoatrial node cells from rabbit hearts were modeled as electrically connected (i.e., resistively linked) networks of several hundred thousand cells. A voltage clamp setup was used to vary the conductance of both forward (inward) and backward/outward hyperpolarization-activated sodium currents (gFNa⁺). Threshold values for these currents were determined by observing whether an action potential (AP) could be generated at different conductance levels. When the conductance gFNa⁺ dropped below a threshold value of 0.000134, no action potentials were recorded. At subthreshold levels, the sodium current induced in the cells was insufficient to trigger the opening of potassium channels, thereby preventing depolarization beyond the initial resting state. Reductions in the hyperpolarization-activated sodium currents (both forward and backward components) can abolish AP conduction initiated from the SA node in the heart. This threshold-dependent failure highlights a mechanistic basis for natural pacemaker dysfunction and may contribute to cardiac disorders such as bradyarrhythmias, tachyarrhythmias, and tachybrady syndrome, which are associated with reduced Na⁺ current flow.
action-potential, sinoatrial-node, hyper-polarization, forward-currents, backward-currents
The portion of the heart's intrinsic conduction system called the sinoatrial (SA) node is responsible for starting the heart's electrical impulses [1]. During an electrical impulse, a cell's membrane potential rapidly rises and falls in a brief process known as the action potential (AP) [1]. All kinds of living things exhibit this AP. Different AP values can be seen depending on how they are metabolized. The heart has a few excitable cells, namely neurons, endocrine cells, and muscle cells, that produce action potentials [2]. This is a signal that spreads among neurons in order to convey information. In neurons, APs are in charge of neural transmission. The action potentials of the heart are not activated by brain activity, in contrast to those in skeletal muscle cells. A deviation in voltage ion channels across the heart cells' cell membranes is known as the cardiac action potential [3]. It develops as a result of a specific subset of cells that automatically produce action potentials and these membrane cells are referred to as SA. Cells, and these cells are located in the right atrium of the heart, are also known as the natural pacemaker of the heart [4]. The SA node, which houses several million resistively coupled cells, is the primary pacemaker of the mammalian heart. Heart contraction is brought about by the electrical impulses (action potentials) that are produced by the SA node cells [5]. These action potentials are carried over to the various nodes of the heart, and the nodes are sinoatrial, atrial, ventricular, Purkinje fiber, and atrioventricular [6].
The limitation in the existing survey is that the action potential restrictions were premeditated, as stated in references [7]. This manuscript considers various parameters for analyzing APs between forward and backward sodium currents, such as the action potential interval, the slope of the depolarization phase, the peak potential, the threshold potential, and the peak US (upstroke) velocity, also referred to as the first derivative of the action potential with respect to time [8]. To monitor cell membrane capacitance, brief voltage steps of nearly ±10 mV with a momentary time of 10 mS were applied from -35 mV, which is considered as a holding potential [9]. In the theoretical concept the action potential threshold values may slightly vary from the practical values [10]
1.1 Pacemaker current
The natural pacemaker for the heart, the SA node, produces the current impulse necessary for the heart to contract regularly and rhythmically. The spontaneous diastolic depolarization that pushes the cell in the direction of the AP threshold provides the foundation for the intrinsic pacemaker electric activity, also known as spontaneous electrical activity, of a pacemaker cell [11]. A tiny net inward current, with an amplitude of only a few picoamperes, is present across the cell membrane during this diastolic depolarization phase [12]. This net inward current is the result of a complex interaction between the quantity of inward and outward ion currents, including a mixed-ionic hyperpolarization-activated current. According to research on the topic, almost all of which involved cells taken from rabbit hearts [13].
1.2 Electrical conduction pathways
SA node: The SA node, which is located in the posterior wall of the right atrium, produces electrical stimuli consistently and sustains the rhythmicity and activity of the heart. It has intermodal paths connecting it to the AV node, and it is in charge of the onset of atrial activity [14].
AV node: The AV node is located in the heart's right atrium compartment. After receiving an impulse from the SA node, an atrial contraction originates, resulting in a delay of about 100 mS at the AV node [14, 15].
Bundle of His: Impulses from the septum-based AV bundle are sent to the left and right bundle branches, which then proceed to the right ventricle's purkinje fibers and papillary muscles. The right ventricle depolarizes as a result of the right bundle branch (RBB). The interventricular septum and left ventricle (LV) are depolarized by the left bundle branch (LBB). The purkinje fibers, which are millions of microscopic fibers that run throughout the myocardiocytes, are where the bundle branches end.
Purkinje fibers: Their function in the ventricles' distribution of impulses is essential. The activity takes place at the conclusion of the atria's contraction and the beginning of the ventricles' contraction. The Purkinje fiber, the atrial wall, the atrioventricular node, and the ventricular wall are the routes taken by the action potential when it leaves the sinoatrial node [16]. The total of all action potentials is known as an electrocardiogram [17]. The difference in AP activity shows the difference in the parts of the cell. The many ionic currents that are present in the cell and the ion exchange that occurs in the membrane of the cell produce the action potential. Leakage current, potassium current, and sodium current are the three ionic currents identified by Hodgkin and Huxley. The driving force of conductance determines the travel of each ionic current.
The enclosing and closing movements of the ionic gates lead to the ionic exchanges in the cell membrane. The three action potential phases provide a quick explanation of this condition. Phase 0 denotes the fast depolarization phase during which potassium ions (K+) leak out of the cell and sodium ions (Na+) flood in and potassium channels open during repolarization, which is associated with phase 3, and there is a quick leakage of K+ from the cell membrane. This leads to Phase 4, the depolarization phase, where the Na+ ions rush out of the cell and the voltage gate of K+ channels close. In the end, this condition restores the initial state of the cell. Hence, due to this, a sequence of action potentials is generated (Figure 1).
Figure 1. Activation of action potential due to channel effect
The rabbit heart's myofibrillar myosin protein pool, which has a sarcomeric protein composition more similar to that of the human heart, is 80% composed of the β-MyHC protein [18]. Because of this, the myofibers that were isolated from the rabbit heart had biophysical and biochemical properties that were remarkably similar to human heart muscle. Clarifying the role of the sodium-calcium exchanger current INaCa in regulating action potential dynamics, especially the plateau and repolarization phases, is made possible by cardiac electrophysiological models of the human heart, particularly those that depict atrial and ventricular myocytes. Conversely, rabbit hearts, especially the sinoatrial node, are commonly employed as experimental models due to their physiological accessibility and intrinsically higher pacing rates [18]. In rabbit SA node cells, INaCa exhibits a more prominent functional role, contributing critically to diastolic depolarization and the maintenance of pacemaker activity [19]. The forward and backward hyperpolarization-activated sodium currents play distinct, threshold-dependent roles in initiating rhythmic action potentials [20]. A reduction of current below its critical amplitude results in the failure to generate action potentials.
Recent advances in computational and experimental cardiac electrophysiology have led to a deeper understanding of pacemaker mechanisms through diverse modeling approaches. Several studies have compared six distinct ionic models using differential equations to evaluate their influence on AP dynamics, particularly by eliminating potassium and sodium conductances to isolate their individual contributions. These analyses emphasized mathematical consistency but often lacked physiological validation [21]. A large-scale electrophysiological study involving over 5,000 cells from the central sinoatrial node (SAN) further provided morphological insights and quantified the distribution of gap junctions, which are critical for directional impulse propagation [21]. Further modeling incorporated Na⁺/Ca²⁺ exchangers, Na⁺/K⁺ ATPase, and Ca²⁺ pumps to simulate pacemaker cell behavior in rabbits, closely fitting voltage-clamp and AP recordings [22]. Though robust, this rabbit-centric focus may limit translational relevance to human SAN physiology [23, 24]. Another study analyzed membrane current dynamics during diastolic depolarization, correlating voltage steps with I–V curves to define phase-specific current behavior [25, 26]. The McAllister-Noble-Tsien (MNT) model of Purkinje fibers also contributed by illustrating the dynamics of free-running pacemaker rhythms and responses to external current stimuli [27, 28]. Classical ion substitution experiments established that resting membrane potential is primarily determined by K⁺ permeability, whereas transient Na⁺ influx drives rapid depolarization during the AP upstroke [29]. Integration of computational tools with biological databases has further enabled advanced simulations capable of generating hypotheses and guiding experimental design [30]. More recent models have incorporated up to 15 ionic currents, reproducing human SAN-like action potentials with firing rates around 71.8 bpm, closely mirroring physiological heart rhythms [30]. Other investigations explored non-ohmic starting currents, Na⁺ channel dynamics encoded by the SCN5A gene, and species-specific differences in If and IK1 currents [31]. The role of G protein-coupled receptors in regulating SAN ionic currents has also been well established in numerical simulations [32]. Notably, the Isoproterenol's (ISO) influence on cardiac pacing has been mathematically reproduced in SAN cells, showing its modulatory action across multiple ionic currents, including ICaL, If, IKr, and IKs [33, 34]. Ivabradine’s use-dependent If blockade, especially effective at high heart rates, supports its therapeutic potential in heart rate modulation [35]. Furthermore, it has been shown that while it is a primary contributor to diastolic depolarization, inward Ca²⁺ currents may also influence net membrane behavior during this phase, underscoring the multifactorial nature of pacemaker activity [36].
4.1 Experiment arrangements
The experiment arrangement is recorded at Annamalai University, India, and the experiment setup is installed by Biopac, India, with the following specifications: Patch-Clamp Electrophysiology System, Molecular Devices, USA, Axopatch 200B Microelectrode Amplifier. The coordinators' activation of two conductances—the Na+ conductance, which quickly sustains the AP's ascending phase—causes an action potential. In contrast to Na+ conductance, K+ conductance activated more slowly and contributed to the AP's falling phase. Studying conductance behavior can be challenging because the AP fluctuates with time, increasing and decreasing. Additionally, they alter in response to the voltage that raises the Na+ conductance activation with depolarization, resulting in the generation of AP and a voltage that is higher than the threshold voltage. If one of these voltages or times can be adjusted, an analysis becomes significantly easier, and the conductance will be easier to examine. Given that the voltage control method can clamp or modify the voltage across the membrane according to the value the investigator chooses, there is a chance that the Na+ and K+ conductance curves are preserved at the moment of measurement.
Figure 2. Experimental setup to identify electrical activities of ions
An external reference electrode and axon inserted with an internal electrode are used by an amplifier to measure $V_{m c}$. A comparator is used to measure the difference between $V_{m c}$ and Vs, which is the desired membrane voltage that the investigator has set at $\mathrm{V}_{\mathrm{s}}$. A current-passing electrode is employed by the voltage clamp amplifier to provide a current that is injected into the axon if $V_{m c}$ is not equal to $\mathrm{V}_{\mathrm{s}}$. This signal is produced by the comparator (Eq. (1)). $V_{m c}$=$\mathrm{V}_{\mathrm{s}}$ due to the injected current [36]. The feedback circuit functions instantly and maintains the membrane voltage as close to the command voltage as feasible. Lastly, a voltage amplifier can be used to measure and record the current needed to maintain the injected current as shown in Eq. (1) (Figure 2).
${{V}_{mc}}={{V}_{s}}$ (1)
4.2 Mathematical modeling of a cell
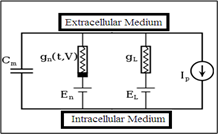
The generation and propagation of action potential in cardiac cells can be described using the Hodgin and Huxley (H-H) model. The cell is mathematically modeled to model the action potential. According to theory H-H, a cell's cell membrane, which serves as a capacitor, is a semi-permeable barrier that divides its intracellular and extracellular areas. The representations of voltage-gated and leaky ion channels are nonlinear conductance ($\mathrm{g}_{\mathrm{n}}$) and linear conductance ($\mathrm{g}_{\mathrm{L}}$), respectively. The electrochemical gradients that propel the ion flow are reflected in batteries (E). Ion pumps and exchangers are represented by current sources ($\mathrm{I}_{\mathrm{p}}$) (Figure 3).
Figure 3. Proposed equivalent circuit cell model
Steps to implement H-H model:
Step 1: Choose initial membrane potential membrane potential [37].
Step 2: Calculate gating variables (activation gate variable for sodium, inactivation gate variable for sodium, activation gate variable for potassium) at that Membrane potential shown in Eq. (2) and Eq. (3).
${{I}_{NA}}=~{{g}_{Na}}*{{x}^{3}}*h\left( {{V}_{m}}-E{{R}_{Na}} \right)$ (2)
${{I}_{K}}=~{{g}_{K}}*y*\left( {{V}_{m}}-E{{R}_{Na}} \right)$ (3)
Step 3: Calculate ionic currents ($I_{N a}, I_K$) using the H-H equations.
Step 4: Integrate over time using numerical methods (e.g., Euler or Runge-Kutta) to simulate action potentials.
The H-H theory derives the mathematical equation of the cell based on the equivalent cell model. The theory states that the voltage of the membrane with respect to time ($\mathrm{d}_{\mathrm{vm}} / \mathrm{dt}$) is inverse to the membrane capacitance ($\mathrm{C}_{\mathrm{m}}$) and proportional to the total ionic currents ($\mathrm{I}_{\text {ion}}$) of the cell (Eq. (4)).
$\frac{{{d}_{vm}}}{dt}=\frac{-{{I}_{ion}}}{{{C}_{m}}}$ (4)
${{I}_{ion}}={{i}_{Na}}+{{i}_{Ca,T}}+{{i}_{Ca,L}}+{{i}_{K}}+{{i}_{f}}+{{i}_{B}}+{{i}_{Na,K}}+{{i}_{Na,Ca}}+{{i}_{Ca,P}}$ (5)
where, $\mathrm{i}_{\mathrm{NaK}}$ is the electrogenic Na+-K+ pump current, $\mathrm{i}_{\mathrm{NaCa}}$ is the electrogenic Na+-Ca2+ exchanger current, $i_{\mathrm{Ca} . \mathrm{P}}$is the ATP-dependent Ca+2 pump current, and $\mathrm{i}_{, \mathrm{f}}$ is the hyperpolarization activated current ($\mathrm{g}_{\mathrm{FNa}}$). $\mathrm{i}_{, \mathrm{B}}$ is the linear background current ($\mathrm{g}_{\mathrm{BNa}}$). Where $\mathrm{i}_{, \mathrm{K}}$ is the time and voltage-dependent fast potassium current, $\mathrm{i}_{, \mathrm{Na}}$ is the time and voltage-dependent sodium current [38]; $\mathrm{i}_{\mathrm{Ca}, \mathrm{T}}$ and $\mathrm{i}_{\mathrm{Ca}, \mathrm{L}}$ are the time and voltage-dependent calcium currents. These are the time and voltage-dependent currents. The currents $\mathrm{i}_{\mathrm{b}, \mathrm{Na}}, \mathrm{i}_{\mathrm{b}, \mathrm{Ca}}$, and $\mathrm{i}_{\mathrm{b}, \mathrm{K}}$ are the three linear components that make up $\mathrm{i}_{, \mathrm{B}}$. The background current conductances for sodium, calcium, and potassium are, respectively, $\mathrm{g}_{\mathrm{BNa}}, \mathrm{g}_{\mathrm{BCa}}$, and $\mathrm{g}_{\mathrm{BK}}$. There are two parts to the present $\mathrm{i}_{\mathrm{i}, \mathrm{f}} ; \mathrm{i}_{\mathrm{f}, \mathrm{K}}$and $\mathrm{i}_{\mathrm{f}, \mathrm{Na}}$. The i,f channels allow both potassium and sodium ions to flow through them. The background current conductances $\mathrm{g}_{\mathrm{FNa}}$ and $\mathrm{g}_{\mathrm{FK}}$ are the conductance of the hyperpolarization triggered current in Eq. (5).
Since sodium exhibits a dominant conductance force in the cell membrane, the experiment was carried out with sodium currents. The sodium conductance characteristics of the action potential for the SA node cell are estimated based on the simulation results (Figure 4). The nominal (or initial) parameter values used for the simulation values were derived from a voltage clamp experiment, which provides the essential current- voltage relationships needed for accurate modeling.
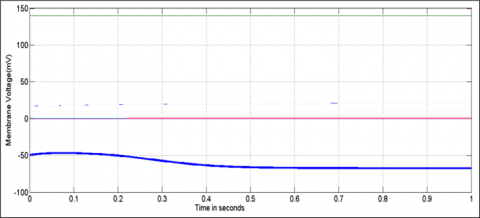
Figure 4. Action potential of the rabbit SA node cell at the initial condition
The initial condition of the cell is under the frequency of 4 cycles per minute. The measured values of the peak and resting voltages are 34 mV and -51 mV, respectively. The sodium influx point is seen at -30 mV, and the action potential lasts for 270 mS. The refractory periods are 100 mS and 165 mS, respectively, in absolute terms. The two most significant nominal parameters are the gBNa of 0.00016 and the hyperpolarization-activated current (gFNa) of 0.0067478.
${{\text{X}}_{\infty }}=\frac{1}{\left\{ 1+\text{exp}\left[ \frac{{{\text{V}}_{\text{m}}}-{{\text{V}}_{0.5}}}{\text{k}} \right] \right\}}$ (6)
where, $X \infty$ = degree of steady-state activation, $V_m$ is the membrane potential, $V_{0.5}$ is the half-activation voltage, and k is the slope factor. The fitting procedure yielded $V_{0.5}$ and k values of -74.0 and 9.1 mV, respectively, as shown in Eqs. (6)-(13):
${{I}_{f=}}{{I}_{f,Na}}+{{I}_{f,k}}$ (7)
${{I}_{f,Na=~}}gf,Na\times x\times \left( V-{{E}_{Na}} \right)$ (8)
${{I}_{f,Na}}=gf,K\times x\times \left( V-{{E}_{k}} \right)$ (9)
${{\tau }_{x}}=1/\left( \frac{0.36\left( V+147.9 \right)}{{{e}^{0.066~}}\left( V+147.9 \right)-1}+\frac{0.1\left( V+87.9 \right)}{1-{{e}^{-0.21~}}\left( V+87.9 \right)} \right)-0.054$ (10)
${{X}_{\infty }}=0.01329+\frac{0.99821}{1+{{e}^{\frac{v+97.134}{8.1752}}}},~if~V<-70~mV$ (11)
${{X}_{\infty }}=0.0002501*{{e}^{\left( -\frac{V}{12.961} \right)}},~if~V\ge -70~mV$ (12)
$\frac{dy}{dt}={{X}_{\infty }}-X/{{\tau }_{x}}$ (13)
5.1 Variation in gFNa
In this observation, the hyperpolarization-activated current is varied based on the nominal value, and variation in gFNa is carried out with gBNa as a constant (Figures 5 and 6).
Figure 5. Decrease in the action potential duration due to the increase in gFNa as 0.0100
Figure 6. Decrease in Action Potential Duration (APD) with the increase in gFNa as 0.0080
From the above values, it can be observed that there is an initiation in the refractory period of the final AP, and hence an increase in the action potential sequence happens (Figures 7 and 8).
Figure 7. Variation in the APD with respect to decrease in gFNa as 0.0045
Figure 8. AP of SA nodal cell with reduced gFNa value 0.0030
Since there is an increase in the APD, the sequence of AP gets reduced.
Figure 8 shows the drastic variation in action potential. The gFNa value is reduced to 0.0030. The action potential obtained for the cycle gets reduced to a single AP. Figure 9 shows the value gFNa reduced by 50% from the Figure 8 and hence action potential is completely disappeared.
Figure 9. The absence of the AP for the gFNa value 0.0015
5.2 Observation 2: Variation in linear backward current (gBNa)
Slowly the backward current increased by 50 % and hence changes appeared the waveform as shown in Figure 10. Observations were clear that there is an initiation in the refractory period of the final AP, and hence an increase in the action potential sequence happens (Figure 11), and since there is an increase in the APD, the sequence of AP gets reduced (Figure 10). Slowly reducing the gBNa value by a fraction of two values, as shown in Figure 12. The action potential obtained for the cycle gets reduced to a single AP, and the value of the gBNa reaches 0.000133. No action potential was measured or recorded by the electrodes, as shown in Figure 13.
Figure 10. Decrease in APD with the increase in gBNa as 0.00040
Figure 11. Decrease in the APD due to the increase in gBNa as 0.0002
Figure 12. Variation in AP since gBNa value is reduced as 0.000134
Figure 13. The absence of the AP for the gBNa value 0.000133
Table 1 represents the variation in the characteristics of the action potential with respect to hyperpolarization-activated current variation. Under this condition, the gBNa is at a constant value of 0.00016. Based upon the variation in the gFNa, it is observed that the APD gets increased, and at a particular value (0.0015), there is an absence in the action potential.
Table 1. Linear forward current (gBNa) variation results
|
S. No |
gFNa |
Sodium Influx Point (mv) |
Sodium Influx Point (ms) |
Peak Voltage (mv) |
Absolute Refractory Period (ms) |
Relative Refractory Period (ms) |
APD (ms) |
|
1 |
0.0100 |
-31 |
20 |
35 |
145 |
90 |
235 |
|
2 |
0.0080 |
-30 |
40 |
34 |
158 |
97 |
250 |
|
3 |
0.0067478 |
-30 |
54 |
34 |
165 |
100 |
270 |
|
4 |
0.0045 |
-32 |
75 |
33 |
185 |
110 |
290 |
|
5 |
0.0030 |
-40 |
110 |
33 |
230 |
100 |
330 |
|
6 |
0.0015 |
- |
- |
- |
- |
- |
No AP Recorded |
Table 2 represents the variation in the characteristics of the AP with respect to gBNa variation. Under this condition, the gFNa has a constant value of 0.0067478. Based upon the variation in the gBNa, it is observed that the APD gets increased, and at a particular value (0.000133), there is an absence in the action potential. From the variation in the currents, it is visible that the response for gBNa in the action potential is higher when compared to gFNa.
Table 2. Linear backward current (gBNa) variation results
|
S. No |
gBNa |
Sodium Influx Point (mv) |
Sodium Influx Point (ms) |
Peak Voltage (mv) |
Absolute Refractory Period (ms) |
Relative Refractory Period (ms) |
APD (ms) |
|
1 |
0.00040 |
-25 |
15 |
39 |
120 |
50 |
170 |
|
2 |
0.00030 |
-25 |
20 |
38 |
120 |
60 |
180 |
|
3 |
0.00016 |
-30 |
54 |
34 |
165 |
100 |
270 |
|
4 |
0.000138 |
-36 |
120 |
33 |
215 |
115 |
330 |
|
5 |
0.000134 |
-38 |
170 |
32 |
285 |
115 |
400 |
|
6 |
0.000133 |
- |
- |
- |
- |
- |
No AP Recorded |
In modeling studies and experiments, when the forward INa current falls below a critical value that is less than 0.0015, action potential failure is observed. The membrane potential remains subthreshold, and spontaneous rhythmic depolarization ceases. If the case still prolongs then without forward sodium current, the depolarization phase cannot reach the threshold, halting the pacemaking rhythm of the SA node. This implication may lead to failure of impulse propagation and sinus arrest (bradycardia).
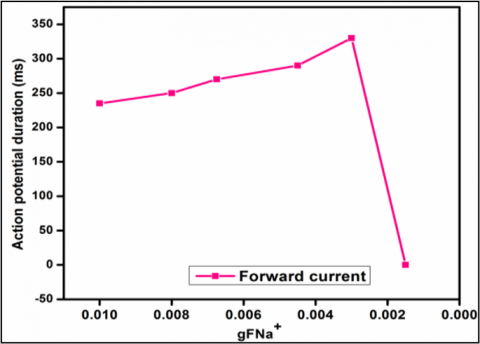
Figure 14 shows the forward current analyses, and the graph describes the various values of sodium ionic current with respect to the action potential total duration. As the curves started with a total time duration of AP of 235 mS, and as the ionic current value rises from 0.0100 to 0.0045 by the time the AP time duration reached its maximum peak value of 290 mS, the AP was not recorded when the gFNa+ dropped below 0.0015, and this is because the current induced in the cell was not sufficient to open the sodium channel, and the cell went into the refractory period, or resting period.
Figure 14. Analyses of the forward current
Figure 15. Analyses of the backward current
Figure 15 shows the backward current analyses, and the graph describes the various values of potassium ionic current with respect to the action potential total duration. As the curves started with a total time duration of AP of 170 mS and as the ionic current value rises from 0.0004 to 0.000134 by the time the AP time duration reached its maximum peak value of 400 mS, The AP is not recorded; when the gFNa+ drops below 0.000134, this is because the current induced in the cell is not sufficient to open the potassium channel, and the cell status is the same as in the in the initial condition. When a comparison is made between the Na+ and K+ curvatures, it is clear that the ionic channel is sensitive and can be studied evidently.
Action potential characterisation between rabbit and human SA node: A comparative voltage analysis was conducted between human and rabbit cardiac cell models, with a specific focus on the functional contribution of the sodium-calcium exchanger current INaCa. In human cardiac models, particularly those representing atrial and ventricular myocytes, INaCa was investigated for its influence on the action potential plateau and the repolarization phases. In rabbit hearts, especially their sinoatrial (SA) node cells, are widely used as experimental models due to their accessibility and higher heart rates. In rabbits, INaCa plays a more dominant role in pacemaker activity, contributing significantly to diastolic depolarization. The human current density of INaCa is generally higher in rabbit SA node cells, aligning with their faster pacing requirements, while in humans, the exchanger works in coordination with other mechanisms such as the funny current (If) and intracellular calcium handling to regulate pacemaking. Electrophysiological modeling in humans is calibrated using clinical electrocardiogram (ECG) data and action potential durations, offering direct relevance to clinical conditions and therapeutic development. On the other hand, rabbit models are predominantly used for preclinical investigations and mechanistic studies of ionic currents due to their ease of use and physiological similarities.
The major difference between these Na+ and K+ conductances was identified as that Na+ conductance does not drop to the resting level. The inward current can be blocked using a chemical agent, TTX (tetrodotoxin, C11H17N3O8), and the outward current can be blocked using TEA (tetraethylammonium, C8H20N+). The effect of Tetrodotoxin on the sodium current the voltage rises from -130 mV to level voltage (0V) after exposure to different variations of TTX 10-8m and TTX 10-7 m, and the current varies -1nA to -5nA for the voltage range between -130 mV to 0 mV of membrane potential [38]. The purpose of this article is to examine how sodium currents affect the generation of action potentials and how they relate to rhythmic activity. This has a clinical correlation with the functioning of artificial cardiac pacemakers. It helps to decide the type of cardiac pacemakers to be implanted. The analyses revealed the effects of forward and backward sodium currents on the generation of action potential. Hyper-polarization activated backward current value goes less than 0.000133 amps, then absence in the action potential was recorded. Hyper-polarization activated forward current value goes less than 0.0015 amps, and then absence in the action potential was recorded. The forward and backward hyperpolarization-activated sodium currents are critical for action potential generation in SA node cells. Their suppression below specific threshold values leads to action potential failure, guiding decisions in artificial pacemaker design.
This article investigates the distinct roles of forward and backward sodium conductances, in contrast to potassium (K⁺) conductances, influence rhythmic cardiac activity and contribute to decisions regarding pacemaker type selection in clinical settings. Experimental models of SA node cells were employed to analyze the behavior of Na⁺ and K⁺ conductances. It was observed that Na⁺ conductance differs from K⁺ conductance in that it does not return to the resting level during diastole and hyperpolarization-activated Na⁺ currents were measured separately to analyze their influence on the presence or absence of action potentials that may lead to cardiac malfunctions. The analysis demonstrated that forward and backward Na⁺ currents significantly affect action potential generation. When the backward Na⁺ current dropped below 0.000133 A, no action potential was recorded. Similarly, when the forward Na⁺ current decreased below 0.0015 A, action potential was also absent. This threshold sensitivity underscores the dependent behavior of Na⁺ currents, highlighting their critical role in cardiac rhythmicity and offering insights into pacemaker design and implantation criteria.
[1] Petousakis, K.E., Apostolopoulou, A.A., Poirazi, P. (2023). The impact of Hodgkin-Huxley models on dendritic research. Journal of Physiology, 601(15): 3091-3102. https://doi.org/10.1113/JP282756
[2] Bleeker, W.K., Mackaay, A.J.C., Pevet, M.M., Bouman, L.N., Becker, A.E. (1980). Functional and morphological organization of the rabbit sinus node. Circulation Research, 46(1): 11-22. https://doi.org/10.1161/01.res.46.1.11
[3] Demir, S.S., Clark, J.W., Murphey, C.R., Giles, W.R. (1994). A mathematical model of a rabbit sinoatrial node cell. American Journal of Physiology-Cell Physiology, 266(3): C832-C852. https://doi.org/10.1152/ajpcell.1994.266.3.C832
[4] AbdelAty, A.M., Fouda, M.E., Eltawil, A. (2022). Parameter estimation of two spiking neuron models with meta-heuristic optimization algorithms. Frontiers in Neuroinformatics, 16: 771730. https://doi.org/10.3389/fninf.2022.771730
[5] Wilders, R., Jongsma, H.J., Van Ginneken, A.C.G. (1991). Pacemaker activity of the rabbit sinoatrial node: A comparison of mathematical models. Biophysical Journal, 60(5): 1202-1216. https://doi.org/10.1016/S0006-3495(91)82155-5
[6] Ramaiah, A., Balasubramanian, P.D., Appathurai, A., Narayanaperumal, M. (2024). Detection of Parkinson's disease via Clifford gradient-based recurrent neural network using multi-dimensional data. Revue Roumaine des Sciences Techniques-Série Électrotechnique et Énergétique, 69(1): 103-108. https://doi.org/10.59277/RRST-EE.2024.1.18
[7] Hodgkin, A.L., Katz, B. (1949). The effect of sodium ions on the electrical activity of the giant axon of the squid. Journal of Physiology, 108(1): 37-77. https://doi.org/10.1113/jphysiol.1949.sp004310
[8] Mangoni, M.E., Couette, B., Bourinet, E., Platzer, J., Reimer, D., Striessnig, J. (2003). Functional role of L-type Cav1.3 Ca2+ channels in cardiac pacemaker activity. Proceedings of the National Academy of Sciences, 100(9): 5543-5548. https://doi.org/10.1073/pnas.0935295100
[9] Trayanova, N.A. (2011). Whole-heart modeling: Applications to cardiac electrophysiology and electromechanics. Circulation Research, 108(1): 113-128. https://doi.org/10.1161/CIRCRESAHA.110.223610
[10] Pohl, A., Wachter, A., Hatam, N., Leonhardt, S. (2016). A computational model of a human single sinoatrial node cell. Biomedical Physics and Engineering Express, 2(3): 035006. https://doi.org/10.1088/2057-1976/2/3/035006
[11] Hodgkin, A.L., Huxley, A.F. (1952). Currents carried by sodium and potassium ions through the membrane of the giant axon of Loligo. Journal of Physiology, 116(4): 449-472. https://doi.org/10.1113/jphysiol.1952.sp004717
[12] Lei, M., Zhang, H., Grace, A.A., Huang, C.L. (2007). SCN5A and sinoatrial node pacemaker function. Cardiovascular Research, 74(3): 356-365. https://doi.org/10.1016/j.cardiores.2007.01.009
[13] Fink, M., Niederer, S.A., Cherry, E.M., Fenton, F.H., Koivumäki, J.T., Seemann, G., Thul, R., Zhang, H., Sachse, F.B., Beard, D., Crampin, E.J., Smith, N.P. (2011). Cardiac cell modelling: Observations from the heart of the cardiac physiome project. Progress in Biophysics and Molecular Biology, 104(1-3): 2-21. https://doi.org/10.1016/j.pbiomolbio.2010.03.002
[14] Lang, D., Glukhov, A.V. (2018). Functional microdomains in heart's pacemaker: A step beyond classical electrophysiology and remodeling. Frontiers in Physiology, 9: 1686. https://doi.org/10.3389/fphys.2018.01686
[15] Chandler, N.J., Greener, I.D., Tellez, J.O., Inada, S., Musa, H., Molenaar, P., Difrancesco, D., Baruscotti, M., Longhi, R., Anderson, R.H. (2009). Molecular architecture of the human sinus node: Insights into the function of the cardiac pacemaker. Circulation, 119(12): 1562-1575. https://doi.org/10.1161/CIRCULATIONAHA.108.804369
[16] Ambesh, P., Kapoor, A. (2017). Biological pacemakers: Concepts and techniques. National Medical Journal of India, 30(6): 324-326. https://doi.org/10.4103/0970-258X.239072
[17] Vetulli, H.M., Elizari, M.V., Naccarelli, G.V., Gonzalez, M.D. (2018). Cardiac automaticity: Basic concepts and clinical observations. Journal of Interventional Cardiac Electrophysiology, 52(3): 263-270. https://doi.org/10.1007/s10840-018-0423-2
[18] Verkerk, A.O., Borren, M.M.G.J., Wilders, R. (2013). Calcium transient and sodium-calcium exchange current in human versus rabbit sinoatrial node pacemaker cells. Scientific Reports, 3: 2104. https://doi.org/10.1038/srep02104
[19] Verkerk, A.O., Wilders, R., van Borren, M.M., Peters, R.J., Broekhuis, E., Lam, K., Coronel, R., de Bakker, J.M., Tan, H.L. (2007). Pacemaker current (If) in the human sinoatrial node. European Heart Journal, 28(20): 2472-2478. https://doi.org/10.1093/eurheartj/ehm339
[20] Lei, M., Honjo, H., Kodama, I., Boyett, M.R. (2001). Heterogeneous expression of the delayed-rectifier K+ currents iK,r and iK,s in rabbit sinoatrial node cells. Journal of Physiology, 535(3): 703-714. https://doi.org/10.1111/j.1469-7793.2001.t01-1-00703.x
[21] Burkhard, S., van Eif, V., Garric, L., Christoffels, V.M., Bakkers, J. (2017). On the evolution of the cardiac pacemaker. Journal of Cardiovascular Development and Disease, 4(2): 4. https://doi.org/10.3390/jcdd4020004
[22] Carmona, R., Ariza, L., Cañete, A., Muñoz-Chápuli, R. (2018). Comparative developmental biology of the cardiac inflow tract. Journal of Molecular and Cellular Cardiology, 116: 155-164. https://doi.org/10.1016/j.yjmcc.2018.02.004
[23] Irisawa, H., Brown, H.F., Giles, W. (1993). Cardiac pacemaking in the sinoatrial node. Physiological Reviews, 73(1): 197-227. https://doi.org/10.1152/physrev.1993.73.1.197
[24] Boyett, M.R., Honjo, H., Kodama, I. (2000). The sinoatrial node, a heterogeneous pacemaker structure. Cardiovascular Research, 47(4): 658-687. https://doi.org/10.1016/S0008-6363(00)00135-8
[25] Satoh, H. (2003). Sino-atrial nodal cells of mammalian hearts: Ionic currents and gene expression of pacemaker ionic channels. Journal of Smooth Muscle Research, 39(5): 175-193. https://doi.org/10.1540/jsmr.39.175
[26] Couette, B., Marger, L., Nargeot, J., Mangoni, M.E. (2006). Physiological and pharmacological insights into the role of ionic channels in cardiac pacemaker activity. Cardiovascular and Hematological Disorders-Drug Targets, 6(3): 169-190. https://doi.org/10.2174/187152906778249572
[27] Dobrzynski, H., Boyett, M.R., Anderson, R.H. (2007). New insights into pacemaker activity: Promoting understanding of sick sinus syndrome. Circulation, 115(14): 1921-1932. https://doi.org/10.1161/CIRCULATIONAHA.106.616011
[28] Zaza, A., Robinson, R.B., DiFrancesco, D. (1996). Basal responses of the L-type Ca2+ and hyperpolarization-activated currents to autonomic agonists in the rabbit sino-atrial node. Journal of Physiology, 491(2): 347-355. https://doi.org/10.1113/jphysiol.1996.sp021220
[29] Dokos, S., Celler, B.G., Lovell, N.H. (1996). Vagal control of sinoatrial rhythm: A mathematical model. Journal of Theoretical Biology, 182(1): 21-44. https://doi.org/10.1006/jtbi.1996.0141
[30] Demir, S.S., Clark, J.W., Giles, W.R. (1999). Parasympathetic modulation of sinoatrial node pacemaker activity in rabbit heart: A unifying model. American Journal of Physiology-Heart and Circulatory Physiology, 276(6): H2221-H2244. https://doi.org/10.1152/ajpheart.1999.276.6.H2221
[31] Zhang, H., Holden, A.V., Noble, D., Boyett, M.R. (2002). Analysis of the chronotropic effect of acetylcholine on sinoatrial node cells. Journal of Cardiovascular Electrophysiology, 13(5): 465-474. https://doi.org/10.1046/j.1540-8167.2002.00465.x
[32] Maltsev, V.A., Lakatta, E.G. (2010). A novel quantitative explanation for the autonomic modulation of cardiac pacemaker cell automaticity via a dynamic system of sarcolemmal and intracellular proteins. American Journal of Physiology-Heart and Circulatory Physiology, 298(6): H2010-H2023. https://doi.org/10.1152/ajpheart.00783.2009
[33] Zhang, H., Butters, T., Adeniran, I., Dempsey, C.E., Hancox, J.C., Zhang, H., Boyett, M.R. (2012). Modeling the chronotropic effect of isoprenaline on rabbit sinoatrial node. Frontiers in Physiology, 3: 241. https://doi.org/10.3389/fphys.2012.00241
[34] Muniyappan, A., Parasuraman, E., Seadawy, A.R., Ramkumar, S. (2024). Formation of solitons with shape changing for a generalized nonlinear Schrödinger equation in an optical fiber. Optical and Quantum Electronics, 56(3): 440. https://doi.org/10.1007/s11082-023-05965-5
[35] Zaza, A., Micheletti, M., Brioschi, A., Rocchetti, M. (1997). Ionic currents during sustained pacemaker activity in rabbit sino-atrial myocytes. Journal of Physiology, 505(3): 677-688. https://doi.org/10.1111/j.1469-7793.1997.677ba.x
[36] Marian, A.J. (2005). On mice, rabbits, and human heart failure. Circulation, 111(18): 2276-2289. https://doi.org/10.1161/01.CIR.0000167559.13502.9A
[37] Verkerk, A.O., Wilders, R. (2013). Hyperpolarization-activated current, If, in mathematical models of rabbit sinoatrial node pacemaker cells. BioMed Research International, 2013: 872454. https://doi.org/10.1155/2013/872454
[38] Ju, Y.K., Saint, D.A., Hirst, G.D.S., Gage, P.W. (1995). Sodium currents in toad cardiac pacemaker cells. Journal of Membrane Biology, 145(2): 119-128. https://doi.org/10.1007/BF00237370