Zainab Jaber Mohammed![]() | Manal Abdulsattar Muhammed
| Manal Abdulsattar Muhammed![]() | Nuralhuda Aladdin Jasim*
| Nuralhuda Aladdin Jasim*![]() | Ahmed Adel Naji
| Ahmed Adel Naji![]() | Aqeel A. Abdulhassan
| Aqeel A. Abdulhassan![]()
© 2025 The authors. This article is published by IIETA and is licensed under the CC BY 4.0 license (http://creativecommons.org/licenses/by/4.0/).
OPEN ACCESS
Infiltration represents one of the important characteristics of an irrigation system for fields. This study aims to examine factors affecting spatial variability regarding soil infiltration within cultivated lands at Al-Shehaymiyah for the purpose of recognizing the soil infiltration process for improving and exploiting the land’s resources in a better way towards a more economical and agricultural system of irrigation. As a first step, an analysis of the topsoil structure was conducted for three different fields on three layers, to test the effects of those factors on the infiltration within all the measurement fields. A double-ring infiltration rate test was made for the nine chosen fields. The results show that observed rates of infiltration are higher than the typical rates of water infiltration through this type of soil. Infiltration rates ranged between 10-40 mm/h, exceeding typical clay soil values (3-8 mm/h). The rates of infiltration could be clarified either via the differences among fields or via the differences within local topsoil structure. The findings support more efficient irrigation system design tailored to local soil infiltration behavior.
infiltration rate, double ring test, irrigation system, soil
Soil infiltration rate (IR) is a key indicator of soil-water interaction efficiency. Soil characteristics and the type of land use are the most important variables for all situations where the best performance in infiltration surveys is attained. As a result, infiltration needs to be understood in detail for various land-use complexes [1]. For the fertility and soil quality, the surface irrigation process is used for more than 90% of the world's agricultural area, and that’s with the main drawback because of low yield caused by the operation as well as poor design [2, 3]. In the surface irrigation system, water is distributed through the soil structure, which makes it vital for the study and development of methodologies for modeling the processes of water infiltration as well as the redistribution [4].
Soil infiltration is an important mechanism that controls how water moves through the soil profile. It is critical for managing water resources and agriculture. For crops to grow well, the soil needs to be at the right moisture level, which is especially important in irrigation systems. Poor infiltration can cause water to flow off the surface, erode the soil, and collect too much water, all of which hurt crop yields [5]. On the other hand, adequate infiltration helps the soil hold onto water better, which means less frequent watering and less waste of water resources [6].
When it comes to managing water resources, knowing how soil infiltration works is critical for making irrigation systems that will last, especially in places where water is scarce. Agriculture can be more adaptable to changes in climate if farmers apply the right soil management techniques that improve infiltration [7].
The type of soil has a big effect on how quickly and how well water can penetrate the ground. The type of soil (sand, silt, clay) impacts how porous and permeable it is, which in turn affects how water travels through and is absorbed by it [8]. For instance, sandy soils tend to let water in quickly because their particles are big and thus are more permeable. Clay soils, on the other hand, have smaller pores and lower infiltration rates. This means that when it rains heavily or is irrigated, water can flow off the surface [9].
The amount of organic matter, the amount of moisture, and the amount of soil compaction all affect how well soil absorbs water [10]. Organic matter improves the soil structure, which helps water soak and stay in the soil. On the other hand, heavy machinery or livestock can compact soil, which can make it harder for water to get in and diminish pore space [11]. Additionally, external factors such as rain patterns and temperature can alter the infiltration process by affecting both the moisture content in the soil and the surface conditions.
The Al-Shehaymiyah agricultural area in southern Iraq is a great place to research soil infiltration because it has a semi-arid environment and many different types of soil. Irrigation is critical for growing crops in this area, and effective water management is essential for keeping farming going. Al-Shehaymiyah's soil is a mix of sandy, loamy, and clayey soils, each with its own water absorption method [12]. Previous research has indicated that the region has a serious problem with not having enough water, which makes it even more important to have adequate water management plans [13].
Researchers in the region have been looking at how things like soil texture, organic matter, and land use affect how water moves and stays in the soil. The results show that adding organic matter to the soil and lowering compaction can greatly increase the pace at which water can move through the soil [13].
Al Marsumi and Al Shamma [14] studied the eastern Missan governorate, southeastern Iraq, 32°29.52"–32°37.30" latitude, 46°46'21.16"–47°58'53.52" longitude. Soil is alive and fulfills four key functions in the pedosphere. It produces, purifies, and stores water and supports plant development. Soil spatial mapping defines distinct soil types. The soil's formation circumstances and geomorphology help define it. A soil's hydrologic soil group depends on its infiltration rate, runoff, and producing features. Based on hydrologic properties, soils fall into four groups: Group A, which has a fast infiltration rate when wet but a low runoff potential; Group B, which has a moderate rate but a low runoff potential; Group C, which is slow but has a large runoff potential; and Group D, which is very gradual but has the highest runoff potential. The USDA hydrological soil classification system has four groups: A, B, C, and D. Groups B and C have a high moderate infiltration extension, while groups A and D have 19%, 48%, 32%, and 1%.
Abdel-rahman et al. [15] stated that the infiltration features of key soils in Sohag governorate, Egypt, were studied. Twelve soil profiles representing the study area were exposed and morphologically evaluated. Horizon-wise soil samples were tested for physical and chemical qualities. Infiltration field measurements were taken for five hours using a double-ring infiltrometer and the empirical Kostiakov model. Results classified soils as Aridisols, Entisols, and Vertisols. Initial infiltration rates were 0.80–6.67 m/day. The coarse texture of locations 11 and 12 yielded the highest values (6.47 and 6.67 m/day). In locations 8, 4, and 7, fine-textured soils had the lowest values (0.80, 0.81, and 0.82 m/day). Very rapid, rapid, moderate, and moderate infiltration rates exist. Sand, hydraulic conductivity, CaCO₃ content, and organic carbon were positively correlated with stable infiltration rates at r=0.95, 0.93, 0.74, and 0.79. However, they were adversely connected with infiltration rates (r = -0.80, -0.91, -0.95, -0.97, -0.64). Bulk density had an insignificant connection (p=0.05) with infiltration rates (r=0.13). After creating soil parameter maps in GIS, the study area's infiltration map was created.
Over time, the infiltration process varies, depending on the characteristics of the agricultural land. It actually changes the flow surface by making it irregular and variable with the spatial [16]. The three distinct phases occurring throughout the process of surface irrigation are the advanced stage, storage stage, as well the stagnant stage. The three stages were studied together with many models for a better understanding of the phenomena [17]. To improve the use of land resources or direct agricultural irrigation, it is vital to comprehend the role of soil infiltration [18]. i. Various factors affect the characteristics of soil infiltration, and the most essential factors are the kind and density of the vegetation cover [19]. ii. The surface consists of crusts and the structure of topsoil [9]. iii. The level of the biological activity and what it results [20]. There are other factors like the slope, as well as soil type and the structure of the surface, few as the soil, its roughness and texture, the grass cover, as well as the surface content of water, which affect the variability regarding soil infiltration effect for the field [21].
The main goal of this study is to look at how well the soil in the Al-Shehaymiyah agricultural area absorbs water and to identify new ways to better manage water. The goal of this study is to:
1. Find out how different types of soil affect how quickly water gets into the ground.
2. Look into how land management activities, such as adding organic matter and using different irrigation methods, affect how water moves through the soil.
3. Come up with ways to use water more efficiently and lose less water by improving infiltration.
This study employs modern soil sensors and remote sensing technology to monitor the changes in soil moisture and infiltration over time. Furthermore, using soil amendment trials, like adding compost and mulch, is a new way in the area to increase soil structure and infiltration [22, 23].
2.1 Study site: Al-Shahimiya
Al-Shehaymiyah, a sub-district in Wasit Governorate, Iraq, is located at a latitude of 32.6949716 and a longitude of 44.9731814. It contains vast agricultural lands for wheat cultivation. Al-Shehaymiyah is one of the reclaimed project lands in Iraq.
The study was placed in Al-Shehaymiyah, which is in central Iraq and is between 32.547351°N and 32.769883°N latitude and 44.862119°E and 45.087212°E longitude. ArcGIS shapefiles were used to make the border map. These files were made at a scale of 1:5000 and were based on the WGS 1984 UTM Zone 38N coordinate system.
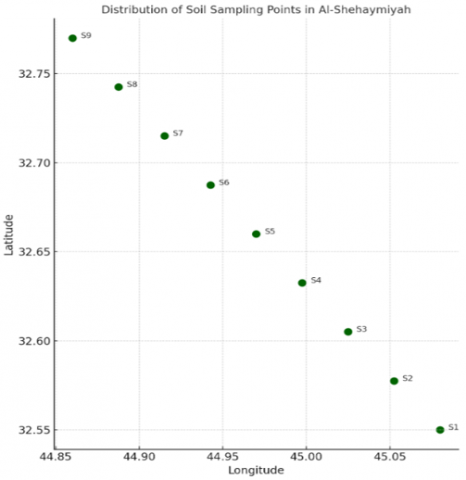
The nine sampling points were chosen based on how the land is used, how easy it is to get to, and how well they represent agricultural activities. Figure 1 shows where these points are located, and Table 1 shows the soil texture classes that go with each point, which were determined by USDA soil triangle criteria.
Figure 1. Distribution map of nine sampling points
Table 1. Soil texture classification of sampling points
|
Sample ID |
Latitude |
Longitude |
Soil Type |
|
S1 |
32.5500 |
45.0800 |
Clay |
|
S2 |
32.5775 |
45.0525 |
Clay |
|
S3 |
32.6050 |
45.0250 |
Clay |
|
S4 |
32.6325 |
44.9975 |
Clay |
|
S5 |
32.6600 |
44.9700 |
Silty clay |
|
S6 |
32.6875 |
44.9425 |
Silty clay |
|
S7 |
32.7150 |
44.9150 |
Clay |
|
S8 |
32.7425 |
44.8875 |
Clay loam |
|
S9 |
32.7700 |
44.8600 |
Silty clay loam |
To figure out how water moves through agricultural fields, you need to know where the sampling sites are and what the soil textures are like at those sites. To find out how well the soil in the Al-Shehaymiyah region of Central Iraq absorbs water, this study picked nine representative sites. These places were carefully picked to cover the research area well and show how different soil qualities affect how water moves through the soil profile.
Figure 1 shows where the nine soil sampling stations are located in Al-Shehaymiyah. The locations are evenly spaced within the region's boundaries, with a range of latitudes from 32.55° to 32.77° N and longitudes from 44.86° to 45.08° E. This even dispersion makes sure that the data collected shows how field conditions naturally change. Each point is carefully labeled (S1 to S9), which makes it easier to find them when analyzing. The base map shows where things are in the world and helps you see how the soil changes across the area.
Table 1 shows the characteristics of the nine sampling places, such as their latitude and longitude, and the type of soil they have. The USDA soil taxonomy and the standard particle size distribution were used to determine what kinds of soil there were. The table shows that there are a lot of different textures, such as Clay Loam, Silty Clay Loam, clay, and silty clay.
This classification is very important for understanding how infiltration works. For example, clay and silty clay soils (like S2 and S5) are likely to have lower infiltration rates because they have smaller particles and hold more water. Clay loam and silty clay loam (like S8 and S9) are likely to have faster infiltration rates because they have bigger pore spaces and better drainage.
The differences in texture across sampling places make it possible to compare infiltration under different physical soil conditions [24].
Finally, the distribution map and soil classification table give us the basic information we need to understand infiltration measurements in the Al-Shehaymiyah region. The image shows that the sampling spots are well-placed and strategically located, while the table shows how different soil textures affect how water seeps into the ground. When used together, these technologies help gain a better picture of the conditions in the field and help plan how to manage water in Central Iraq's agricultural areas.
2.2 Infiltration rate
We can identify infiltration rate as the speed of the procedure of the water moving down through the surface of the soil [25]. It is dividing rainfall into surface as well as subsurface runoff. And therefore, Infiltration is considered one of the important processes regarding the hydrologic cycle [26].
2.3 Measurement
We select nine fields distributed in different locations of the Al-Shehaymiyah fields.
We select three of the nine fields to analyze the type of their soils.
We chose the double-ring test to measure the Water Infiltration Rate (WIR) for these fields.
The infiltration had been measured via a double-ring. A 15 cm head had been maintained throughout measurement. The rings’ diameter of both the inner as well the outer were 30 cm, 60 cm. The water level readings had been taken every five minutes for a two-hour period [27]. The double ring test had been used for measuring infiltration for the reason of its precision.
It is used a double-ring infiltrometer is used to do the infiltration tests. To keep the hydraulic conditions steady, both rings had a constant water head of 15 cm during the testing. Every 2-3 minutes, a pipette was used to manually add water to the rings. We took three infiltration measurements at each sampling site (n = 3) to make sure the data were accurate and could be repeated. Before testing for infiltration, the soil inside the rings was pre-wetted by adding around 2 cm of water for 10 minutes. This was done to mimic natural moisture conditions and reduce the impacts of surface sealing. Before taking measurements, extra water was carefully removed.
According to the analysis of samples for different fields, the type of soil is shown in Table 1. In Table 2, we show the infiltration rate, pH, ECw, and EC for the nine fields, and we notice that it has a higher infiltration rate than the typical rates.
In Figure 1, we show IR graphs that were created using cumulative infiltration values with time, for all nine fields.
Table 2. The analysis of soil samples for different fields
|
No. |
Al Shehemiah |
EC |
pH |
N% |
K ppm |
Gypsum% |
Soil Texture USDA |
Soil Texture |
|||
|
Field No. |
Layer cm |
Clay |
Sand |
Silt |
|||||||
|
1 |
1 |
0.8 |
8.66 |
0.53 |
160 |
1.1107 |
(0-30) |
57.4 |
6.9 |
35.7 |
Clay |
|
2 |
0.9 |
8.76 |
0.37 |
80 |
1.1107 |
(30-60) |
62.4 |
1.9 |
35.7 |
Clay |
|
|
3 |
0.1 |
9.06 |
0.45 |
100 |
0.7166 |
(30-60) |
44 |
16.75 |
39.25 |
Clay |
|
|
4 |
3 |
0.5 |
8.58 |
0.42 |
180 |
1.5766 |
(0-30) |
49 |
11.75 |
39.25 |
Clay |
|
5 |
0.8 |
8.72 |
0.43 |
160 |
1.9707 |
(30-60) |
42.4 |
19.4 |
38.2 |
Silty clay |
|
|
6 |
1.3 |
8.62 |
0.40 |
120 |
0.7166 |
(60-90) |
44 |
14.25 |
41.75 |
Silty clay |
|
|
7 |
8 |
0.4 |
8.56 |
0.33 |
180 |
1.1107 |
(0-30) |
59.9 |
19.4 |
20.7 |
Clay |
|
8 |
0.1 |
8.13 |
0.47 |
140 |
1.5766 |
(30-60) |
34.9 |
44.4 |
20.7 |
Clay loam |
|
|
9 |
0.1 |
8.89 |
0.31 |
160 |
1.5766 |
(60-90) |
32.4 |
44.4 |
23.2 |
Silty clay loam |
|
Table 3. Infiltration rate (IR) for nine fields
|
Field No. |
IR: mm/h |
pH |
ECw |
Ec |
|
1 |
29 |
8.18 |
1.11 |
0.8 |
|
2 |
24 |
8.3 |
1.1 |
0.7 |
|
3 |
40 |
7.93 |
0.91 |
0.5 |
|
4 |
19 |
8.2 |
1.19 |
0.4 |
|
5 |
10 |
7.68 |
0.92 |
0.6 |
|
6 |
24 |
8.28 |
1.16 |
0.4 |
|
7 |
19 |
8.06 |
1.09 |
0.9 |
|
8 |
15 |
8.32 |
1.16 |
0.4 |
|
9 |
18 |
8.24 |
0.95 |
0.5 |
The three infiltration measurements were taken at each sampling site (n = 3). The IR values in Table 3 for each plot are the averages of the three replicates that were taken at each site. This method of averaging makes sure that the reported values show how consistent the infiltration rates are across several measurements at each sampling site.
The USDA classified the soils of the Al-Shehaymiyah fields into different textural groups depending on how the particles were distributed. These classes included clay, silty clay, clay loam, and silty clay loam. The amount of clay in the soil varied from 32.4% to 62.4%, the amount of sand from 1.9% to 44.4%, and the amount of silt from 20.7% to 41.75%. Based on the results in Table 2 show the analysis of soil samples for different fields.
When it is looked at, infiltration rate statistics with these textures in mind, a definite pattern starts to show up. Fields with mostly pure clay textures (like Fields 1–4) had moderate to high infiltration rates, especially in the topsoil layers. For example, Field 1 had an IR of 29 mm/h and a clay content of 57.4%. This is different from what most people think, since clay soils normally don't let water through easily because their particles are small and they take a long time to dry out. But the fractures, aggregation, or biological activity in certain regions may have made infiltration easier.
In contrast, the soils in Fields 5, 6, and 9, which were silty clay and silty clay loam, had lower infiltration rates. Field 5 had the lowest rate, with IR = 10 mm/h. These textures are also fine-grained, but they may have fewer macropores and a weaker structure, which makes them slower to absorb water, even though they have a little less clay.
Clay loam soils, like those in Field 8, have moderate infiltration rates (IR = 15 mm/h). These soils have a more balanced texture because they have intermediate porosity and relatively strong water retention. This can explain why they don't let water in as quickly as others.
In general, soil texture has an effect on infiltration rates, but the results show that soil structure, layer depth, and chemical qualities (such as gypsum concentration and EC) all have a big effect on how water moves through these soils. Some clay-dominated profiles have high IR, which shows that there is secondary macroporosity, which could be caused by shrink-swell behavior or biological activity.
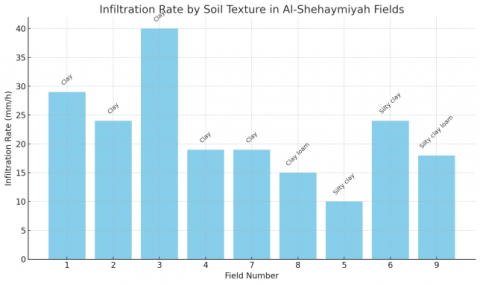
The bar chart in Figure 2 shows the infiltration rates (IR, in mm/h) recorded in nine fields in Al-Shehaymiyah. Each bar is labeled with the type of soil in that field (for example, clay, silty clay, clay loam, and silty clay loam). This picture makes it possible to compare how different types of soil affect the flow of water into the soil profile.
Most of the fields in the dataset have a clay texture. Clay soils, which are usually thought to have low permeability because their particles are small and packed tightly, showed a wide variety of infiltration rates. For example, Field 3, which is made up of clay, had the greatest IR at 40 mm/h, which is far higher than the normal range for clay soils (3–8 mm/h, according to the literature). This means that things other than roughness, including structural fissures, biological pathways, or organic matter, might be helping water move more easily in that field. Fields 1 and 2, which were likewise classed as clay, had IR values of 29 mm/h and 24 mm/h, which were also rather high.
Figure 2. Infiltration rate by soil texture in Al-Shehaymiyah fields, central Iraq
On the other hand, Fields 5 and 6, which were classed as silty clay, had some of the lowest infiltration rates, with Field 5 only getting 10 mm/h. Silty clays have less clay than pure clay soils, but they don't stick together well and don't have many big pores, which can make it hard for water to get through. These results show that the structure of the soil matrix is just as important as the particle-size distribution when it comes to influencing how water moves through the soil.
Field 8, which has a clay loam texture, had an IR of 15 mm/h, which is in the middle of the range. This is in line with what would be expected for clay loam soils, which usually have a more even mix of sand, silt, and clay. This makes them more porous and allows for moderate infiltration. Field 9, which had a silty clay loam texture, had an IR of 18 mm/h, which is likewise in the moderate range. This further supports the idea that loam-based soils behave in a transitional way.
The chart shows that there is no straight line between soil texture and infiltration rate. Texture is the main way to group soils based on how they behave, although structural factors like compaction, organic matter, soil layering, and gypsum content have a big effect on how water moves through the soil. The fact that infiltration rates can vary a lot within the same texture class (particularly clay) shows how important it is to look at both the physical and chemical aspects of soil while studying water in soil.
This figure backs up the idea that soil texture can give a broad idea of how water will go through it, but it shouldn't be utilized on its own. To really understand and control how water moves in agricultural and hydrological settings, you also need to look at the conditions in the field.
Comparison of Infiltration Rate (IR) at Different Sites
The infiltration rates (IR) measured across the nine fields in Al-Shehaymiyah showed considerable variability, ranging from 10 mm/h to 40 mm/h (Table 1). Field 3 exhibited the highest IR of 40 mm/h, while Field 5 recorded the lowest value of 10 mm/h. Other fields generally had IR values between 15 and 29 mm/h. This variability may reflect differences in soil texture, structure, and moisture conditions at the various sites.
Relationship Between Infiltration Rate and Soil Parameters (pH, ECw, and EC)
The relationship between infiltration rate and soil chemical properties such as pH, electrical conductivity of soil water (ECw), and soil electrical conductivity (EC) was investigated. The pH values across all fields were relatively alkaline, ranging between 7.68 and 8.32. No clear linear correlation was observed between IR and pH.
ECw values varied slightly from 0.91 to 1.19 dS/m, while EC values ranged between 0.4 and 0.9 dS/m. Generally, fields with lower EC and ECw tended to show higher infiltration rates (e.g., Field 3 with ECw 0.91 dS/m and IR 40 mm/h), suggesting that lower salinity levels may favor infiltration. However, statistical correlation tests would be necessary to confirm these trends.
Effect of Soil Type on Infiltration Rate
Soil texture analysis (not shown here) classified the soils mainly as clay loam. Clay loam soils typically have infiltration rates ranging from 3 to 8 mm/h as reported in the literature. However, the measured IR values in this study were generally higher, which may be attributed to soil structure, degree of cracking, or organic matter content enhancing infiltration.
Comparison with Typical Literature Values
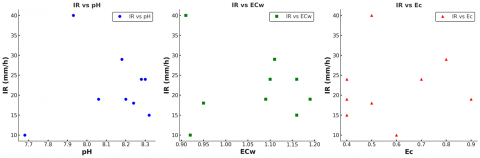
The infiltration rates observed in this study (10–40 mm/h) are notably higher than typical values reported for clay soils (3–8 mm/h). This discrepancy might be due to the local soil conditions in Al-Shehaymiyah, such as the presence of macropores or preferential flow paths, or differences in soil management practices. Further soil physical characterization would be necessary to elucidate these factors. Figure 3 expresses the relationship between IR and the pH, EC, in nine different fields.
Figure 3. Relationship between infiltration rate and soil chemical properties (pH, ECw, EC) in Al-Shehaymiyah fields
The three scatter plots show how the chemical parameters of the soil—pH, electrical conductivity of soil water (ECw), and soil electrical conductivity (EC)—affect the infiltration rate (IR) in the fields examined in Al-Shehaymiyah.
The data shows that the infiltration rate tends to go down a little bit when the pH level goes up. This is true for the relationship between the two. For example, Field 3 has the largest infiltration rate (40 mm/h) and one of the lowest pH values (7.93). Fields 2 and 8, on the other hand, have higher pH values (over 8.3) and lower infiltration rates (about 24 and 15 mm/h, respectively). But this association isn't very strong or statistically sound because there are multiple places with the same pH value that have quite different penetration rates. This means that soil pH might not be the main thing that controls infiltration in these soils, even though it might have a small effect.
It seems that the connection between ECw (electrical conductivity of soil water) and infiltration rate is a little clearer. There is a common trend that lower ECw values are generally linked to higher infiltration rates. Field 3 has the highest infiltration rate (40 mm/h) but the lowest ECw value (0.91 dS/m). Field 4, on the other hand, has a relatively low infiltration rate (19 mm/h) but the highest ECw (1.19 dS/m). This trend implies that when the soil water becomes saltier, it may slow down the pace at which water seeps into the soil. Salinity could change how soil spreads out and clogs up pores, making it harder for the soil to soak up water.
The relationship between infiltration rate and EC (bulk soil electrical conductivity) is also an inverse one. Fields with greater EC values, like Field 7 (EC = 0.9 dS/m), have lower infiltration rates (19 mm/h). On the other hand, Fields 3, 4, and 6 (0.4–0.5 dS/m) have lower EC values and are more likely to have moderate to high infiltration rates. The effect of soluble salts on the structure of soil could explain this. When there is a lot of salt in the soil, it can break up soil particles, especially in clay loams and other fine-textured soils. This makes the soil less porous and stops water from moving.
In general, none of the variables have perfect or very strong linear connections, but salinity-related factors (ECw and EC) seem to have the biggest effect on infiltration behavior, with pH having a smaller effect. This shows how complicated the interactions between soil and water are, since both chemical and physical properties affect how water moves through the soil. To get a better idea of how these findings relate to each other, more statistical correlation analysis would be needed. However, these plots show that controlling soil salinity could be quite important for letting water flow into these areas.
The high infiltration rates seen in some areas, especially those with clay soils, need more study because they are higher than what is usually expected for fine-textured soils. For instance, Field 3, which had a clay texture, had an infiltration rate of 40 mm/h, which is far higher than the range that is usually reported for clay soils (3–8 mm/h). There could be a number of reasons for this strange behavior:
The first thing to know is that the physical structure of the soil is very important for how water moves through it. Clay particles are tiny and tend to stick together readily, which makes them less permeable. However, a loose or well-aggregated soil structure can make water move much more quickly. In these circumstances, inter-aggregate pores, which are made by stable soil aggregates, allow water to flow quickly through them.
Second, the amount of organic matter, even though it wasn't precisely examined in this study, could have had an effect on how water seeped in. Adding a lot of organic matter to the soil makes it better by making aggregates more stable, making it more porous, and encouraging biological activity (such as earthworms and root pathways). These changes make macropores that go around the fine matrix, which lets water travel fast through the profile.
Another thing that could be causing this is soil cracking, especially in clay soils that go through cycles of wetting and drying. When it's dry, expanding clays crack up big holes that let water flow through them more easily. When infiltration tests are done before these cracks seal, water can get into the soil considerably faster than expected. This phenomenon is probably important in fields 1 and 3, where there is a lot of both IR and clay.
Also, gypsum content, which is above 1% in some samples (such as Fields 1, 4, and 5), might make soil structure better by encouraging clay particles to stick together. This makes the soil physically better, which also helps it hold more water.
The unexpectedly high infiltration rates seen in some clay soils (such as Fields 1 and 3) are probably due to a mix of physical and chemical causes. These include a loose or well-aggregated soil structure, which increases macroporosity; a high organic matter content, which wasn't directly measured but may have helped with better aggregation and biological macropores; and soil cracking, which happens a lot in expansive clay soils when they're dry and makes it easier for water to get in quickly. Also, the fact that gypsum is present in some profiles (more than 1% in Fields 1, 4, and 5) may help clay particles stick together, which would make the structure even more stable and help water circulate.
In conclusion, the unusually high infiltration rates in some clay-dominated areas can be explained by a mix of structural and chemical elements, such as a loose aggregate structure, a lot of organic matter, cracks that happen in the winter, and flocculation caused by gypsum. These things probably outweigh the problems that come with having a fine texture on their own, and they show how complicated it is for water to travel in the field.
The Relationship Between Soil Structure and Function in Changes in Infiltration Rate (IR)
The nine fields in Al-Shehaymiyah had very different infiltration rates (IR), ranging from 10 mm/h to 40 mm/h. This is because the soil texture, structure, and moisture levels were different at each site. The high IR in Field 3 (40 mm/h) and the low IR in Field 5 (10 mm/h) show that the soil's structure is different in each field, with cracks, root paths, and total soil porosity being the main differences. These factors affect the link between soil structure and function, which affects how well water can get into the soil.
Soil Structure and High IR: In fields with high IR, like Field 3, fissures in the earth help water move quickly. These fissures commonly happen in soils that are dry or shrink because of high temperatures or particular types of soil, such as clayey soils. When there are fissures in the soil matrix, it is easier for water to pass through it. Root pathways in these fields also help water move through the soil faster by forming macropores that act as channels for water, speeding up the process. This increased infiltration might be the reason why Field 3 had a greater IR.
Low IR and Compacted Soil: Fields with lower IR, like Field 5, on the other hand, probably have denser soil structures that can make it harder for water to move. Soil compaction or lower porosity, for example, might make it harder for fissures or root channels to form, which would make it harder for water to get in. When soils are compacted, water has to work harder to get through them, and the pace at which it gets through them goes down. Therefore, the decreased IR in Field 5 is likely a result of such limiting soil conditions.
Water Content and Infiltration: The IR is also affected by how wet the earth is when it is measured. Drier soils tend to have higher IR because they fracture and lose surface tension, which makes it easier for water to get in. In Field 5, for example, wetter soils already have more moisture in them, which fills the pore spaces and makes it harder for extra water to get into the soil. This lowers the IR.
Measuring the Structure of Soil: It would be helpful to measure the amount of cracks and the density of root paths in each field to better understand how soil structure influences IR. You may use digital imaging techniques or soil coring to look at the patterns of cracks, the distribution of roots, and the porosity of the soil. This would give you an idea of the structural aspects that affect infiltration. These structural parts are probably the main reason why the IR values are different across the fields.
In conclusion, the high IR in Field 3 (40 mm/h) may be because the soil structure is better for quick infiltration, potentially because of fissures, root routes, and the right amount of moisture. The low IR in Field 5 (10 mm/h), on the other hand, shows that the soil is more compacted or solid, which makes it harder for water to get in. The fact that infiltration rates vary from field to field shows how important soil structure and moisture content are for how well water can get into the ground.
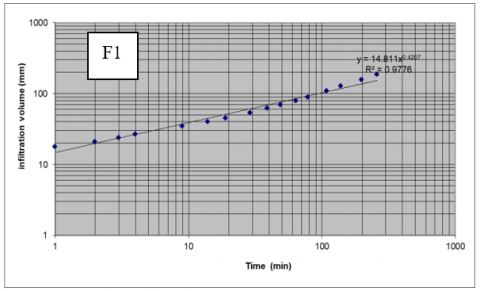
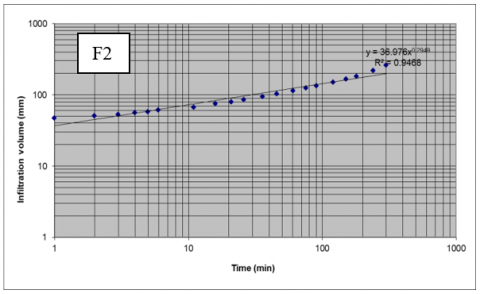
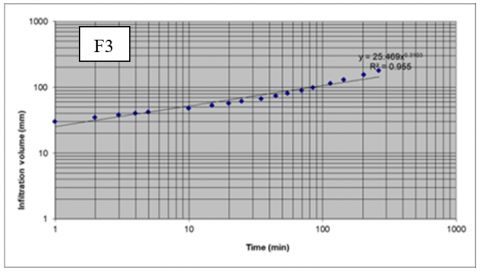
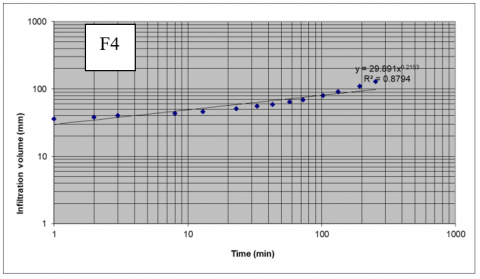
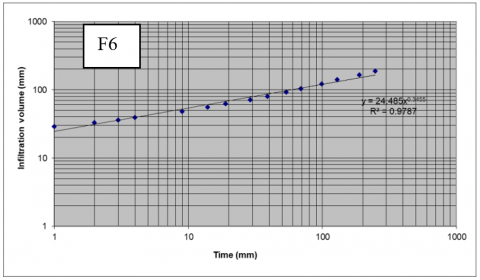
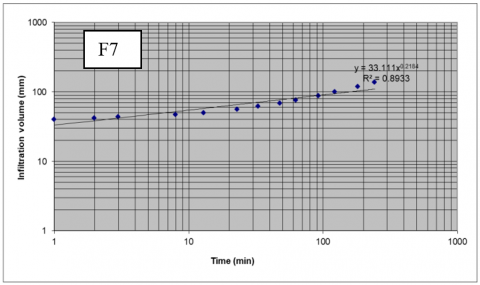
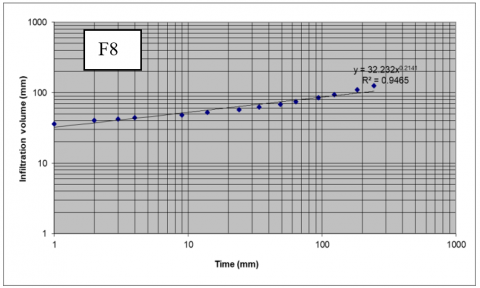
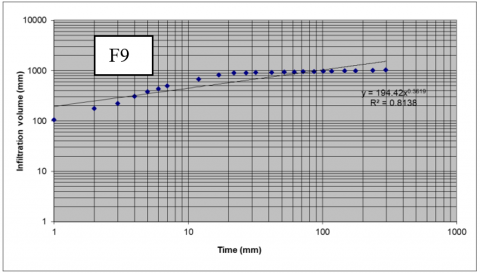
Figure 4. IR graphs of nine fields
The nine infiltration curves in Figure 4 (F1 to F9) show how much water has seeped into each field in the Al-Shehaymiyah region over time. This was done with a double-ring infiltrometer. On the x-axis, you can see time (in minutes), and on the y-axis, you can see cumulative infiltration (in mm). This logarithmic graph makes it easier to see how infiltration changes over time, especially when it slows down, which is common in cohesive soils like clay.
We used a power function model of the type to match each curve:
$I=a T^b$
where,
I = cumulative infiltration (mm)
T = time (minutes)
a, b = empirical fitting parameters specific to each field
The coefficient of determination (R²) values for all fields were consistently high (usually R² > 0.95), which shows that the power function fits the infiltration data quite well for all soil types. Fields with higher infiltration rates, like F3 and F1, tend to have steeper curves, which means that the volume of water that seeps in rises more quickly over time. These sites probably have good soil structure, probable cracking, or more macroporosity. The curves in fields like F5, F8, and F9 were flatter, which meant that the infiltration rates were lower. These could be because of finer soil textures (such as silty clay loam) or layers of soil that are packed down, which makes it harder for water to travel. The exponent b in the model shows how quickly infiltration slows down over time. In clayey soils, b is generally smaller than 1, which fits with what we see happening as soil pores fill up slowly.
The way the water moves through the nine fields shows that the hydraulic qualities of the soil in the area vary from place to place. Even though the texture categories are largely clay or silty clay, the curves are very different, which suggests that characteristics peculiar to the field, such as:
Cracks in the soil because it dried out,
Root channels and living things,
The amount of gypsum and past ways of watering could have a big impact on how well infiltration works [28].
It is important to understand these dynamics in order to create irrigation plans that work in specific fields, especially when there isn't enough water. Drip or targeted irrigation could help areas that soak up water quickly, while fields that soak up water slowly might need to be prepared or changed to let water in better.
The infiltration rates measured in Al‑Shehaymiyah (10–40 mm/h) are often higher than those found in regional studies in Iraq. For instance, Al Maimuri [29] found that average penetration rates in irrigated dry soils in the Hashimiya area of central Iraq were between X and Y mm/h. The hydrologic groups are used to classify soils in southern Iraq (Missan Governorate). The infiltration capacities of these groups were similar to those of Groups C–D, which have slow to extremely slow infiltration. These comparisons show that the soils of Al-Shehaymiyah let water through much faster. This is probably because the soil structure is different, gypsum makes the soil clump together better, and the soil cracks in the winter.
In Al-Shehaymiyah, the infiltration rates for clay and silty clay soils are much higher than in other studies done in Iraq. Al Maimuri [29] found that the infiltration rates (IRs) in Hashimiya's clay loam soils ranged from 3.5 to 12.1 mm/h. The current study, on the other hand, found rates between 10 and 40 mm/h. Muneer et al. [30] found IRs of 15–35 mm/h in the coarser-textured soils of the Iraqi Western Desert, which are similar to the highest values we found. These discrepancies could be because the soil cracks in the winter, there is a lot of gypsum that makes flocculation easier, or the amount of organic matter and how the land is managed change [31]. Table 4 shows the details for the comparative analysis of infiltration rate studies in Iraq.
Table 4. Comparative analysis of infiltration rate studies in Iraq
|
Study |
Location |
Soil Type |
Infiltration Rate (IR) |
Comparison with Al-Shehaymiyah |
|
Al Maimuri [29] |
Hashimiya (Central Iraq) |
Clay Loam, Silt Loam |
3.5–12.1 mm/h |
Lower IRs than Al-Shehaymiyah, likely due to denser structure and lower gypsum or organic matter. |
|
Muneer et al. [30] |
Western Desert, Iraq (semi-arid wadis) |
Loam, Sandy Loam |
15–35 mm/h |
Comparable to your higher IRs, though in coarser soils. Shows how texture impacts IR. |
|
This work |
Al-Shehaymiyah, Central Iraq |
Clay, Silty Clay, Clay Loam |
10–40 mm/h (avg. ~22 mm/h) |
Higher than expected for clay soils; possible causes include soil cracking, gypsum content, and field management. |
Soil Structure and Cracking: Clay soils in Al-Shehaymiyah, especially during dry seasons, are likely to crack, which makes them easier for water to flow through. This makes them better at soaking up water than more compacted or fine-textured clays in Missan or Hashimiya.
Gypsum and Flocculation: The amount of gypsum in Al-Shehaymiyah fields (up to 1.97%) helps soil aggregates stick together and stay stable. This can make macroporosity better, which is why infiltration is higher than in soils with less gypsum [32].
Land Management and Organic Matter: It is not tested, but tillage, organic inputs, and crop cycles in irrigated fields may have made the soil more porous and active, which might have led to higher IRs.
This study looked at how well soils in nine agricultural areas in Al-Shehaymiyah, Central Iraq, let water seep in. Field 3 with the highest rate (40 mm/h) is clay, while field 5 with the lowest IR (10 mm/h) is silty clay. Infiltration rates (IR) with the highest rates found in areas with clay textures. This suggests that site-specific factors, including surface cracking, soil structure, and gypsum content, had an effect. There was a slight inverse relationship between IR and soil pH, EC, and ECw, which means that chemical soil parameters alone don't entirely explain how water moves through the soil. When compared to other parts of Iraq, such as Missan and Hashimiya, Al-Shehaymiyah's soils have better infiltration capacity, especially in fine-textured soil classes. This means that things like adding nutrients to the soil, changing the shape of the land, or the history of irrigation in the area may have a big effect on how much water can get into the ground.
Water infiltration: Depending on the type of soil, different rates of infiltration occurred. Given the rate of infiltration, it is clear that sandy soils require the lowest application rate but a higher frequency as a result of their low capacity to store water, while loamy soils represent a more flexible soil in terms of the rate of application rate as well as the frequency. Clay soils require higher rates of water application but with the lowest frequency as a result of their high capacity of storing capacity. We notice that the rates of infiltration are higher than the typical rates of water infiltration through this type of soil, which is clay soil, across the shifting fields. When its pores enlarge, its particles clump together, and its filtration rates increase over and beyond what is considered typical. The irrigation technique also affects how the water flows. Because the entire soil surface is irrigated and lateral movement is not required, irrigation by aspersion (sprinkler) causes infiltration vertically; in contrast, irrigation via drip irrigation causes infiltration vertically as well as horizontally.
To manage water effectively, the farmers must utilize irrigation systems having an application rate proportional to the rate of plant requirements as well as the soil infiltration. Knowing the plant requirements as well as the soil's capacity for infiltration and storage will make it simple to select an irrigation system that will meet those requirements in the particular soil conditions.
In practice, the results give a suitable starting point for managing water for farming in the area. The fact that infiltration rates vary supports the suggestion to use micro-irrigation or localized irrigation systems that may be adjusted to fit the infiltration capacity of each field. These kinds of focused plans would make better use of water, lower runoff losses, and assist in managing scarce water resources in a way that lasts in places like Al-Shehaymiyah, which are only semi-arid.
Several management recommendations are made based on the disparities in infiltration rate (IR) that were seen across the fields. Field 3, which has an IR of 40 mm/h and is made up of silty loam, is good for drip irrigation since it will send water to the root zone quickly and with little surface runoff. Field 5, on the other hand, has an IR of 10 mm/h and is made of clay. To make the soil less compact and let more water in, it needs to be aerated, have organic matter added, and be subsoiled. For fields with moderate IR values, like Field 7 (silty clay loam), it is best to use mulching and plan irrigation so that moisture is kept and evaporation losses are kept to a minimum.
The authors would like to thank the staff of the College of Agriculture's Soil and Water Department for all the help they gave them while they were doing field and lab work. We would like to thank the farmers in Al-Shehaymiyah for their help and for letting us use their land for the study.
[1] Karahan, G., Yalım, Y.Ş. (2022). Evaluation of the relationship between infiltration rate and some soil properties under different land-use. Yuzuncu Yıl University Journal of Agricultural Sciences, 32(3): 623-634. https://doi.org/10.29133/yyutbd.1130123
[2] Akbari, M., Gheysari, M., Mostafazadeh-Fard, B., Shayannejad, M. (2018). Surface irrigation simulation-optimization model based on meta-heuristic algorithms. Agricultural Water Management, 201: 46-57. https://doi.org/10.1016/j.agwat.2018.01.015
[3] Khasraghi, M.M., Sefidkouhi, M.A.G., Valipour, M. (2015). Simulation of open-and closed-end border irrigation systems using SIRMOD. Archives of Agronomy and Soil Science, 61(7): 929-941. https://doi.org/10.1080/03650340.2014.981163
[4] Fuentes, S., Fuentes, C., Saucedo, H., Chávez, C. (2022). Border irrigation modeling with the barré de Saint-Venant and Green and Ampt equations. Mathematics, 10(7): 1039. https://doi.org/10.3390/math10071039
[5] Hillel, D. (2004). Introduction to Environmental Soil Physics. Elsevier Academic Press.
[6] Bouwer, H. (2000). Integrated water management: Emerging issues and challenges. Agricultural Water Management, 45(3): 217-228. https://doi.org/10.1016/S0378-3774(00)00092-5.
[7] Russo, T., Alfredo, K., Fisher, J. (2014). Sustainable water management in urban, agricultural, and natural systems. Water, 6(12): 3934-3956. https://doi.org/10.3390/w6123934
[8] Cueff, S., Coquet, Y., Aubertot, J.N., Bel, L., Pot, V., Alletto, L. (2021). Estimation of soil water retention in conservation agriculture using published and new pedotransfer functions. Soil and Tillage Research, 209: 104967. https://doi.org/10.1016/j.still.2021.104967
[9] Yin, W., Yang, X., Liu, W. (2025). Sustainable management and regulation of agricultural water resources in the context of global climate change. Sustainability, 17(6): 2760. https://doi.org/10.3390/su17062760
[10] Ayers, R.S., Westcot, D.W. (1994). Water quality for agriculture (FAO Irrigation and Drainage Paper No. 29 Rev. 1). Food and Agriculture Organization of the United Nations. https://www.fao.org/4/t0234e/t0234e00.htm.
[11] Unger, P.W., Schwartz, R.C., Baumhardt, R.L., Xue, Q. (2023). Soil water conservation for dryland farming. In Soil and Drought. CRC Press. https://doi.org/10.1201/b22954-2
[12] Razvanchy, H.A.S., Fayyadh, M.A. (2023). Study soil development and classification in Erbil Province, Kurdistan, Iraq using mathematical indices. Iraqi Journal of Agricultural Sciences, 54(6): 1802-1813. https://doi.org/10.36103/ijas.v54i6.1879
[13] Rasheed, S.A., Al-Adil, A. (2016). Sprinkler irrigation systems and water saving, a case study from South of Iraq. Engineering and Technology Journal, 34(4): 769-786.
[14] Al Marsumi, K.J., Al Shamma, A.M. (2017). Classification of soil infiltration rate depending on the Hydrological soil group map South East Iraq. Iraqi Journal of Science, 58(4B): 2165-2171. https://doi.org/10.24996/ijs.2017.58.4B.19
[15] Abdel-rahman, A.M., Ali, G.A., Hamed, M.H. (2022). Modelling and digital mapping of the infiltration characteristics of major agricultural soils. International Journal of Thin Film Science and Technology, 11(1): 133-141.
[16] Golestani Kermani, S., Sayari, S., Kisi, O., Zounemat-Kermani, M. (2019). Comparing data driven models versus numerical models in simulation of waterfront advance in furrow irrigation. Irrigation Science, 37(5): 547-560. https://doi.org/10.1007/s00271-019-00635-5
[17] Chavez, C., Fuentes, C. (2019). Design and evaluation of surface irrigation systems applying an analytical formula in the irrigation district 085, La Begoña, Mexico. Agricultural Water Management, 221: 279-285. https://doi.org/10.1016/j.agwat.2019.04.027
[18] Yun, J., Kou, Q., Zhang, W. (2018). Comparative analysis of soil infiltration under three types of land use. In 2018 7th International Conference on Energy, Environment and Sustainable Development (ICEESD 2018), Shenzhen, China, pp. 1787-1791. https://doi.org/10.2991/iceesd-18.2018.322
[19] Dunne, T., Dietrich, W.E. (1980). Experimental study of Horton overland flow on tropical hillslopes. Journal of Geomorphology, 35: 40-59.
[20] Bradford, J.M., Ferris, J.E., Remley, P.A. (1987). Interrill soil erosion processes: I. Effect of surface sealing on infiltration, runoff, and soil splash detachment. Soil Science Society of America Journal, 51(6): 1566-1571. https://doi.org/10.2136/sssaj1987.03615995005100060029x
[21] Valentin, C., Bresson, L.M. (1992). Morphology, genesis and classification of surface crusts in loamy and sandy soils. Geoderma, 55(3-4): 225-245. https://doi.org/10.1016/0016-7061(92)90085-L
[22] Xuan, K., Li, X., Zhang, J., Jiang, Y., Ma, B., Liu, J. (2023). Effects of organic amendments on soil pore structure under waterlogging stress. Agronomy, 13(2): 289. https://doi.org/10.3390/agronomy13020289
[23] Torres-Quezada, E., Fuentes-Peñailillo, F., Gutter, K., Rondón, F., Marmolejos, J.M., Maurer, W., Bisono, A. (2025). Remote sensing and soil moisture sensors for irrigation management in Avocado Orchards: A practical approach for water stress assessment in remote agricultural areas. Remote Sensing, 17(4): 708. https://doi.org/10.3390/rs17040708
[24] Leonard, J., Andrieux, P. (1998). Infiltration characteristics of soils in Mediterranean vineyards in Southern France. Catena, 32(3-4): 209-223. https://doi.org/10.1016/S0341-8162(98)00049-6
[25] Schwartz, F.W., Zhang, H. (2003). Fundamentals of Groundwater. John Wiley & Sons.
[26] Dingman, S.L. (2015). Physical Hydrology. Waveland Press Inc.
[27] Haise, H.R. (1956). The Use of Cylinder Infiltrometers to Determine the Intake Characteristics of Irrigated Soils. Agricultural Research Service and Soil Conservation Service, US Department of Agriculture.
[28] Johnson, A.I. (1963). A field method for measurement of infiltration (No. 1544-F). USGPO. https://doi.org/10.3133/wsp1544F
[29] Al Maimuri, N.M. (2018). Applicability of Horton model and recharge evaluation in irrigated arid Mesopotamian soils of Hashimiya, Iraq. Arabian Journal of Geosciences, 11(20): 610. https://doi.org/10.1007/s12517-018-3986-4
[30] Muneer, A.S., Sayl, K.N., Kamal, A.H. (2021). Modeling of spatially distributed infiltration in the Iraqi Western Desert. Applied Geomatics, 13(3): 467-479. https://doi.org/10.1007/s12518-021-00363-6.
[31] Muhammed, M.A., Jasim, N.A., Mohammed, Z.J., Rahi, M.N. (2025). Experimental evaluation of abrasion resistance in hydraulic structures using recycled cement-asphalt materials. International Journal of Design & Nature and Ecodynamics, 20(5): 1069-1080. https://doi.org/10.18280/ijdne.200512
[32] Shamkhi, M.S., Jasim, N.A. (2020). The study of discrete settling velocity for raw water of Tigris River in Kut by settling column. Key Engineering Materials, 870: 123-132.