Mohammad Habibiy Idmi![]() | Adi Susilo*
| Adi Susilo*![]() | Alamsyah M. Juwono
| Alamsyah M. Juwono![]() | Sukir Maryanto
| Sukir Maryanto![]() | Muwardi Sutasoma
| Muwardi Sutasoma![]() | Faridha Aprilia
| Faridha Aprilia![]() | Muhammad Fathur Rouf Hasan
| Muhammad Fathur Rouf Hasan![]() | Rony Prianto Nugraha
| Rony Prianto Nugraha![]()
© 2025 The authors. This article is published by IIETA and is licensed under the CC BY 4.0 license (http://creativecommons.org/licenses/by/4.0/).
OPEN ACCESS
Songgokerto, a Batu City, Indonesia subdistrict, features diverse topographical variations dominated by mountainous and valley landscapes. According to the 2024 data from the Regional Disaster Management Agency (BPBD) of Batu City, landslides frequently occur along Trunojoyo Road in Songgokerto. This road serves as a major transportation route connecting several key cities in East Java, including Batu City, Malang Regency, Kediri City, and Jombang Regency. Landslides in this region often lead to complete road closures, disrupting economic activities and raising safety concerns for travelers. The economic stagnation caused by blocked road access poses significant financial losses for the local government, as Batu City’s revenue (PAD) primarily relies on agriculture and tourism, both of which depend on access through Trunojoyo Road. Geological methods provide valuable information about the distribution of rock formations locally. Geological mapping of the study area identified several rock units, including volcanic deposits, lava flows, Kawi-Buthak volcanic breccia, tuff deposits, and upper Quaternary volcanic breccia. Geophysical methods used in this study include gravity and magnetic surveys. The advanced method used is the minimum curvature inversion method. The gravity can detect faults using residual anomaly maps, with high values ranging from 0.1 to 3.0 mGal, moderate values from -0.8 to -0.09 mGal, and low values from -3.9 to -0.9 mGal. Meanwhile, the magnetic method provides insights into hydrothermal alteration by analyzing residual magnetic anomaly maps, ranging from -387.1 nT to 401.9 nT. Integrating geological and geophysical methods can establish a correlation between hydrothermal alteration zones and landslide activity. The correlation results between gravity, magnetic, and geological methods reached 99.4%, hydrothermal alteration zones and landslide activity had a correlation of up to 99.8%. The results indicate that both methods validate each other, yielding an accurate alteration map. Further correlation of this alteration map with landslide occurrences supports the hypothesis that hydrothermal alteration contributes to the landslides in the study area. Periodic reviews every year to obtain periodic data and references for government mitigation plans.
geology, landslide, hydrothermal alteration, Batu City, Geomagnetics, gravity
Indonesia is located within the Pacific Ring of Fire, making it highly prone to natural disasters [1]. These disasters vary from volcanic activity, earthquakes, wildfires, landslides, flash floods, and soil movements [2]. Volcanic and geothermal areas are particularly susceptible to geological hazards, especially landslides [3]. The primary factors contributing to landslides include slope inclination, rainfall intensity, lithology type, and fault presence [4]. In some cases, landslides occurring in hydrothermally altered zones cause significant damage, including infrastructure destruction, ecosystem disruption, economic losses, and loss of human life [5]. In geothermal regions, in addition to steep slopes, landslides can also be triggered by rock alteration. Rock alteration occurs when the mineralogical composition of rocks changes due to exposure to high temperatures and pressures in a non-isochemical environment [6].
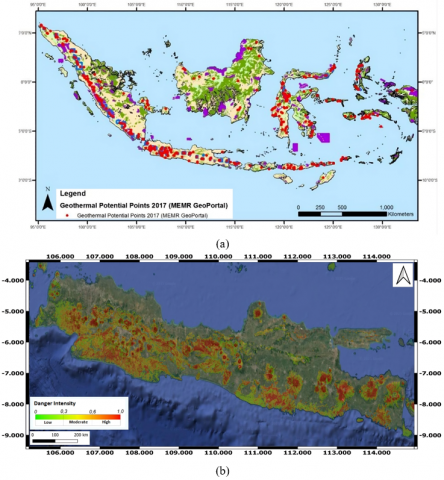
The distribution of landslides and geothermal energy in Indonesia provides information on the distribution of landslide and geothermal potential, especially on the island of Java. Figures 1(a) and 1(b) provide information on the correlation between the distribution of landslide zones and the distribution of geothermal zones. The distribution zones of landslides and geothermal energy show the same distribution area, which can be evidence that the potential for landslides can also be influenced by geothermal or hydrothermal energy. The landslide distribution map has a scale of 0 (low) to 1 (high), where green indicates low landslide potential and red indicates high landslide potential. Meanwhile, on the geothermal distribution map, the red area is the point where geothermal or hydrothermal energy occurs.
Figure 1. (a) Distribution of Indonesia's geothermal potential [7], (b) Distribution of landslide hazards on Java Island [8]
Batu City covers an area of approximately 194.2 km² with a total population of 213,046 people [9]. The city’s geomorphology is dominated by hills and valleys, with elevations ranging from 600 to 3,337 meters above sea level and steep slopes. Slope inclination has been identified as a major contributing factor to landslides, as demonstrated in a study by Riestu and Hidayat [10], which found that slope inclination and land-use changes significantly contributed to landslides in Batu City. According to data from the Regional Disaster Management Agency (BPBD) of Batu City, in 2024, 50 natural disasters were recorded, with landslides being the most frequent. Specifically, Batu City experienced 49 natural disasters, including 21 landslides, 15 extreme weather events, 2 cases of land subsidence, and 7 flash floods. This makes Batu City one of the most disaster-prone areas in Indonesia, particularly along Trunojoyo Road, a critical landslide-prone zone. Trunojoyo Road is a major transportation route connecting several major cities in East Java, including Batu City, Malang Regency, Kediri City, and Jombang Regency. Landslides frequently block road access, disrupting economic activities in affected areas. The economic stagnation caused by these road closures poses significant financial losses for the local government, as Batu City’s revenue (PAD) largely depends on agriculture and tourism, which rely on Trunojoyo Road [11].
The correlation between landslide-prone areas and hydrothermal alteration zones can be linked to rock alteration, which modifies the mineral composition of igneous rocks [12]. However, the detailed mechanisms and implications of hydrothermal alteration on landslide susceptibility remain underexplored, presenting a significant research gap. Theoretically, hydrothermal alteration results in prolonged heat exposure, affecting rock density [13]. Low-density rocks generally exhibit high porosity [14], allowing water infiltration and leading to water saturation. When rock layers become water-saturated, they are more susceptible to landslides [15]. This hypothesis highlights the need for further investigation.
In geothermal regions, hydrothermal fluids alter the magnetic properties of rocks through a process known as demagnetization [16]. The reduction in rock magnetization due to hydrothermal alteration leads to the formation of paramagnetic and diamagnetic minerals. These magnetic property changes can be detected using magnetic surveys, effectively mapping hydrothermal alteration zones [17]. The gravity method is an initial step in determining the geological structures controlling hydrothermal alteration. Subsequently, the magnetic method is applied to identify the spatial distribution of hydrothermal alteration. Geological mapping is conducted to characterize the lithology of the study area, resulting in a localized geological map. The models obtained from gravity and magnetic methods, combined with geological data, are then analyzed to establish a correlation between landslide-prone areas and hydrothermal alteration zones. This integrated [7] approach is essential for disaster mitigation planning.
Geophysical methods are widely used in landslide investigations [18]. These methods utilize various physical properties to effectively image subsurface layers, including fault structure mapping, slip plane identification, and assessing potential mineral deposits. Landslides are generally caused by multiple factors, such as slope inclination, rainfall intensity, lithology type, and fault presence [19]. However, in specific cases, landslides can also result from hydrothermal alteration in certain areas. Hydrothermal alteration can be detected using geophysical methods, particularly gravity and magnetic surveys, along with geological mapping to delineate the extent of alteration zones. Numerous studies have applied geophysical methods to landslide investigations, ranging from single-method approaches to multi-method analyses. However, most research has primarily focused on hazard assessment and mapping high-susceptibility zones rather than investigating the underlying causes of landslide vulnerability. Existing studies typically attribute landslide susceptibility to general factors such as weather conditions, slope inclination, slip planes, and soil composition.
Gravity surveys offer a significant advantage as an initial investigation tool, providing detailed information about geological structures and subsurface density contrasts [20]. The gravity method is widely applied in mapping density variations beneath the surface [21]. It measures variations in the Earth’s gravitational field caused by differences in rock mass density [22]. Higher measured gravity anomalies indicate the presence of denser rock formations. This characteristic makes gravity data reliable for modeling subsurface density contrasts, which can help identify potential landslide slip planes [23].
Previous studies in the Songgoriti area of Batu City, conducted by Maryanto [24], identified the Songgokerto Subdistrict as a geothermal area with hydrothermal alteration. Hot spring manifestations near Trunojoyo Road in Songgokerto further support this. The study employed seismic-gravity methods as an initial geothermal exploration approach. Gravity methods were used to model structural controls of the geothermal system, while seismic methods were utilized to estimate the reservoir source’s position. Analysis from Maryanto’s study estimated that the geothermal system in Songgoriti has an epicenter at depths ranging from 22 to 94 meters. A recent study by Hasan et al. [25], utilizing the GGMplus gravity method, indicated a high landslide susceptibility along Trunojoyo Road in Songgokerto.
Geological and hydrothermal alteration mapping is crucial to validating analytical results. Geological mapping defines the distribution of rock units within the study area, providing essential lithological information that supports the research findings. Hydrothermal alteration mapping, as an extension of geological mapping, identifies the spatial extent of hydrothermally altered rocks. This data is then correlated with magnetic survey results to ensure accuracy. Analyzing the relationship between landslide activity and hydrothermal alteration is necessary because Songgokerto exhibits unique landslide-triggering factors compared to other regions. Hydrothermal alteration in this area may contribute to increased landslide susceptibility. The research methodology includes an initial study to identify geological structures and rock density using the gravity method, followed by further investigations using magnetic and geological methods to classify rock units and map hydrothermal alteration zones. The hydrothermal alteration distribution map is then utilized to analyze the relationship between landslides and hydrothermal alteration, contributing to disaster mitigation efforts.
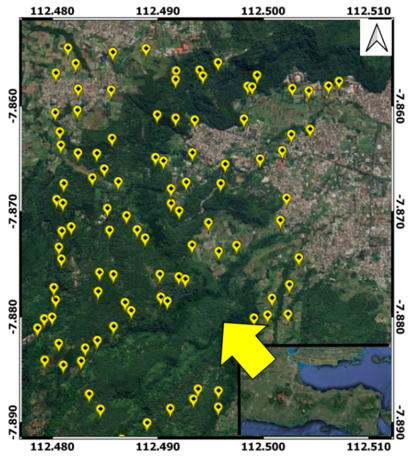
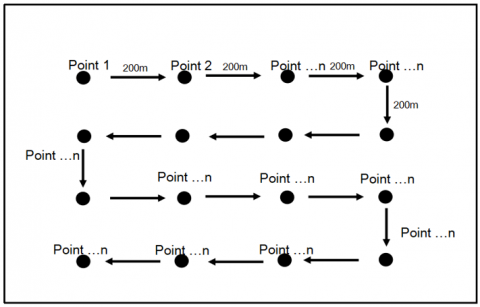
The data was acquired in Songgokerto, Batu District, Batu City, East Java. The survey area covered approximately 3 × 4 km², strategically located as a connecting region between several major areas in East Java, including Malang Regency, Kediri City, and Jombang Regency. Gravity measurements were carried out using direct field measurements, with the spacing between survey points varying from 200 to 500 meters, as illustrated (see Figure 2). The measurement method was designed based on field conditions and the survey area’s extent to ensure representative data coverage for each measurement point.
Figure 2. Gravity survey design
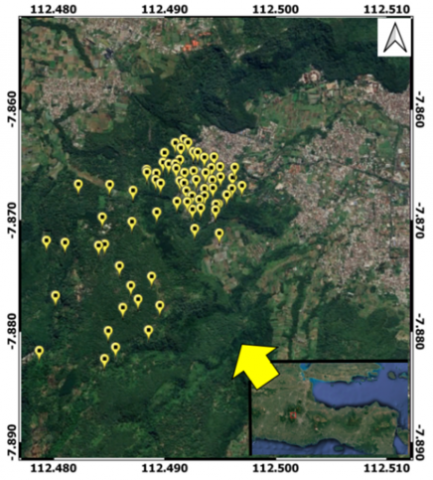
The second measurement used the magnetic method, covering the same 3 × 4 km² area, as shown (see Figure 3). The spacing between measurement points for the magnetic survey was denser than the gravity method, approximately 250 meters. This denser spacing was chosen due to the relative ease of acquisition of magnetic data compared to gravity measurements, allowing for more data points. Additionally, the difference in data acquisition density was influenced by the distinct objectives of the two methods. The gravity method was primarily used to determine geological structures, whereas the magnetic method aimed to map the distribution of hydrothermal alteration, requiring higher-resolution data for greater detail.
Figure 3. Magnetic survey design
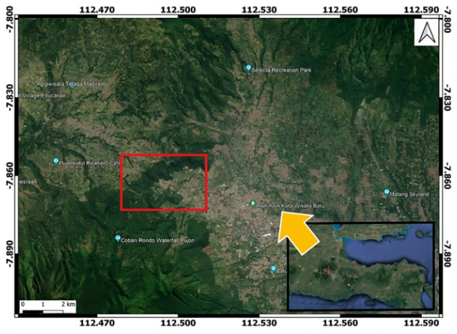
Figure 4. Geological mapping survey design
The location of the hydrothermal alteration mapping research is in the same location as the gravity and magnetic methods, with an area of 3 × 4 km (see Figure 4). Geological mapping and hydrothermal alteration were carried out to determine the distribution of rock units and hydrothermal alteration in more detail and locally to become supporting data in the interpretation of magnetic and gravity methods. Geological mapping has several stages that need to be carried out, such as making lineament maps, contour maps, and morphological maps. After the base map is presented, a direct review can be carried out by tracing the entire research area that has been determined. In field observations, several things need to be noted, namely slope gradient, landform, rock type, structure, hydrothermal alteration, strike, and dip [26]. The results obtained can be analyzed and processed using QGIS software so that they become a single geological map.
The gravity method is a geophysical technique that measures variations in the Earth’s gravitational field (gravitational acceleration) due to differences in subsurface rock density [27]. Variations in rock density create deviations in the measured gravitational field, known as gravity anomalies. The gravitational acceleration experienced by a mass can be derived by substituting Newton’s Law of Universal Gravitation with Newton’s Second Law of Motion. Consequently, the gravitational acceleration is expressed by Eq. (1):
$g=G \frac{M 1}{R^2} \hat{r}$ (1)
The value of g represents the gravitational acceleration or gravitational field of the Earth as experienced by a mass (M₁) at a given point outside the Earth. The Earth’s mass (M₁) and the object’s mass (M₂) are measured in kilograms (kg), while R represents the Earth’s radius in meters (m). G is the universal gravitational constant with a value of 6.6732 × 10⁻¹¹ N m²/kg², and r̂ denotes the unit vector of R [28].
Variations in gravity anomalies occur due to differences in subsurface density. The gravity anomaly value is defined as the difference between the observed gravitational acceleration at a location (g_Obs) and the theoretical gravitational acceleration at the exact location (g_Theoretical). Observed gravitational acceleration is obtained from field measurements and converted to Gal. Temporal corrections, including tidal and drift corrections, are applied to account for time-dependent variations. On the other hand, theoretical gravitational acceleration is calculated by applying spatial corrections, such as latitude correction, free-air correction, Bouguer correction, and topographic correction [27].
Several factors influence gravity measurements in the field, including the shape of the Earth, terrain conditions, and data acquisition time. These factors cause deviations between measured values and actual subsurface conditions. As a result, gravity readings vary across different surface points and require multiple corrections, including drift correction, tide correction, latitude correction, free-air correction, Bouguer correction, and terrain correction. After applying these corrections, derivative analysis determines geological boundaries, such as faults or fractures. First, Horizontal Derivative (FHD) analysis is used to highlight the edges of geological structures, while Second Vertical Derivative (SVD) analysis provides an accurate estimate of their locations [29].
The magnetic method operates based on the contrast in rock magnetization, which arises from Earth’s induced magnetic field and permanent rock magnetization. The strength of magnetic induction depends on rock susceptibility, Earth’s magnetic field intensity, and the rock’s permanent magnetization, which is influenced by its geological history. The magnetic method is a geophysical technique primarily used for preliminary subsurface exploration [30]. Magnetic surveys involve measuring the Earth’s magnetic field across the study area to map local magnetic anomalies caused by variations in subsurface rock magnetism. When a material is placed within an external magnetic field (H), it undergoes magnetization, realigning its atomic magnetic moments. The change in atomic alignment results in the formation of a new magnetic field (M). The magnetic field H is proportional to the induced magnetic field M, which is influenced by the material’s magnetic susceptibility (I). Mathematically, this relationship is expressed as Eq. (2):
$M=k H$ (2)
Magnetization M value is the magnetic moment in units of volume (A/m), k = magnetic susceptibility indicates the ability of the material to become magnetized, and H = external magnetic field with units (A/m). The magnetic method presents greater interpretation challenges than the gravity method, primarily due to the influence of both the Earth’s magnetic field and external magnetic fields. These external factors must be corrected using several techniques, including diurnal correction and International Geomagnetic Reference Field (IGRF) correction [31]. After applying these corrections, the data—consisting of coordinates, total magnetic field intensity values, and elevation—are processed using Oasis Montaj software. The processing generates a 2D model of the Total Magnetic Intensity (TMI) map, created using the minimum curvature gridding method to produce an anomaly map. Minimum curvature inversion produces a fine grid of distinct points, resulting in splined or smooth data. This inversion has the advantage of smoother results, suitable for use in spatial relationships between geophysical and geological data, and minimal distortion. Since the TMI map still exhibits dipolar effects, a reduced-to-pole (RTP) filter is applied to eliminate these distortions.
Map 2D sectioning approach is used to extract values along different survey lines, which are then used to construct a 3D model using ZondGM3D software. The extracted section data include longitude, latitude, elevation, and magnetic anomaly values, which serve as inputs for 3D modeling. Within ZondGM3D, the input data is processed by setting parameters and performing an inversion to generate a subsurface model, which is then correlated with geological information from the study area. Finally, the susceptibility values obtained from the model are compared with reference values from existing literature to validate the geological interpretation.
Data collection is carried out in the field directly using several different parameters. The gravity method uses the parameter (ρ), density (kg/m³), the magnetic method (k) (dimensionless), depth/thickness (m), (dip) slope (m), (φ) porosity (% pore volume/total volume), (κ) Permeability (m²). While sampling intervals between points vary from 10 to 50 m for geology, 200 to 500 m for gravity methods, and magnetic methods consist of 100 to 250 m, the difference in determining points is influenced by the terrain in the field.
Figure 5. Ground Control Points layout plan
The GCP layout plan (Figure 5) is used to describe the distance between data points, the direction of data collection, survey paths, or quality control. In the figure, Ground Control Points were created to obtain magnetic and gravity method data in the field with a distance between points of 200 m. The final results that have been achieved are different from the GCP layout plan, which is caused by the terrain that varies from valleys to steep hills, so it is not possible to collect data. The solution is to take data as close as possible to the data that cannot be accessed, so that in processing, it can allow data interpolation in that area.
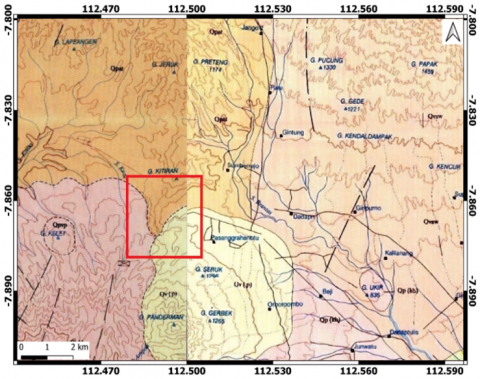
The geological conditions of Batu City are mapped in the Geological Map of the Kediri Sheet (1992) and the Geological Map of the Malang Sheet, as shown (see Figure 6). The study area comprises three primary geological formations:
• Old Anjasmara Volcanic Rock Formation (Qpat)
• Kawi-Butak Volcanic Rock Formation (Qpkb)
• Upper Quaternary Volcanic Rock Formation (Qv(p))
These formations characterize the geological structure of the region and play a crucial role in understanding the area’s landslide susceptibility and hydrothermal alteration processes.
Figure 6. Regional geological map of Batu City (Kediri Sheet) [32]
The study area is at the intersection of three distinct geological formations, as shown (see Figure 6). The northern region is part of the Old Anjasmara Volcanic Rock Formation (Qpat), which consists of volcanic breccia, lava, tuff, and dikes. The Kawi-Butak Volcanic Rock Formation (Qpkb) dominates the western region and is characterized by volcanic breccia, lava, tuff, and lahar deposits. The southern region belongs to the Upper Quaternary Volcanic Rock Formation of Mount Panderman (Qvp), which includes volcanic breccia, tuff breccia, lava, and tuff. The Batu region and its surroundings are classified as hilly and mountainous Quaternary terrain. The Songgoriti area predominantly comprises volcanic deposits from Mount Kawi and Mount Panderman, mainly consisting of andesitic lava and pyroclastic rocks. Additionally, Songgoriti directly borders older andesitic and basaltic rocks from Mount Anjasmoro, which form the structural foundation of the region [33].
4.1 Geological and hydrothermal alteration mapping
Determining the correlation between geophysical and geological methods is done quantitatively by calculating the parameters of both methods and then using the Pearson correlation. This correlation is used to measure the strength or direction of the linear relationship between two different variables. It is very suitable for use because the parameters of the gravity, magnetic, and geological methods show different parameters. The Pearson equation can be seen in the Eq. (3) [34]:
$r=\frac{\sum_{i=1}^n\left(x_i-\bar{x}\right)\left(y_i-\bar{y}\right)}{\sqrt{\sum_{i=1}^n\left(x_i-\bar{x}\right)^2} . \sqrt{\sum_{i=1}^n\left(y_i-\bar{y}\right)^2}}$ (3)
Value = value of parameter 1, mean of parameter 1, mean of parameter 2, ranges from -1 to +1, +1 → perfect positive linear relationship, -1 → perfect negative linear relationship, 0 → no linear relationship. Of the three parameters of susceptibility, density, and geology (Table 1), the Pearson correlation calculation (r) = 0.994 shows a very strong positive correlation. Meanwhile, the relationship between the number of landslide activities and alteration (Table 2) is carried out in the same way. First, determining the amount of alteration intensity in percent, namely argillic at 60% and propylitic at 30% shows a very strong positive correlation between the two (r) = 0.998. The calculations that have been carried out have proven that the relationship between the different parameters that have been carried out shows results with high accuracy.
Table 1. Magnetic, density, and geological parameters
|
Types of Rocks |
Magnetic Intensity (nT) |
Density (g/cm³) |
|
Andesite |
580 |
2.65 |
|
Lava |
720 |
2.80 |
|
Volcanic breccia |
450 |
2.5 |
|
Tuff/Volcanic deposits |
300 |
2.25 |
Table 2. Magnetic, density, and geological parameters
|
Zone |
Alteration Intensity (%) |
Landslide Activity (Number of Events) |
|
Propylitic |
60 |
24 |
|
Argillic |
30 |
19 |
|
Non-Alteration |
0 |
15 |
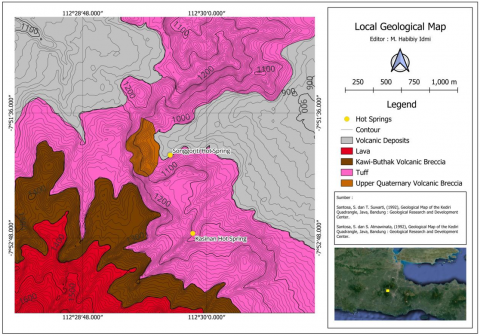
Geological mapping was conducted to analyze the distribution of rock units, providing detailed and accurate lithological data. This method identifies rock descriptions, types, terrain slopes, outcrop profiles, and field rock samples. The analyzed rock units were compiled into a 2D rock distribution map, offering a valuable reference for geophysical interpretations. The local geological mapping was performed over the same area as the gravity survey to ensure consistency in data collection. The mapped rock distribution was then projected into a 2D geological map, as illustrated (see Figure 7).
Figure 7. Local geological map
The rock units in the local geological map of Songgokerto, Batu consist of five distinct units: volcanic deposits, lava, Kawi-Butak volcanic breccia, tuff, and upper Quaternary volcanic breccia. These rock units were identified through direct field observations. The classification of rock units follows the Indonesian Stratigraphic Code (1996), though the naming conventions remain unofficial. Based on the results of geological mapping, the study area consists of five rock units: volcanic deposits, lava, Kawi-Butak volcanic breccia, tuff, and upper Quaternary volcanic breccia. The geological mapping results are then used as a reference in interpreting magnetic and gravity anomaly data, using the following reference Table 3.
Table 3. Lithology-physical property comparison [28]
|
Types of Volcanic Rocks |
Magnetic Susceptibility (SI) |
Density (g/cm³) |
Resistivity (Ω·m) |
Porosity (%) |
Permeability (mD) |
|
Basalt |
0.01 - 0.1 |
2.8 - 3.0 |
10 - 500 |
5 - 15 |
1 - 100 |
|
Andesit |
0.001 - 0.05 |
2.5 - 2.7 |
50 - 1000 |
3 - 12 |
0.1 - 50 |
|
Rhyolit |
0.0001 - 0.01 |
2.3 - 2.5 |
500 - 2000 |
1 - 8 |
0.01 - 10 |
|
Dacite |
0.001 - 0.02 |
2.4 - 2.6 |
100 - 1500 |
2 - 10 |
0.1 - 20 |
|
Tuff |
0.0001 - 0.01 |
1.8 - 2.3 |
100 - 1000 |
20 - 50 |
10 - 500 |
|
Obsidian |
0.00001 - 0.0001 |
2.4 - 2.6 |
1000 - 10,000 |
<1 |
<0.01 |
|
Granit |
0.001 - 0.01 |
2.6 - 2.7 |
100 - 1000 |
0.5 - 2 |
0.1 - 1 |
Hydrothermal alteration occurs when high temperature and pressure modify the mineral composition of rocks. This complex process involves chemical, mineralogical, and textural changes due to the interaction between hot fluids and host rocks. The alteration process falls under metasomatism, where chemical exchange occurs between the circulating fluids and the surrounding rock formations [35]. Several factors influence hydrothermal alteration, including temperature, pressure, rock composition, permeability, fluid content, and rock type.
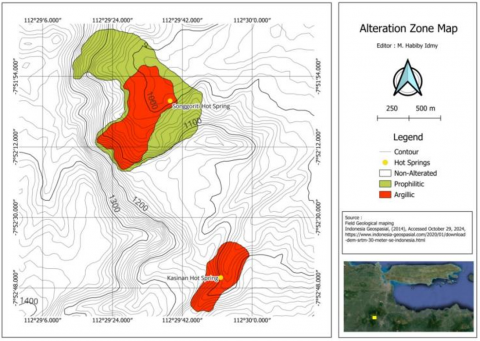
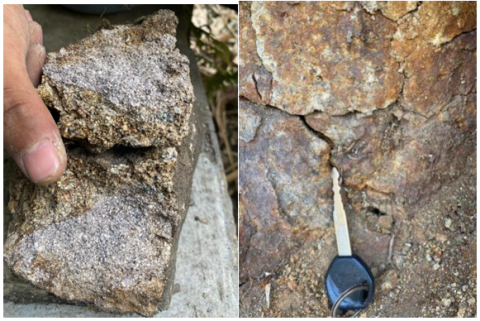
The hydrothermal alteration distribution map of Songgoriti, Batu City (see Figure 8), identifies two primary types of alteration: propylitic alteration and argillaceous alteration. Propylitic alteration, marked in green, accounts for approximately 60% of the altered area, making it the dominant type. This alteration is characterized by whitish-reddish rock coloration and silica minerals (see Figure 9). Propylitic alteration typically forms in shallow environments due to a low-temperature hydrothermal system with temperatures ranging from 120 to 200°C. This alteration commonly occurs in volcanic or batholithic rocks exposed to hydrothermal fluids rich in elements such as aluminum, iron, and magnesium, contributing to mineral formation.
In addition to propylitic alteration, the study area contains an argillaceous alteration, covering approximately 30% of the total surveyed area. Argillaceous alteration is characterized by whitish rock coloration with slight reddish hues. This type of alteration is commonly associated with high hydrothermal activity, particularly in regions influenced by volcanic processes or mineral deposition. Rocks affected by argillaceous alteration tend to contain higher clay mineral content, making them more susceptible to erosion. Furthermore, under specific geological conditions, argillaceous alteration is often linked to the formation of metal ore deposits, such as gold and copper. The distribution of hydrothermal alteration zones is likely controlled by faults or fractures in the area. Therefore, further research is essential to analyze the structural geology that influences the direction of hydrothermal fluid flow.
Figure 8. Rock alteration distribution map
Figure 9. Altered rock samples
4.2 Gravity method analysis
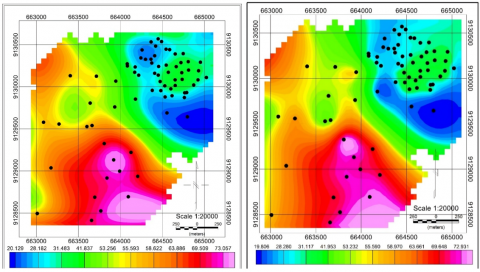
Gravity data processing in the study area was conducted at 71 measurement points, resulting in the Complete Bouguer Anomaly Map. The Complete Bouguer Anomaly represents a combination of residual and regional anomalies, meaning that the values on this map reflect the overall gravity anomaly distribution within the study area. The results of the Complete Bouguer Anomaly Map analysis (see Figure 10(a)) indicate that anomaly values are distributed across three main categories: high, moderate, and low anomalies.
• Low anomaly values (19.8 – 30.9 mGal) are concentrated in the northern to eastern parts of the study area and are represented by light blue to dark blue colors.
• Moderate anomaly values (31 – 54.9 mGal) extend from the northern central region toward the southeast and are shown in green shades.
• High anomaly values (55 – 72.9 mGal) are found in the study area’s southern, southwestern, western, and northwestern parts, marked by yellow to pink colors.
Variations in gravitational acceleration anomalies within the study area are attributed to differences in subsurface rock density. High gravity anomalies indicate that the underlying rocks have higher density and are more compact, whereas low gravity anomalies suggest lower-density rock formations. Using the Parasnis method, the average rock density in the study area was calculated to be 2.75 g/cm³, representing the typical density of subsurface formations in this region.
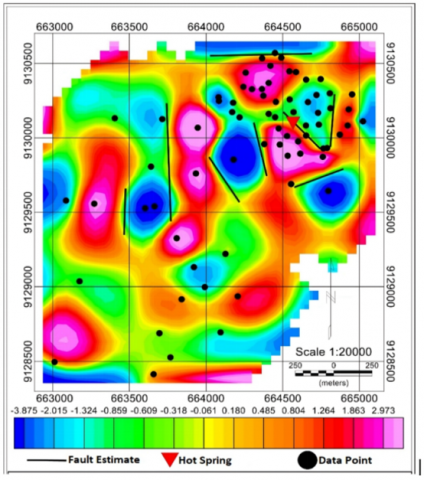
The residual anomaly values were obtained by separating the Complete Bouguer Anomaly from the regional anomaly (see Figure 10(b)). Residual anomalies are characterized by shorter wavelengths and higher frequencies, indicating shallower subsurface features compared to regional anomalies. The gravity anomaly distribution in the Residual Gravity Anomaly Map (see Figure 11) shows greater variability. The anomalies are categorized into three main groups:
• High gravity anomalies (0.1 to 3.0 mGal), represented by red to pink shades.
• Moderate gravity anomalies (-0.8 to -0.09 mGal), indicated in green shades.
• Low gravity anomalies (-3.9 to -0.9 mGal), shown in blue shades.
(a) (b)
Figure 10. Gravity anomaly maps (a) Complete Bouguer anomaly map, (b) Regional gravity anomaly map
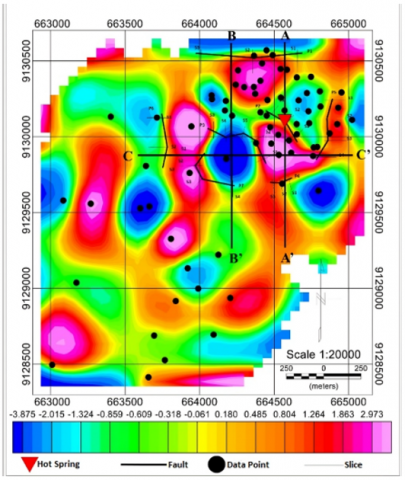
The residual gravity anomaly map can be used to identify fault locations in areas where there is a high contrast in density values. Based on the analysis, eight fault locations were identified, concentrated around the Songgoriti hot spring area (northeast). In contrast, the western and southern regions of the study area show density contrasts but were not interpreted as faults due to insufficient data coverage in those areas. Therefore, the residual anomaly map may have uncertainties in regions with sparse data, affecting the accuracy of fault identification. The fault lines identified in the residual anomaly map are still represented as straight lines, and their continuity has not yet been fully detailed.
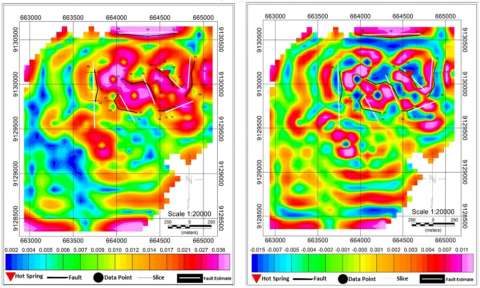
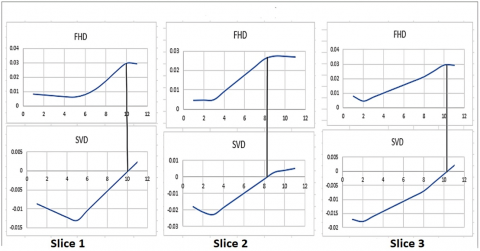
Fault interpretations were refined using derivative analysis, applying First Horizontal Derivative (FHD) and Second Vertical Derivative (SVD) filters. This analysis was conducted by extracting cross-sections from the FHD and SVD maps, focusing on areas suspected to contain fault structures. The FHD and SVD maps are shown in Figures 12(a) and 12(b), respectively. The results in Figure 12(a) and Figure 12(b) indicate that fault structures are predominantly located in the northern part of the study area. These faults are classified as minor faults, with seven identified fault lines (P1, P2, P3, P4, P5, P6, and P7). These minor faults are concentrated around the Songgoriti hot spring area, suggesting a strong structural control over hydrothermal activity in this region.
The fault positions identified in the Residual Gravity Anomaly Map (see Figure 11) and those determined through FHD and SVD analysis (see Figures 12(a) and 12(b)) show slight positional shifts. This discrepancy arises due to differences in depth resolution between the methods. The residual gravity anomaly map represents depths reaching approximately 100 meters, whereas the depth range for the FHD and SVD maps is not explicitly known. As a result, the fault locations appear slightly different, but overall, the fault positions in the residual anomaly map (see Figure 11) align well with those in the FHD and SVD maps. The FHD and SVD maps provide a clearer view of the fault structures and allow for better visualization of fault continuity patterns. Based on the FHD and SVD analysis (see Figure 13), the identified faults exhibit distinct orientations. Faults P2, P3, and P7 follow a northwest-southeast (NW-SE) trend, while Faults P5 and P6 align in a north-south (N-S) direction. Meanwhile, Faults P1 and P4 trend in a west-east (W-E) direction. Fault cross-section analysis was conducted using Microsoft Excel, where FHD and SVD values were plotted as curves to analyze structural patterns.
Figure 11. Residual gravity anomaly map
(a) (b)
Figure 12. Fault structure analysis; (a) First horizontal derivative (FHD) map, (b) Second vertical derivative (SVD) map
Figure 13. FHD and SVD analysis results
The faults identified in the FHD and SVD maps are interpreted as conduits for hydrothermal fluids rising to the surface. In the Songgoriti hot spring manifestation area, fault P2 is located directly beneath the hot spring, as confirmed by 2D modeling along sections A-A’. The faults in the study area are classified as minor faults, as the regional geological map does not indicate major fault systems crossing the study site. Each fault was analyzed through 3 to 5 cross-sections, depending on its continuity as determined from the FHD and SVD maps. The identified faults were subsequently modeled in 2D, with results presented along sections A-A’, B-B’, and C-C’.
4.3 2D modeling
Based on the residual anomaly map and information derived from the FHD and SVD maps, three cross-sections were selected for 2D modeling. These sections were strategically positioned to intersect the Songgoriti hot spring area and cross the fault structures identified in the study.
•Sections A-A’ and B-B’ were oriented north to south, capturing structural variations along the vertical fault alignments.
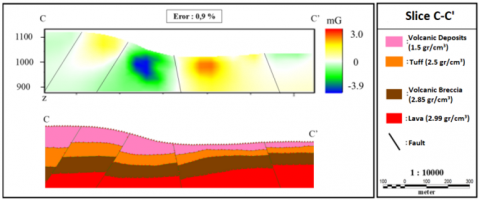
•Section C-C’ was oriented west to east, intersecting both A-A’ and B-B’, providing a complementary perspective on the fault interactions and hydrothermal pathways.
Each modeled cross-section spans 1,300 meters and extends to a depth of 100 meters.
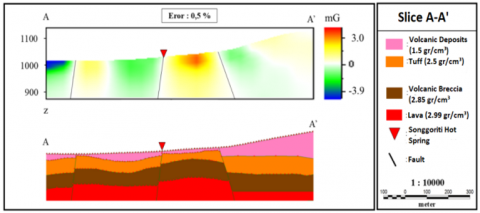
Figure 14 shows that Cross-Section A-A’ reveals four distinct rock layers and three fault structures. The faults intersected by Section A-A’ include Fault 1 (P1), Fault 2 (P2), and Fault 4 (P4).
•The topmost layer consists of tuff, extending from 0 meters to 19 meters in depth.
•The second layer comprises clay-altered tuff breccia, spanning from 8 meters to a maximum depth of 37 meters.
•The third layer is composed of volcanic breccia, extending from 18 meters to 60 meters in depth.
•The deepest modeled layer consists of lava, reaching from 49 meters to the maximum depth of 100 meters.
Figure 14. Cross-section directions for A-A’, B-B’, and C-C’
From the 2D modeling results of Cross-Section A-A’, Fault P2 (centrally in the section) is interpreted as a conduit for hydrothermal fluid migration to the surface. Among the four identified rock layers, the volcanic breccia layer is interpreted as a reservoir rock, acting as a storage zone for heated fluids beneath the surface, which an underlying heat source has heated.
Meanwhile, the clay-altered tuff breccia layer (second layer) is considered a cap rock due to its impermeable properties, preventing the upward movement of fluids beyond this boundary. The 2D modeling results for Cross-Section A-A’ indicate a model deviation of 0.5%, confirming the reliability of the structural interpretation.
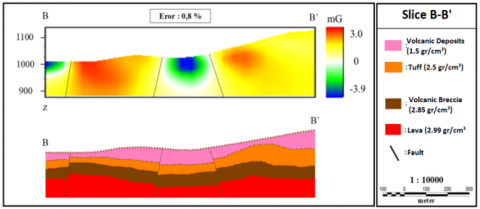
As shown in Figure 15(b), Cross-Section B-B’ consists of four rock layers, arranged similarly to Cross-Section A-A’. This section features three modeled fault structures, identified as Fault 1 (P1), Fault 3 (P3), and Fault 7 (P7).
•The first layer is composed of tuff, extending from 0 meters to a maximum depth of 20 meters.
•The second layer consists of clay-altered tuff breccia, spanning from 10 meters to 45 meters in depth.
•The third layer is volcanic breccia, extending from 23 meters to 76 meters in depth.
•The final layer is lava, occurring at depths ranging from 50 meters to 100 meters.
The 2D modeling results for Cross-Section B-B’ indicate the presence of three fault structures, influencing the distribution of subsurface layers. The model deviation for B-B’ is 0.8%, confirming the accuracy of the structural interpretation. Cross-Section B-B’ is located west of Cross-Section A-A’, offering a complementary perspective on the fault system and hydrothermal activity.
Cross-Section C-C’ (see Figure 15(c)) also consists of four rock layers arranged similarly to the previous two sections (A-A’ and B-B’). The modeled fault structures in this section include Fault 6 (P6), Fault 7 (P7), Fault 3 (P3), and Fault 5 (P5).
•The first layer is tuff, extending from 0 meters to a maximum depth of 29 meters.
•The second layer is clay-altered tuff breccia, spanning from 11 meters to 45 meters.
•The third layer is volcanic breccia, extending from 16 meters to 80 meters in depth.
•The fourth and deepest layer is lava, occurring at depths of 40 meters to 100 meters.
(a)
(b)
(c)
Figure 15. 2D cross-sections (a) Cross-section A-A’, (b) Cross-section B-B’, (c) Cross-section C-C’
Figure 16. Magnetic anomaly processing (a) Total magnetic intensity (TMI) map, (b) Reduced-to-Pole (RTP) magnetic anomaly map
The 2D modeling results for Cross-Section C-C’ reveal four fault structures, with a model deviation of 0.9%. Cross-Section C-C’ is oriented west-east, intersecting both A-A’ and B-B’, providing a more detailed interpretation of subsurface structures.
The geothermal system interpretation in Cross-Section C-C’ aligns with Cross-Section A-A’s results. The volcanic breccia layer is interpreted as a reservoir rock, functioning as a storage zone for hydrothermal fluids. Meanwhile, the clay-altered tuff breccia layer (second layer) is identified as the cap rock, serving as an impermeable barrier that prevents fluid from migrating further upward.
The red triangle symbol (see Figure 15(a)) marks the location of the Songgoriti hot spring, where faults facilitate the upward movement of heated hydrothermal fluids to the surface. The fault positions in all 2D cross-sections were derived from the FHD and SVD maps, ensuring a comprehensive interpretation of fault structures and their relationship with the hydrothermal system.
4.4 Magnetic method analysis
Based on the total magnetic anomaly distribution data, several areas exhibit varying anomaly values. The highest magnetic anomaly value recorded is 874 nT, while the lowest anomaly value is 40.1 nT. As shown in Figure 16(a), certain regions display low anomaly values (<400 nT). This suggests the presence of materials causing demagnetization, leading to a significant reduction in magnetic anomaly values. This phenomenon is often associated with hydrothermal alteration processes, where mineralogical changes in the subsurface affect the magnetic properties of rocks. Dense plants and vegetation generate magnetic fields, such as plant roots, plant biological activity, and the weathering of rocks caused by plant roots. The magnetic field generated by vegetation is so small that magnetic measurements do not account for the effects of vegetation density.
To obtain a more accurate magnetic anomaly distribution, a magnetic anomaly transformation was applied. The transformation involved reducing the magnetic data to the pole (RTP) and using a Butterworth filter. The RTP transformation adjusts the magnetic anomaly distribution by shifting the anomalies northward, correcting for the effects of inclination and declination. This process ensures that the magnetic anomalies are aligned with the geometric north, making interpretation more precise. Figure 16(b) presents the RTP-transformed magnetic anomaly map, highlighting changes in the anomaly distribution compared to the Total Magnetic Intensity (TMI) Map (see Figure 16(a)).
The lowest anomaly value in the RTP map is observed in the northeastern region, with an anomaly value of < -384.0 nT. When compared to the TMI anomaly map, the anomaly scale differs significantly:
•The TMI map’s lowest recorded anomaly value is 40.1 nT, while the highest is 874.1 nT.
•The RTP map’s lowest anomaly is < -384.0 nT, and the highest is 1099.6 nT.
This change in anomaly scale indicates that the RTP transformation provides a more refined anomaly distribution, enhancing the accuracy of subsurface interpretations. Following the RTP transformation, the anomalies were further separated into regional and residual components, as shown in Figure 17(a) and Figure 17(b). This separation was conducted using Oasis Montaj software, applying the Butterworth filter. One advantage of the Butterworth filter is its smooth frequency response within the passband, making it well-suited for distinguishing regional and residual anomalies in this study.
(a) (b)
Figure 17. Magnetic anomaly separation (a) Residual magnetic anomaly map, (b) Regional magnetic anomaly map
The regional anomaly separation resulted in a regional magnetic anomaly map ranging from -406.8 nT to 1073.8 nT. The regional anomaly map can also derive the residual anomaly, representing shallow subsurface magnetic variations. The residual anomaly was obtained by subtracting the regional anomaly from the original RTP anomaly map. The residual anomaly distribution differs from the original anomaly distribution, particularly in the magnetic anomaly scale, which ranges from -387.1 nT to 401.9 nT in the residual map. Another notable difference is observed in the northwestern to lower regions of the residual anomaly map, where a higher concentration of low-anomaly areas is detected compared to the original anomaly map. This suggests that significant demagnetization processes have occurred at shallow depths, making the anomalies more pronounced in near-surface layers.
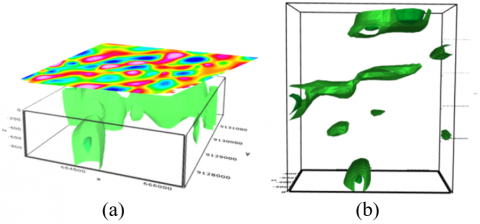
Figure 18. 3D magnetic anomaly modeling (a) 3D model of magnetic anomaly distribution, (b) Top-view of low magnetic anomaly distribution
The residual anomaly map was used as the base map for performing 3D inversion modeling using ZondGM3D software, resulting in the 3D magnetic anomaly distribution model shown in Figures 18(a) and 18(b). The 2D and 3D distribution models are references for determining hydrothermal alteration zones. The inversion process in ZondGM3D utilized the Occam inversion method, which constrains model complexity by incorporating regularization to smooth parameter values and improve data consistency. The 3D inversion results indicate that the model extends to approximately 800 meters, with low magnetic susceptibility anomalies concentrated in the central and upper areas. The susceptibility values range from -340 to 380, highlighting regions of significant magnetic depletion.
The low magnetic anomaly zones are interpreted as potential hydrothermal alteration zones. This interpretation is based on the demagnetization effect, where rock exposure to high temperatures from hydrothermal activity results in the loss or reduction of magnetic properties. Consequently, areas with low magnetic anomalies can be used as key indicators of geothermal or hydrothermal zones. The 2D and 3D models yield consistent results, confirming that zones with low magnetic anomaly values correspond to potential hydrothermal areas. These findings provide a valuable reference for identifying subsurface thermal activity and further geothermal exploration.
4.5 Correlation of hydrothermal alteration zones with geophysical methods
The correlation between hydrothermal alteration zones and magnetic methods was conducted by comparing hydrothermal alteration distribution maps with magnetic anomaly values. The distribution of magnetic values indicates hydrothermal alteration based on previous studies that have successfully used magnetic methods to map alteration zones. A notable study by Sherif Olumide Sanusi utilized airborne magnetic surveys, demonstrating that hydrothermal alteration zones can be effectively detected using magnetic methods [36]. Another significant research by Carol A. Finn applied multiple geophysical methods, including magnetics, to investigate anisotropic rock formations in Mount Baker and their implications for slope stability. The results of Finn’s research confirmed that hydrothermal alteration zones exhibit significantly lower magnetic values compared to surrounding areas. Numerous previous studies further validate the use of geophysical methods, particularly magnetics, for mapping hydrothermal alteration zones.
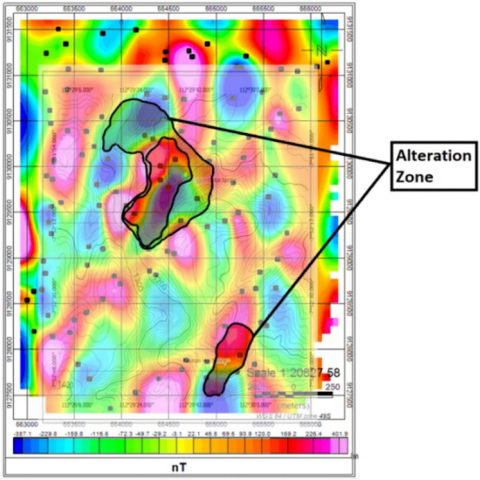
Figure 19. Correlation of the alteration zone with the magnetic anomaly
The correlation between hydrothermal alteration distribution and magnetic anomaly maps in Figure 19 shows that alteration zones correspond to areas with low magnetic anomalies. These regions are represented by light green to dark blue colors, with anomaly values ranging from -387.1 nT to -3.1 nT. The alignment between the hydrothermal alteration map and the magnetic anomaly map verifies that hydrothermal alteration is present in these areas. In addition to the 2D magnetic anomaly map, the correlation was further analyzed using 3D inversion models, which revealed a similar spatial distribution pattern. The 3D magnetic anomaly distribution (see Figure 18(b)) extends west-east, aligning with the hydrothermal alteration map, reinforcing the interpretation that low magnetic anomalies are associated with alteration zones.
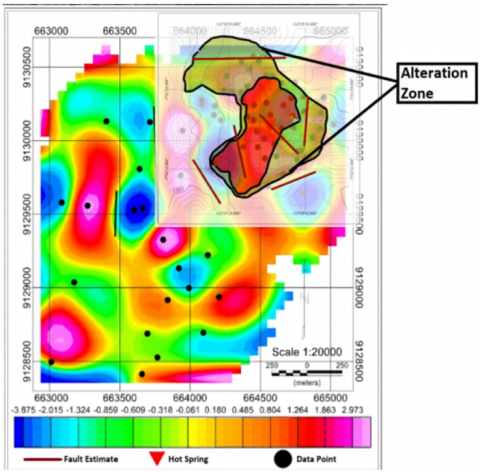
Figure 20. Correlation of the alteration zone with fault distribution
Another validation method involved the gravity survey, which determined fault structures in the study area. This was necessary because hydrothermal alteration commonly forms along fault zones. Faults act as conduits, facilitating the interaction between rocks and hydrothermal fluids, transporting chemicals that alter the rock’s mineral composition through fractures or cracks. The fault-aligned hydrothermal alteration confirms the structural control over alteration processes, supporting the reliability of the geophysical interpretations.
The gravity method analysis indicates that the geothermal system in the study area is structurally controlled by faulting, as seen in Figure 15. The local faults in the study area exhibit varied orientations and lengths, with a dominant northwest-southeast trend intersecting the hydrothermal alteration zone. The correlation between hydrothermal alteration distribution and fault structures shows that the hydrothermal system is fault-controlled. This is evident in Figure 20, where two major faults intersect the hydrothermal alteration zone, reinforcing the hypothesis that faults act as conduits for hydrothermal fluid migration.
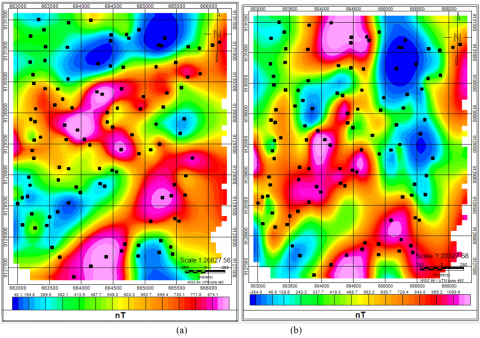
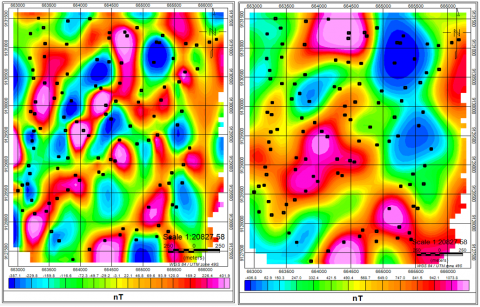
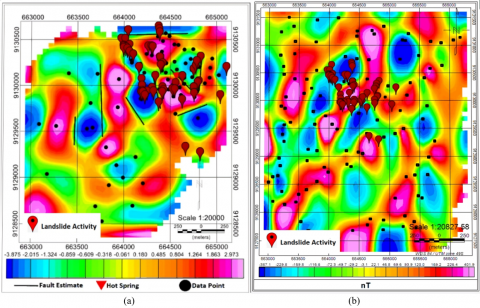
The relationship between gravity-magnetic anomalies and landslide activity can be seen in Figure 21(a): Gravity anomalies. Magnetic anomalies in Figure 21(b) can describe the location of landslide activity, many of which occur in low or high anomalies. In gravity anomalies, around 85% occur in the low anomaly zone (-3.9 to -0.9 mGal), which is marked in blue-green. While the magnetic anomalies also show the same pattern, where the distribution of landslide activity is 52%, many occur in the low zone (-387.1 - -72.3 nT). This can provide information about the relationship between anomalies and the distribution of landslide activity, where r <0.774 is a strong negative inverse relationship.
Figure 21. (a) Landslide density-gravity (b) Landslide density-magnetic
4.6 Correlation between hydrothermal alteration zones and landslides
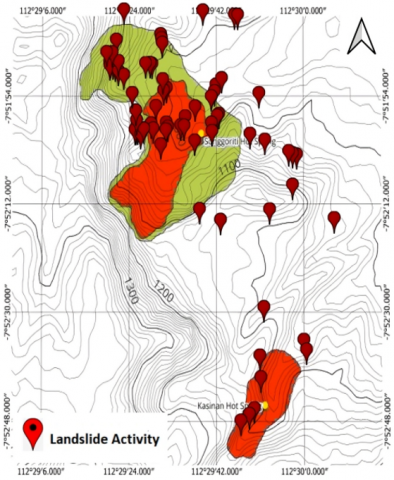
The locations of landslide activity, ranging from minor to major occurrences, are marked in red in Figure 22, illustrating the distribution of landslide events in Songgoriti, Batu City. The landslide activity points were determined based on BPBD (Regional Disaster Management Agency) data, field observations, and news reports documenting landslides. From the map below, it can be seen that in the research area, there were 66 landslide activities, of which 43 occurred in the hydrothermal alteration zone, or 65% of the total landslide activities. When these landslide locations are compared to the hydrothermal alteration distribution map, it becomes evident that many landslide events occur within the hydrothermal alteration zone. This correlation suggests that hydrothermal alteration of rock formations may contribute to landslide susceptibility.
The impact of mineralization that occurs during rock alteration causes increased porosity and reduced permeability. The relationship between alteration mineral intensity and rock quality is divided into three categories: low intensity (rocks are still intact and strong), medium intensity (pore expansion and decreased density), and high intensity (many clay minerals, weathered rocks, and low shear strength). The study site found many rocks with moderate to high intensity levels. Hydrothermal alteration alters rocks’ mineral composition and density, reducing their structural integrity. Rocks that originally had high density may undergo alteration, reducing density and mechanical strength. Lower-density rocks are more susceptible to landslides, as the driving forces (gravity and slope instability) exceed the resisting forces (rock cohesion and shear strength).
Figure 22. Correlation between hydrothermal alteration zones and landslide-prone areas
Changes in rock properties primarily cause landslides within hydrothermal alteration zones due to hydrothermal alteration. The alteration process modifies rocks’ physical and chemical characteristics, leading to a reduction in rock density. In this process, original, harder minerals are replaced by softer minerals such as chlorite or zeolite, making the rocks less structurally stable. Additionally, hydrothermal alteration often increases water content, causing the rocks to become saturated. This excessive water infiltration weakens the rock structure, reducing its lateral integrity. The alteration process causes rocks to become fragmented and heterogeneous, compromising slope stability. These changes contribute to instability in hillsides and slopes, increasing the likelihood of landslides in affected areas.
Previous research with almost the same area, namely research conducted by Silwal et al. [37] in 2024 with the title Effects of hydrothermal activity and weathering in the active fault area: formation of large landslide and landslide dam lake, Lake Nakatsuna, Nagano, Japan explained that the Nakatsuna landslide is a type of complex mass movement influenced by mineralogical alteration, rock weathering, and paleoseismic activity [37]. This can be evidence that mineral and hydrothermal alteration can be one of the causes of landslides in an area. Apart from steep slopes and rock alteration, geological structures such as faults and fractures also play a crucial role in landslide occurrences. Fault zones create weak planes, allowing increased water infiltration and further reducing slope stability. Hydrothermal alteration, steep terrain, and faulting make certain areas highly susceptible to landslides, reinforcing the importance of geophysical and geological assessments in hazard mitigation planning.
The Songgoriti region in Batu City exhibits a diverse terrain, ranging from gentle slopes to steep inclines, with the most extreme slopes reaching 87 degrees. Landslides in this area occur almost annually, prompting mitigation efforts such as retaining wall construction and reforestation. However, landslide activity continues to persist. The geological survey identified five major rock units in the study area: volcanic deposits, lava, Kawi-Butak volcanic breccia, tuff, and upper Quaternary volcanic breccia. Additionally, hydrothermal alteration mapping revealed the presence of two alteration types: propylitic alteration, covering 60% of the altered area and characterized by whitish-reddish rock coloration and silica mineral presence, and argillic alteration, which comprises the remaining portion.
The geophysical surveys employed gravity and magnetic methods, each with specific objectives. The gravity method was used to map fault structures, revealing variations in residual gravity anomalies classified as high anomalies (0.1 to 3.0 mGal) marked in red to pink shades, moderate anomalies (-0.8 to -0.09 mGal) in green shades, and low anomalies (-3.9 to -0.9 mGal) in blue shades. Further analysis using First Horizontal Derivative (FHD) and Second Vertical Derivative (SVD) filters identified several faults within the study area. These faults are interpreted as pathways for hydrothermal fluids, with Fault P2 located directly beneath the Songgoriti hot spring, as confirmed by 2D modeling along section A-A’ (see Figure 12). The faults detected in this study are localized minor faults, as no major fault systems were identified in regional geological maps.
The magnetic survey results closely align with the gravity survey, providing additional validation. The regional magnetic anomaly map ranged from -406.8 nT to 1073.8 nT, while the residual magnetic anomaly map, which represents shallow subsurface variations, ranged from -387.1 nT to 401.9 nT. The residual anomaly was obtained by subtracting the regional anomaly from the RTP anomaly map, resulting in a distinct anomaly pattern.
The correlation between geophysical and geological methods confirms a strong relationship between hydrothermal alteration and magnetic anomalies. Areas with low magnetic anomalies (light green to dark blue zones) were found to correspond with hydrothermal alteration zones, validating the presence of hydrothermal activity in these areas. The correlation of susceptibility, density, and geological parameters shows that the Pearson correlation calculation (r) = 0.953 is a very strong positive, and the correlation between the number of landslide activities and hydrothermal alteration (r) = 0.99 is a very strong positive.
The correlation between gravity anomalies and hydrothermal alteration suggests that fault structures control hydrothermal alteration. The fault alignment supports this hypothesis, which traces to hydrothermal alteration zones, indicating that faults serve as conduits for hydrothermal fluid migration. The correlation between landslide occurrences and hydrothermal alteration reveals that many landslides occur within hydrothermal alteration zones. This suggests hydrothermal alteration may contribute to slope instability, as alteration processes reduce rock density and mechanical strength, making slopes more susceptible to failure. Along with fault activity, hydrothermal alteration may significantly trigger landslides in the study area. Regular monitoring is necessary annually and intensively to obtain data on rock changes and alteration. The desired rock change data includes slope movement, changes in hydrothermal alteration intensity, pore pressure, soil moisture, susceptibility values, and rock density. Monitoring can be conducted using drones/magnetic UAVs and stationary microgravity installations at the research site.
The authors are grateful to the University that has provided research funding and the reviewer, whose valuable comments improved the manuscript.
|
g |
Gravitational Acceleration |
|
G |
Universal Gravitational |
|
M |
Mass in Kilograms (kg) |
|
R |
Earth’s Radius in Meters (m) |
|
k |
Magnetic Susceptibility |
|
H |
Induced By a Magnetic Field |
|
M |
Magnetization Intensity |
[1] Hamilton, W.B. (1979). Tectonics of the Indonesian region (No. 1078). US Government Printing Office.
[2] Masum, M., Akbar, M.A. (201). The Pacific ring of fire is working as a home country of geothermal resources in the world. In IOP Conference Series: Earth and Environmental Science, Petropavlovsk-Kamchatsky, Russian Federation, p. 012020. https://doi.org/10.1088/1755-1315/249/1/012020
[3] Blahůt, J., Balek, J., Klimeš, J., Rowberry, M., Kusák, M., Kalina, J. (2019). A comprehensive global database of giant landslides on volcanic islands. Landslides, 16(10): 2045-2052. https://doi.org/10.1007/s10346-019-01275-8
[4] Ehteshami-Moinabadi, M. (2022). Properties of fault zones and their influences on rainfall-induced landslides, examples from Alborz and Zagros ranges. Environmental Earth Sciences, 81(5): 168. https://doi.org/10.1007/s12665-022-10283-2
[5] Hadmoko, D.S., Lavigne, F., Samodra, G. (2017). Application of a semiquantitative and GIS-based statistical model to landslide susceptibility zonation in Kayangan Catchment, Java, Indonesia. Natural Hazards, 87(1): 437-468. https://doi.org/10.1007/s11069-017-2772-z
[6] Stepanov, A.S. (2021). A review of the geochemical changes occurring during metamorphic devolatilization of metasedimentary rocks. Chemical Geology, 568: 120080. https://doi.org/10.1016/j.chemgeo.2021.120080
[7] BNPB. (2016). Tentang InaRISK (About InaRISK). Republik Indonesia: Badan Nasional Penanggulangan Bencana (BNPB). https://inarisk.bnpb.go.id/about#:~:text=InaRISK%20adalah%20portal%20hasil%20kajian.
[8] Meijaard, E., Dennis, R.A., Saputra, B.K., Draugelis, G.J., Qadir, M.C.A., Garnier, S. (2019). Rapid environmental and social assessment of geothermal power development in conservation forest areas of Indonesia. PROFOR, The World Bank.
[9] Central Statistics Agency of Batu City. (2021). Official Statistics News of the 2020 Population Census Results of Batu City (Berita Statistik Resmi Hasil Sensus Penduduk 2020 Kota Batu). Batu City Government.
[10] Riestu, I.M., Hidayat, H. (2023). Landslide susceptibility mapping using random forest algorithm and its correlation with land use in Batu City, Jawa Timur. Earth and Environmental Science, 1127(1): 012017. https://doi.org/10.1088/1755-1315/1127/1/012017
[11] Monadi, E.J. (2024). Analyzing entertainment tax impact on Batu City's regional revenue and taxpayer compliance levels. Journal of Transformative Governance and Social Justice, 2(2): 171-183.
[12] Nabilou, M., Arian, M., Afzal, P., Adib, A., Mehrnia, A.K. (2018). Determination of relationship between basement faults and alteration zones in Bafq-Esfordi region, central Iran. Episodes Journal of International Geoscience, 41(3): 143-159. https://doi.org/10.18814/epiiugs/2018/018013
[13] Mathieu, L. (2018). Quantifying hydrothermal alteration: A review of methods. Geosciences, 8(7): 245. https://doi.org/10.3390/geosciences8070245
[14] Bohnsack, D., Potten, M., Pfrang, D., Wolpert, P., Zosseder, K. (2020). Porosity–permeability relationship derived from Upper Jurassic carbonate rock cores to assess the regional hydraulic matrix properties of the Malm reservoir in the South German Molasse Basin. Geothermal Energy, 8(1): 12. https://doi.org/10.1186/s40517-020-00166-9
[15] Okamoto, T., Matsuura, S., Larsen, J.O., Asano, S., Abe, K. (2018). The response of pore water pressure to snow accumulation on a low-permeability clay landslide. Engineering Geology, 242: 130-141. https://doi.org/10.1016/j.enggeo.2018.06.002
[16] Adebiyi, L.S., Eluwole, A.B., Fajana, A.O., Salawu, N.B., Falade, S.C., Dopamu, K.O., Alejolowo, E.A. (2022). Integrated geophysical methods for delineating crustal structures and hydrothermal alteration zones for mineral exploration projects in parts of West-Central, Nigeria. Modeling Earth Systems and Environment, 8(3): 2977-2989. https://doi.org/10.1007/s40808-021-01275-5
[17] Farid, M., Andeska, D.O., Hadi, A.I. (2023). Stratification characteristics of subsurface rock structure geothermal manifestations at Telaga Tujuh Warna Bukit Daun, Bengkulu, Indonesia using magnetic methods. Journal of Physics: Conference Series, 2498: 012008. https://doi.org/10.1088/1742-6596/2498/1/012008
[18] Pasierb, B., Grodecki, M., Gwóźdź, R. (2019). Geophysical and geotechnical approach to a landslide stability assessment: A case study. Acta Geophysica, 67(6): 1823-1834. https://doi.org/10.1007/s11600-019-00338-7
[19] Igwe, O. (2016). Predisposing factors and the mechanisms of rainfall-induced slope movements in Ugwueme, South-East Nigeria. Bulletin of Engineering Geology and the Environment, 75(2): 623-636. https://doi.org/10.1007/s10064-015-0767-0
[20] Ilham, Susilo, A., Sukanta, I.N., Siregar, D.V., Hasan, M.F.R., Hardianto, Y.P. (2025). Detecting active fault with the topographic gravity model: A case study from Turen, Indonesia. The Iraqi Geological Journal, 58(2A): 203-215. https://doi.org/10.46717/igj.2025.58.2A.13
[21] Rizqia, M.N., Setiawan, A., Gumelar, F., Fitriani, D., Sutarno, D., et al. (2023). Identification of geological structure based on gravity method in Tangkuban Parahu Volcano, Bandung, Indonesia. IOP Conference Series: Earth and Environmental Science, 1159: 012006. https://doi.org/10.1088/1755-1315/1159/1/012006
[22] Jacob, T., Samyn, K., Bitri, A., Quesnel, F., Dewez, T., Pannet, P., Meire, B. (2018). Mapping sand and clay-filled depressions on a coastal chalk clifftop using gravity and seismic tomography refraction for landslide hazard assessment, in Normandy, France. Engineering Geology, 246: 262-276. https://doi.org/10.1016/j.enggeo.2018.10.007
[23] Hasan, M.F.R., Susilo, A., Suryo, E.A., Agung, P.A.M., Idmi, M.H., Zaika, Y., Zulaikah, S. (2024). Analysis of existence and faults impact on geological disasters using GGMPlus data. In IOP Conference Series: Earth and Environmental Science, Lombok, Indonesia, p. 012003. https://doi.org/10.1088/1755-1315/1321/1/012003
[24] Maryanto, S. (2018). Preliminary investigation of volcano hosted geothermal area at Kasinan-Songgoriti-Cangar, Batu city, based on gravity-seismic methods. In AIP Conference Proceedings, East Java, Indonesia, p. 050010. https://doi.org/10.1063/1.5062760
[25] Hasan, M.F.R., Susilo, A., Suryo, E.A., Agung, P.A.M., Idmi, M.H., Suaidi, D.A., Aprilia, F. (2024). Mapping of landslide potential in Payung, Batu City, Indonesia, using global gravity model plus (GGMplus) data as landslide mitigation. The Iraqi Geological Journal, 57(1A): 159-168. https://doi.org/10.46717/igj.57.1A.13ms-2024-1-24
[26] Siler, D.L., Faulds, J.E., Hinz, N.H., Dering, G.M., Edwards, J.H., Mayhew, B. (2019). Three-dimensional geologic mapping to assess geothermal potential: Examples from Nevada and Oregon. Geothermal Energy, 7(1): 2. https://doi.org/10.1186/s40517-018-0117-0
[27] Hofi, L.N., Maryanto, S., Susilo, A., Andinisari, R., Wuryani, S.D. (2024). Fault Detection and Subsurface Model Based on Gravity Data in Pronojiwo, Lumajang, Indonesia. https://doi.org/10.5109/7236820
[28] Telford, W.M., Telford, W.M., Geldart, L.P., Sheriff, R.E. (1990). Applied Geophysics. Cambridge, Cambridge University Press.
[29] Minarto, E., Azhari, N.Y. (2021). Application of moving average (MA) and upward continuation methods to Bouguer gravity anomaly data for fault analysis of the earthquake risk area of Timor and flores Islands. Journal of Physics: Conference Series, 1951: 012051. https://doi.org/10.1088/1742-6596/1951/1/012051
[30] Zulaikah, S., Susilo, A., Pohan, A.F., Hasan, M.F.R., Idmi, M.H., et al. (2024). Characterization of typological rocks using the geomagnetic method for mapping geological disaster susceptibility areas in Malang Regency, Indonesia. Research Square. https://doi.org/10.21203/rs.3.rs-3608588/v1
[31] Sutasoma, M., Susilo, A., Cahyo, R.H.D., Suryo, E.A. (2021). Identification of rock layer contacts in the surrounding of the Sutami Dam using geomagnetic methods. GEOMATE Journal, 21(84): 188-193.
[32] Santoso S., Atmawinata S. (1992). Geological map of the Kediri Quadrangle, Java. Geological Research and Development Centre, Bandung, Indonesia.
[33] Mao, X., Chen, Y., Liu, Z., Yang, X., Li, S., Wang, D., Chen, G. (2024). Hydrothermal alteration and its geochemistry of the Xiadian gold deposit, Jiaodong Peninsula, China: Implications for fluid-rock interaction processes and mineral exploration. Ore Geology Reviews, 170: 106134. https://doi.org/10.1016/j.oregeorev.2024.106134
[34] Navidi, W.C. (2006). Statistics for Engineers and Scientists (Vol. 2). New York: McGraw-Hill.
[35] Sanusi, S.O., Amigun, J.O. (2020). Structural and hydrothermal alteration mapping related to orogenic gold mineralization in part of Kushaka schist belt, North-central Nigeria, using airborne magnetic and gamma-ray spectrometry data. SN Applied Sciences, 2(9): 1591. https://doi.org/10.1007/s42452-020-03435-1
[36] Finn, C.A., Deszcz-Pan, M., Ball, J.L., Bloss, B.J., Minsley, B.J. (2018). Three-dimensional geophysical mapping of shallow water saturated altered rocks at Mount Baker, Washington: Implications for slope stability. Journal of Volcanology and Geothermal Research, 357: 261-275. https://doi.org/10.1016/j.jvolgeores.2018.04.013
[37] Silwal, B.R., Ota, K., Yoshida, K. (2024). Effects of hydrothermal activity and weathering in the active fault area: Formation of large landslide and landslide dam lake, Lake Nakatsuna, Nagano, Japan. Natural Hazards, 120(9): 9057-9091. https://doi.org/10.1007/s11069-024-06567-4