Bashar Tareq Al-Shandah![]() | Zaid Raad Abbas*
| Zaid Raad Abbas*![]() | Shaimaa F. Ali
| Shaimaa F. Ali![]() | Omar Wisam Al-Aloosi
| Omar Wisam Al-Aloosi![]()
© 2025 The authors. This article is published by IIETA and is licensed under the CC BY 4.0 license (http://creativecommons.org/licenses/by/4.0/).
OPEN ACCESS
The Tigris River, a crucial water source for Baghdad City, has faced increasing pollution due to industrialization, agricultural runoff, and population growth, necessitating regular water quality assessments. This study evaluated the physicochemical characteristics of the river in Baghdad’s Al-Zafraniya district to determine its suitability for drinking. Over six months, water samples were analyzed for key parameters (e.g., temperature, turbidity, pH, electrical conductivity, total dissolved solids, major ions, and nutrients) using standard methods. Results revealed seasonal variations, with higher dissolved constituents during dry periods and dilution effects during rains. While most parameters met permissible standards, electrical conductivity, total dissolved solids, total hardness, and calcium hardness exceeded acceptable limits. Although no critical pollution was detected, anthropogenic factors (fertilizers, waste disposal) and natural processes (rainfall, erosion) likely influenced water quality. Continuous monitoring is essential to mitigate potential public health risks, particularly for communities directly dependent on river water.
anthropogenic pollution, Baghdad City, drinking water quality, physicochemical parameters, seasonal variation, Tigris River, water monitoring, WHO standards
Water quality is affected by climate change and pollution from human activities, significantly influencing ecosystems and human health [1]. Moreover, surface water quality is more vulnerable to anthropogenic contaminants than to natural ones [2]. Consequently, the challenge for decision-makers is to attain sustainable management of water resources, particularly in developing nations [3]. Rivers are dynamic ecosystems that play a pivotal role in maintaining ecological balance, providing a habitat for diverse species, and serving as a vital source of freshwater for humans and natural systems. River water pollution can harm living beings and make water unsuitable for various needs [4].
Tigris River has a variety of physicochemical characteristics that can affect its quality and suitability for different uses. The need to assess and understand the physicochemical parameters within this ecosystem has become increasingly evident in light of the growing human impact on the environment [5].
The variability of physicochemical parameters in an aquatic environment is influenced by the varying levels of anthropogenic activities. Therefore, ongoing biomonitoring of aquatic environments is essential for evaluating the effects of human activities on water bodies and their implications for public health [6]. In Baghdad, especially in industrial areas like Al-Zafraniya, local pollution sources such as untreated industrial wastewater from small and medium-sized factories, discharge from dyeing workshops, tanneries, and domestic sewage are major contributors to water pollution. These discharges often lack any form of pretreatment, directly entering the Tigris River, affecting water chemistry and public health [7]. Additionally, airborne industrial particulates and heavy metal-laden dust in urban districts like Al-Zafraniya have been identified as contributors to the chemical burden of surface water, further degrading river quality [8]. Agricultural runoff enriched with nitrates and phosphates from surrounding fields exacerbates the problem by stimulating eutrophication and altering nutrient dynamics, recent studies also report high levels of electrical conductivity and heavy metals in urban stretches of the river, underscoring the need for policy-level interventions [9].
The objective of this study is to evaluate the temporal variations in the physicochemical characteristics of Tigris River water in the Al-Zafraniya area of Baghdad during the monitoring period from December to May, which partially encompasses transitions between wetter and drier conditions, given its role as a major source for drinking water supply projects in the city.
2.1 Study station
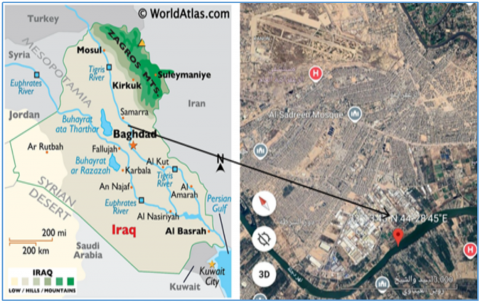
Tigris River is regarded as the second-longest river in Southwestern Asia, and it’s one of the major rivers in Iraq. It is roughly 1800 km long and 1500 Km long inside Iraq, Tigris River supplies water for the Baghdad City's drinking, agriculture, and trade [10]. The water sample was taken from Tigris River in Al-Zafraniya district of Baghdad city (see Figure 1), which is situated southeast of Baghdad between latitude (33°13′46″N) and longitude (44°28'45"E). It shares borders with Sadr City to the northeast and the communities of Al-Jadriya, Al-Doura, and Al-Karada to the north and west. Its residential districts, marketplaces, and industrial zones it is regarded as one of Baghdad's most important locations [8]. The Al-Zafraniya site was strategically selected due to its proximity to multiple anthropogenic activity zones, including residential neighborhoods, industrial workshops, and agricultural runoff areas. This location represents a typical urban-rural interface with high environmental stress, making it a priority area for water quality assessment. While this study focuses on a single location, the findings provide valuable insight into pollution dynamics within a critical segment of the Tigris River in Baghdad. It is acknowledged that this site alone cannot represent the full spatial variability of the river system. Future research should consider integrating multiple upstream and downstream points to enable a more comprehensive spatial analysis and better assess cumulative pollution loads across Baghdad's river stretch.
Figure 1. Maps of the study area in Baghdad city
Table 1. Physicochemical analysis techniques utilized for measurements
|
No. |
Water Parameters |
Unit |
Device or Tool |
Reference |
|
1 |
Air & water temperature |
℃ |
Digital thermometer |
- |
|
2 |
Turbidity |
NTU |
Turbidity-meter |
- |
|
3 |
Electrical conductivity |
µS/cm |
Multi-parameter analyzer EC, TDS meter, HANNA instruments |
- |
|
4 |
Total dissolved solids |
mg/L |
- |
|
|
5 |
pH |
- |
pH-meter HANNA Instruments |
- |
|
6 |
Chloride |
mg/L |
Titration with AgNO3 |
[11] |
|
7 |
Total hardness, Ca & Mg H. |
mg/L as CaCO3 |
Titration with Na2EDTA |
[11] |
|
8 |
Sulfate (SO4) |
mg/L |
Turbidimetric method |
[11] |
|
9 |
Nitrite (NO2) |
μg/L |
Cadmium column, spectrophotometer model (CE 1011 CECIL) at wavelength 543 nm |
[12] |
|
10 |
Nitrate (NO3) |
mg/L |
Spectrophotometer model (at 543 nm) |
[12] |
|
11 |
Phosphate (PO4) |
μg/L |
Ascorbic acid reduction method was used, spectrophotometer model (at 880 nm) |
[11] |
|
12 |
Silica (SiO2) |
mg/L |
The molybdo-silicate method, spectrophotometer (at 885 nm) |
[11] |
2.2 Sample collection
Samples were collected monthly for 6 months, from December 2023 until May 2024. Using a polyethylene bottle that had been cleaned twice with water sampling before being filled, water samples were taken for physicochemical examination. The temperature of the air and water, as well as the pH, have been measured in the field. Before use, laboratory equipment was calibrated [11].
Although the sampling period was limited to six consecutive months (December 2023 to May 2024), this timeframe was strategically selected to capture transitional climatic phases in central Iraq, particularly from the peak of the wet season to the early onset of dry conditions. This interval aligns with periods of heightened hydrological variability, influenced by seasonal rainfall, runoff, and rising temperatures. While the sampling does not cover a full annual cycle or extreme summer conditions, it provides representative insight into water quality dynamics during a critical transitional phase. The design acknowledges limitations such as the absence of high-temperature stress events or peak evaporation periods, which may influence parameters like salinity or dissolved solids. However, the chosen duration was also logistically constrained by field accessibility and academic timelines. Future work is recommended to extend monitoring to include hotter and drier months to provide a more complete seasonal representation.
2.3 Physical and chemical analysis
The parameters were measured in Ecology and Pollution Laboratory at Tikrit University College of Science. Table 1 lists the techniques used to analyze these factors.
2.4 Statistical analysis
Program [13] was used to detect the effect of different groups (patients and controls) on study parameters. Duncan's and /Least Significant difference were used to significantly compare between means. Estimate of the correlation coefficient between variables in this study.
3.1 Air and water temperature
The results of this study indicate that air temperature varied from 12.9℃ to 36.3℃, while water temperature ranged from 12.3℃ to 22.8℃. Water temperature reflected seasonal variations throughout the monitoring period (see Table 2).
The statistical analysis indicated significant temporal variations in air temperature during the initial four months of the study (December-March), with a notable difference (P ≤ 0.05) identified between April and May. The Pearson correlation coefficient in Table 3 indicated a positive correlation between air and water temperature (r = 0.950) at a significance level of P ≤ 0.05. Differences in air temperature are attributed to the water temperature change, which is a significant seasonal variance. Because solar radiation raises the temperature of surface water, elevated water temperatures are expected during dry months. Accordingly, heavy precipitation is blamed for lower water temperatures during rainy months [14, 15].
Table 2. Duncan's test for multiple variables in the study site
|
Sample of Tigris River |
Parameters |
|||||||||||||||
|
Air Temp. |
Water Temp. |
Turb. |
EC |
TDS |
pH |
Cl- |
Total Hard. |
Ca. Hard. |
Mg. Hard. |
SO4-2 |
NO2-2 |
NO3- |
PO4-3 |
SiO2-2 |
||
|
Months |
December |
15.2 c |
15 b |
27.3 b |
1150 a |
1150 a |
7.1 b |
36.5 a |
210 a |
122.5 cd |
87.5 a |
19.3 bc |
88.3 a |
11.4 a |
26.3 a |
2.6 a |
|
January |
16.3 c |
12.3 b |
22.0 b |
1115a |
1122 a |
8.3 a |
18.3 c |
215 a |
170.3 ab |
44.7 b |
23.2 a |
20.7 b |
11.2 a |
24.1ab |
2.85 a |
|
|
February |
12.9 c |
12.5 b |
10.5 c |
1011 a |
1013 ab |
8.3 a |
25 b |
218 a |
140.8 bc |
77.2 a |
22.0 ab |
20.5 b |
11.5 a |
22.1 b |
1.21 b |
|
|
March |
14.9 c |
13.9 b |
23.0 b |
1122 a |
1128 a |
7.5 ab |
25.5 b |
212 a |
133.4 bc |
78.6 a |
19.0 bc |
80.3 a |
9.11 b |
23.3ab |
3.1 a |
|
|
April |
25.3 b |
19.5 a |
44.0 a |
850 b |
930 bc |
8.5 a |
20.1 bc |
230 a |
190.1 a |
39.9 bc |
17.5 c |
24.0 b |
9.1 b |
23.9ab |
2.6 a |
|
|
May |
36.3 a |
22.8 a |
51.5 a |
820 b |
840 c |
7.9 ab |
20.0 bc |
120 b |
91.2 d |
28.8 c |
18.9 c |
25.1 b |
7.9 b |
23.5ab |
1.6 b |
|
|
|
L.S.D. |
4.922 * |
4.317 * |
12.84* |
174.37 * |
162.98 * |
0.992* |
5.52 * |
42.57 * |
37.87 * |
13.68* |
3.59 * |
12.92 * |
1.44 * |
3.19 * |
0.882 * |
|
Means with the different letters in same column differed significantly. * (P ≤ 0.05). Duncan's test |
||||||||||||||||
3.2 Air and water temperature
The results of turbidity ranged between 10.5 and 51.5 NTU in February and May, respectively Table 2. According to the World Health Organization, the recommended turbidity level for drinking water should not exceed 5 NTU. Therefore, all observed values in this study substantially surpass this guideline, particularly during the rainy season. While these levels may be typical for running surface water, such deviations indicate potential risks for conventional water treatment systems, as elevated turbidity can shield pathogens and reduce disinfection efficiency. However, it is important to note that this water originates from a river system and is expected to undergo sedimentation processes in drinking water treatment plants. These engineered treatment steps, such as coagulation, flocculation, and settling, are specifically designed to reduce turbidity-causing particles, including suspended solids and organic matter. As a result, the measured turbidity values, although elevated in raw water, do not necessarily represent a direct health risk, provided effective treatment is in place. The increase in turbidity during rainy months may be attributed to the influx of suspended solids, sediments, organic debris, and other particulate matter resulting from surface runoff and episodic flooding events [16, 17].
3.3 Electrical conductivity (EC) and total dissolved solids (TDS)
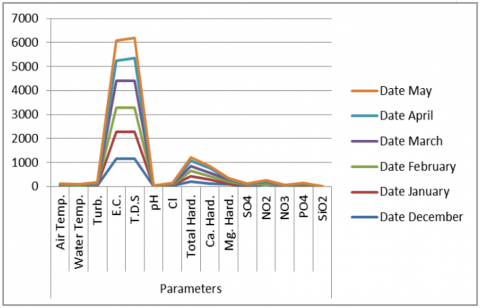
EC values ranged between (820-1150) µS/cm, whereas TDS values ranged 840-1150 mg/L. The majority of results for electrical conductivity (EC) and total dissolved solids (TDS) exceeded the permissible limits for drinking water, which are set at a maximum of 1000 µS/cm for EC and 500 mg/L for TDS [18]. The elevated electrical conductivity observed during the rainy season may result from the increased water levels and the influx of nutrients from the runoff of inorganic fertilizers from adjacent irrigated agricultural areas surrounding the river, coupled with the reduced evaporation rate that further elevates water levels during this period (January to March). Consequently, the conductivity of the water is contingent upon the concentration of ions and the nutrient composition present [19, 20]. On the other hand, the rises and falls of electrical conductivity values were consistent with the values of total dissolved solids during the study period in Figure 2, this was confirmed by the correlation coefficient shows a positive correlation (r=0.880) at P ≤ 0.01 (see Table 3), this was confirmed by Srishylam et al. [21].
3.4 pH
The pH levels of water ranged from 7.1 in April to 8.5 in December over the research period. The water samples are almost neutral to sub-alkaline in nature. In Iraq, the pH of water exhibits an alkaline shift from neutrality, attributable to the region's geological composition, predominantly consisting of CaCO3 [22], and this may be related to the soil and watershed characteristics of the study area. Consequently, water that has interacted with limestone for a relatively brief duration is expected to exhibit a low pH, and conversely [23, 24].
Figure 2. Monthly variations of parameters for water in the studied station
Table 3. Correlation coefficient between different parameters study of Tigris River
|
Parameters |
Water Temp. |
Tur. |
EC |
TDS |
pH |
Cl - |
Total Hard. |
Ca. Har. |
Mg. Hard. |
SO4-2 |
NO2-2 |
NO3- |
PO4-3 |
SiO2-2 |
|
Air Temp. |
0.95 ** |
0.93 ** |
-0.85 ** |
-0.87 ** |
0.19 |
-0.36 |
-0.62 * |
-0.23 |
-0.71 ** |
-0.40 |
-0.28 |
-0.73 ** |
-0.04 |
-0.28 |
|
Water Temp. |
- |
0.96 ** |
-0.63 * |
-0.64 * |
0.07 |
-0.22 |
-0.59 * |
-0.32 |
-0.57 * |
-0.61 * |
-0.22 |
-0.76 ** |
0.06 |
-0.24 |
|
Turb. |
|
- |
-0.65 * |
-0.52 * |
0.06 |
-0.21 |
-0.41 |
-0.19 |
-0.63 * |
-0.59 * |
-0.17 |
-0.60 * |
0.21 |
-0.06 |
|
E.C. |
|
|
- |
0.88 * * |
-0.43 |
0.35 |
0.35 |
0.04 |
0.55 * |
0.37 |
0.52 * |
0.59 * |
0.26 |
0.37 |
|
T.D.S. |
|
|
|
- |
-0.38 |
0.53 * |
0.52 * |
0.17 |
0.43 |
0.29 |
0.43 |
0.59 * |
0.20 |
0.52 * |
|
pH |
|
|
|
|
- |
-0.62 * |
0.17 |
0.51 * |
-0.41 |
0.26 |
-0.82 ** |
-0.06 |
-0.52 * |
-0.27 |
|
Cl - |
|
|
|
|
|
- |
0.19 |
-0.34 |
0.63 * |
-0.17 |
0.75 ** |
0.34 |
0.41 |
0.09 |
|
Total Hard. |
|
|
|
|
|
|
- |
0.59 * |
0.40 |
0.18 |
0.15 |
0.42 |
0.07 |
0.33 |
|
Ca. Hard. |
|
|
|
|
|
|
|
- |
-0.12 |
0.10 |
-0.22 |
0.26 |
-0.06 |
0.21 |
|
Mg. Hard. |
|
|
|
|
|
|
|
|
- |
0.12 |
0.52 * |
0.40 |
0.19 |
0.12 |
|
SO2 |
|
|
|
|
|
|
|
|
|
- |
-0.24 |
0.54 * |
-0.24 |
-0.17 |
|
NO2 |
|
|
|
|
|
|
|
|
|
|
- |
0.09 |
0.38 |
0.32 |
|
NO3 |
|
|
|
|
|
|
|
|
|
|
|
- |
0.21 |
-0.02 |
|
PO4 |
|
|
|
|
|
|
|
|
|
|
|
|
- |
0.32 |
3.5 Chloride Cl-
Chloride values ranged 20-36.5 mg/L in May and December respectively, chloride was within the permissible limits of 250 mg/L during the study period [18]. These results agree with these studies [16, 20, 21].
3.6 Total hardness, Ca, and Mg hardness
Total Hardness was recorded 120-230 mg/L as CaCO3, and Ca hardness values of the current study ranged between 91.2 and 190.1 mg/L as CaCO3 in April and December, respectively, while the Mg Hardness values ranged 28.8-87.5 mg/L as CaCO3 in May.
In general, the water of Tigris River is considered, according to the results of total hardness, to be very hard in most cases (the results were found to cross the standard limits > 180 mg/L as CaCO3 [18], the reason for the high values of total hardness during the study period, especially in the first months of study is may be because the rise in water levels due to rainfall, which led to the drift of pollutants and flows from nearby lands into the riverbed, and thus the total hardness values increased during these months [25, 26].
The statistical analysis showed the presence of positive correlation between total hardness and Ca, TDS, Mg, and EC at P ≤ 0.05 (r=0.590, r=0.520, r=0.400, and 0.350), respectively (see Table 3).
3.7 Sulfate SO4-2
Sulfate in most of the samples was found within a limited standard of 250 mg/L [18]. SO4 was recorded (17.5 -23.2) mg/L, it can be created by fertilizers or by the dissolution of rocks like gypsum rocks [20].
3.8 Nitrite NO2-2
The results of nitrite concentrations ranged between 20.5 and 88.3 μg/L in February and December, respectively. NO2 concentrations are expected to be significantly lower than those of nitrates; all nitrite levels in this investigation complied with WHO standards for drinking water, which stipulate levels below 0.2 mg/L (200 μg/L) [18]. The present work aligns with several investigations that have documented exceedingly low levels of nitrite, including those by Ahmed and Al-Shandah [27].
3.9 Nitrite NO3-
Nitrate values ranged of 7.9- 11.5 mg/L in May and February respectively, these values are within study [18] recommended standards for drinking water (< 50 mg/L). This reduction in nitrate concentrations is crucial for human health, as elevated levels of nitrate in drinking water can have severe and potentially fatal consequences for infants aged from birth to three months [28]. The cause of the NO3 concentration decrease during this study may have been consumed by plants and algae [24, 29].
3.10 Reactive phosphate (PO4-3)
Typically, water exhibits minimal phosphorus levels due to the limited solubility of indigenous phosphate minerals and the capacity of soils to retain phosphate [11], which aligns with the low phosphate concentrations seen in this study. The phosphate concentrations measured were 22.1 μg/L in February and 26.3 μg/L in December, respectively.
Reactive phosphate levels in the current study increased in December and January; these elevated concentrations are primarily attributed to drainage water enriched with phosphorus compounds [30]. Additionally, low phosphate levels may be linked to plants' and phytoplankton's propensity to collect high levels of phosphate in their bodies [31]. This is further corroborated by statistical analysis, which indicates a positive correlation between PO4 and NO2, NO3 (r= 0.380 and R=0.210) respectively.
The PO4 concentrations were within the prescribed limits (maximum permissible phosphate content of 0.25 mg/L) [18]. The statistical study revealed that, according to the analysis of variance for reactive phosphate, there were no significant temporal differences.
3.11 Reactive silicate (SiO2-2)
Reactive silicate values ranged from 1.21 to 3.1 mg/L in February and March, respectively. The results indicated consistently low silicate concentrations during the study period, potentially attributable to silicate uptake by phytoplankton, particularly diatoms, which are the only freshwater organisms that utilize silica in substantial amounts and are prevalent in the Tigris River [32, 33]. Additionally, the slow regeneration rate of silicate from sediments may also contribute to this phenomenon. All silica levels were under the acceptable limit (10 mg/L) established by the World Health Organization [18] for drinking water.
According to the WHO Water Safety Framework, physicochemical parameters serve as early warning indicators of potential waterborne health risks. High turbidity can shelter microbial pathogens and reduce the effectiveness of disinfection. Nitrate levels exceeding safe thresholds are particularly dangerous for infants, causing methemoglobinemia or “blue baby syndrome.” Elevated electrical conductivity and TDS may signal the presence of dissolved ions, heavy metals, or industrial waste, compromising water safety.
Furthermore, extreme pH values can lead to corrosion in distribution systems, increasing the risk of toxic metal leaching. Total hardness may affect not only palatability but also cause scaling in plumbing, indirectly affecting sanitation. Elevated phosphate levels can accelerate eutrophication, leading to harmful algal blooms and microbial contamination.
In the context of this study, several measured values deviated from WHO-recommended guidelines, emphasizing the need to integrate continuous water quality surveillance with preventive control measures. This approach aligns with WHO multi-barrier strategy, which advocates for risk assessment, source protection, treatment optimization, and regulatory enforcement to ensure public health safety [18].
The physical and chemical parameters of the Tigris River water in the Al-Zafraniya region during the six-month monitoring period showed notable seasonal variations. While several parameters remained within the permissible limits for drinking water, others—such as turbidity, total hardness, and electrical conductivity—exceeded the recommended thresholds. Accordingly, the water may be used for drinking purposes only after proper sedimentation, filtration, and disinfection.
Given that this river segment serves as a major water source for drinking water projects in Baghdad, it is crucial to implement enforceable environmental policies. These should include mandatory industrial wastewater pretreatment, periodic inspections of effluent discharge, and penalties for unauthorized direct disposal of waste into the river. Such measures would mitigate the deterioration of river water quality and protect public health.
It is important to highlight that this study focused solely on physicochemical parameters due to methodological and resource limitations. Critical factors such as microbial contaminants (e.g., fecal coliforms) and heavy metals were not assessed and are recommended for inclusion in future investigations to ensure a more comprehensive evaluation of public health risks.
The authors are very thankful to the Departments of Biology, College of Science at Tikrit and Al-Mustansiriyah Universities for their support and provision of laboratory space for this study.
|
Air Temp. |
Air Temperature ℃ |
|
Water Temp. |
Water Temperature ℃ |
|
Turb. |
Turbidity |
|
NTU |
Nephlometric Turbidity Unit |
|
EC |
Electrical Conductivity µS/cm |
|
TDS |
Total Dissolved Solids mg/L |
|
pH |
Hydrogen Ion Concentration (pH) |
|
Cl⁻ |
Chloride Ion Concentration mg/L |
|
Total Hard. |
Total Hardness (as CaCO3) mg/L |
|
Ca.H |
Calcium Hardness (as CaCO3) mg/L |
|
Mg.H |
Magnesium Hardness (as CaCO3) mg/L |
|
SO₄²⁻ |
Sulfate Ion Concentration mg/L |
|
NO22⁻ |
Nitrite Concentration µg/L |
|
NO3⁻ |
Nitrate Concentration mg/L |
|
PO4³⁻ |
Reactive Phosphate Concentration µg/L |
|
SiO2 ²⁻ |
Reactive Silicate Concentration mg/L |
[1] Li, L., Wu, J., Lu, J., Li, K., Zhang, X., Min, X., Xu, J. (2022). Water quality evaluation and ecological health risk assessment on trace elements in surface water of the northeastern Qinghai-Tibet Plateau. Ecotoxicology and Environmental Safety, 241: 113775. https://doi.org/10.1016/j.ecoenv.2022.113775
[2] Parween, S., Siddique, N.A., Mahammad Diganta, M.T., Olbert, A.I., Uddin, M.G. (2022). Assessment of urban river water quality using modified NSF water quality index model at Siliguri city, West Bengal, India. Environmental and Sustainability Indicators, 16: 100202. https://doi.org/10.1016/j.indic.2022.100202
[3] Karaoui, I., Arioua, A., Elhamdouni, D., Nouaim, W., Ouhamchich, K.A., Hssaisoune, M. (2022). Assessing water quality status using a mathematical simulation model of El Abid River (Morocco). Journal of Water Management Modeling, 30: C491. https://doi.org/10.14796/JWMM.C491
[4] Ramakrishnan, S., Anusha, G., Kirupasankar, K., Venkatesh, C., Pradeep, S. (2021). A study on the water quality assessment of Bhavani River in Tamil Nadu. IOP Conference Series: Earth and Environmental Science, 1145: 012068. https://doi.org/10.1088/1757-899X/1145/1/012068
[5] Villarmino, J., Quevedo, E.S. (2021). Physicochemical characterization of the water in Pagbanganan River, Baybay City, Leyte, Philippines. International Journal of Innovative Science and Research Technology, 7: 234-240.
[6] Isibor, P.O., Izegaegbe, J.I., Feeman, O.E. (2016). Water quality of perturbed Egbokodo River, Delta State, Nigeria. International Journal of Environmental Sciences, 1(5): 54-69.
[7] Wadeea, S.I., Hamdoon, R.M., Al-Zuhairy, M.S. (2022). Effects of industrial wastewater on water quality of the Tigris River at Baghdad using GIS technique. Journal of Techniques, 4(4): 1-11. https://doi.org/10.51173/jt.v4i4.569
[8] Aljewari, A.F.M., Al-Salman, I.M.A. (2023). Evaluation of heavy metals concentration in street, storm, and suspended dust in Al-Zafraniya area, Baghdad-Iraq. Ibn Al-Haitham Journal for Pure and Applied Science, 36(1): 1-14. https://doi.org/10.30526/36.1.2973
[9] Dhary, M.S., Abdulhussein, F.M. (2024). Pollution assessment of the Tigris River sediments resulting from wastewater discharge in Baghdad, Iraq. Iraqi Geological Journal, 57(2A): 47-61. https://doi.org/10.46717/igj.57.2A.4ms-2024-7-14
[10] Al-Ansari, N., Adamo, N., Sissakian, V., Knutsson, S., Laue, J. (2018). Water resources of the Tigris River catchment. Journal of Earth Sciences and Geotechnical Engineering, 8(3): 21-42.
[11] APHA. (2017). Standard Methods for the Examination of Water and Wastewater (23rd ed.). Washington DC: American Public Health Association.
[12] Strickland, J.D.H., Parsons, T.R. (1972). A Practical Handbook of Seawater Analysis (2nd ed.). Ottawa, Canada: Fisheries Research Board of Canada. http://doi.org/10.25607/OBP-1791
[13] SPSS/IBM. (2019). SPSS Statistics 26 Step by Step. New York Routledge. https://doi.org/10.4324/9780429056765
[14] Meme, F.K., Arimoro, F.O., Nwadukwe, F.O. (2014). Analyses of physical and chemical parameters in surface waters nearby a cement factory in North Central, Nigeria. Journal of Environmental Protection, 5(10): 826-834. https://doi.org/10.4236/jep.2014.510085
[15] Darweesh, S.A.F. (2017). Water quality assessment of Tigris River by diatoms community between Al-Aziziyah and Kut/Iraq. Arabian Journal of Geosciences, 13: 654.
[16] Jasim, H.A., Ali, S.F. (2024). Diatom indices for assessment of the water quality in the Lower Zab/Kirkuk Governorate. Egyptian Journal of Aquatic Biology and Fisheries, 28(4): 1197-1207. https://doi.org/10.21608/ejabf.2024.373445
[17] Nababa, A.S., Yusuf, Z.A., Umaru, J. (2024). Physicochemical parameters and fish catches of Zobe Reservoir in Katsina State, Nigeria. Sahel Journal of Life Sciences FUDMA (SAJOLS), 2(1): 78-95. https://doi.org/10.33003/sajols-2024-0201-010
[18] World Health Organization. (2022). Guidelines for Drinking-Water Quality (4th ed., incorporating 1st and 2nd addenda). https://www.who.int/publications/i/item/9789241549950.
[19] Al-Shandah, B.T., Ali, S.F. (2019). Reduction turbidity of water in Tikrit drinking water treatment plant by using alum which was quantified by a jar test apparatus, with limnological study of treated and raw water. Indian Journal of Public Health, 10(8). https://doi.org/10.5958/0976-5506.2019.02126.0
[20] Allawi, K.A., Ali, S.F., Ahmed, A.M. (2023). Evaluation of Tigris River quality for irrigation purposes within Salah Al-Din province/Iraq. South Asian Research Journal of Applied Medical Sciences, 5(5): 89-95. https://doi.org/10.36346/sarjams.2023.v05i05.003
[21] Srishylam, B., Rajashekhar, A.V., Jagadeeshwara Chari, T. (2024). Evaluation of physico-chemical parameters to assess water quality of Singaraya Reservoir of Siddipet District. African Journal of Biomedical Research., 27(3S): 123-134. https://doi.org/10.53555/AJBR.v27i3S.1871
[22] Ali, S.F., Hassan, F.M., Abdul-Jabar, R.A. (2017). Water quality assessment by diatoms in Tigris River, Iraq. International Journal of Environment & Water, 6(2): 53-64.
[23] Champion, K.M., Starks, R. (2001). The hydrology and water quality of springs in west-central Florida. Water Quality Monitoring Program. Southwest Florida Water Management District.
[24] Ali, S.F., Hassan, F.M., Abdul-Jabar, R.A. (2019). Ecological study of epiphytic diatoms on two submerged aquatic macrophytes in Tigris River, Iraq. Iraqi Journal of Agricultural Sciences, 50(4): 1109-1119. https://doi.org/10.36103/ijas.v50i4.756
[25] Allawi, K., Ali, S.F. (2023). Assessment of water quality of Tigris River by using WQ index in Salah Al-Din Province. GSC Biological and Pharmaceutical Sciences, 24(2): 80-86. https://doi.org/10.30574/gscbps.2023.24.2.0290
[26] Alwan, I.A., Saeed, I.O. (2024). Monitoring pollution indicators of the water of the Tigris River in Tikrit and its suburbs. Egyptian Journal of Aquatic Biology & Fisheries, 28(2): 131-146. https://doi.org/10.21608/EJABF.2024.346018
[27] Ahmed, Y.S., Al-Shandah, B.T. (2024). Evaluating the efficiency of oil waste treatment plant in Al-Qayyarah Refinery-Iraq. Tikrit Journal of Pure Science, 29(5): 19-29. https://doi.org/10.25130/tjps.v29i5.1672
[28] Greer, F.R., Shannon, M. (2005). Infant methemoglobinemia: the role of dietary nitrate in food and water. Pediatrics, 116(3): 784-786.
[29] Ali, H.A., Owaid, M.N., Ali, S.F. (2020). Recording thirteen new species of phytoplankton in Euphrates River environment in Iraq. Walailak Journal of Science and Technology (WJST), 17(3): 200-211.
[30] Ahmed, Y.S., Al-Shandah, B.T. (2024). Evaluating water quality of the Tigris River in the Qayyarah District/Nineveh/Iraq through the concentrations of some heavy metals and some limnological parameters. Egyptian Journal of Aquatic Biology and Fisheries, 28(4): 23-39.
[31] Ali, S.F., Hays, H.H., Abdul-Jabar, R.A. (2021). Application of CCME water quality index for drinking purpose in Tigris River within Wasit Province, Iraq. Caspian Journal of Environmental Sciences, 19(5): 781-787. https://doi.org/10.22124/cjes.2021.5208
[32] Ali, S.F., Al-Shandah, B. (2021). Estimation of some plant nutrients and heavy metals in Euphrates River at the cities of Ramadi and Khalidiah. Pollution Research, 40(1): 354-361.
[33] Al-Shandah, B.T., Jalal, T.K., Nashaat, R.M. (2022). Seasonal species diversity, dominance and density of diatomic phytoplankton in Tigris River, Baghdad Province, Iraq. Caspian Journal of Environmental Sciences, 20(5): 871-899. https://doi.org/10.22124/CJES.2022.6036