Ahmed S. Salman![]() | Omid Jahanian
| Omid Jahanian![]() | Mustafa A. Almaliki*
| Mustafa A. Almaliki*![]() | Tabark J. Alwan
| Tabark J. Alwan![]()
© 2025 The authors. This article is published by IIETA and is licensed under the CC BY 4.0 license (http://creativecommons.org/licenses/by/4.0/).
OPEN ACCESS
The objective of this paper is to examine the design effect of the gas flow field on fuel cell performance. A polymer electrolyte membrane (PEM) fuel cell with 10 W power output operating at 3 A and 4.5 V has been simulated. The study investigates seven configurations of fuel cell assemblies featuring a Z-shaped flow field and explores the effects of various flow fields and flow channel designs. Single Z-type serpentine flow fields with a channel width of 1 mm were modeled to create interconnected pathways. CFD COMSOL Multiphysics 6.1 was used to analyze a three-dimensional, steady-state, isothermal fuel cell model with an active area of 9.84 cm². The study focused on pressure loss, reactions and product distributions, and current density within the fuel cell. Results showed that Model E2 achieved the lowest anode pressure drop at 7 Pa, while Model A1 exhibited the highest pressure drop at 180 Pa, indicating Model E2's superior pressure management. Cathode pressure analysis revealed that Models A1 and A2 generated the highest pressures. Polarization curve analysis determined that Model A2 delivered the highest current density but at elevated pressures up to 1200 Pa. Among the tested configurations, Model E2 emerged as the optimal design, offering excellent performance with minimal pressure drop and enhanced current density. It enabled uniform reactant gas dispersion, leading to a consistent and reliable current distribution across the electrode surface. Moreover, the Model E2 design promoted improved lateral species transfer and uniform species distribution within the gas diffusion layer, contributing to its superior performance.
cathode and anode performance, flow field design, PEM fuel cells, performance optimization, Proton exchange membrane, reactant distribution
Fuel cells are an emerging energy technology that offers an alternative to traditional combustion-based power generation systems. They generate electricity through an electrochemical process that converts the chemical energy stored in fuels, such as hydrogen and methane, into electricity, with water and heat as byproducts.
Applications for fuel cells today range from stationary power generation to transportation. Despite their advantages, fuel cells face several challenges that limit their widespread adoption. One of the main challenges is the cost of fuel cell systems, which remains relatively high compared to traditional power generation systems. Additionally, fuel cells require high-purity fuels and specific operating conditions, which can be difficult and expensive to achieve. Another challenge is the lack of infrastructure for storing and distributing hydrogen, which limits the use of fuel cells in transportation applications [1, 2].
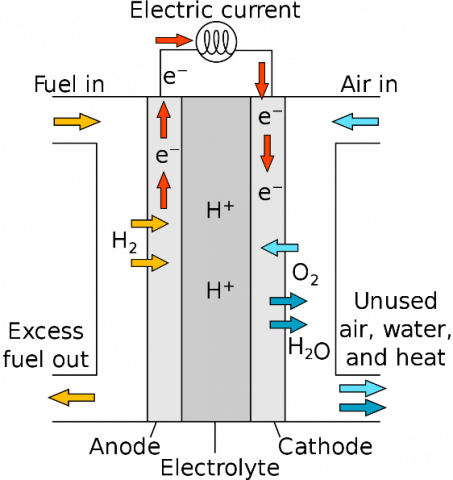
Fuel cells are an emerging energy technology that offers several advantages over conventional power generation systems. They generate electricity through an electrochemical process that converts the chemical energy stored in fuels such as hydrogen and methane into electricity [3]. Fuel cells are highly efficient and produce fewer greenhouse gas emissions than traditional power plants, making them an attractive option for addressing [4]. The fundamental design of the proton exchange membrane (PEM) fuel cell involves placing two electrodes on either side of an electrolyte. Hydrogen and oxygen cross over each electrode, producing electricity, heat, and water through a chemical reaction. The fuel cell supplies hydrogen fuel to its anode (negative terminal). The fuel cell's cathode (positive terminal) receives oxygen. A chemical process divides hydrogen into an electron and a proton. Each route to the cathode is unique. When used effectively, electrons can create energy for a load without going through the electrolyte. The proton travels through the electrolyte before rejoining the electron at the cathode. The electron, proton, and oxygen combine to make water, which is a harmless byproduct. Figure 1 depicts this procedure [5].
In general, fuel cells are defined primarily by the kind of electrolyte used and the difference in start time, which ranges from one second for PEM fuel cells to 10 minutes for solid oxide fuel cells.
Table 1. Type of fuel cell and the characteristics of each type
|
Item |
AFC |
PEMFC |
PAFC |
MCFC |
SOFC |
|
Operation Temperature |
90-100℃ |
50-100℃ |
150-200℃ |
600-700℃ |
700-1000℃ |
|
Applications |
50-100 kW transport, space, and ship |
transport, automobiles, space, ships, residences, and mobile Apple 20 kW |
100 MW plants 50-500 kW block heating plants |
100 MW plants, 50-500 kW block, heating plants |
50-500 kW block heating plants 100 MW plants |
|
Advantages |
Cathode reaction is quicker in alkaline electrolytes, resulting in excellent performance. |
•Solid electrolyte, reduces corrosion & electrolyte management, problems, •Low temperature, •Quick start-up |
Increased tolerance to fuel contaminants due to higher temperature |
•High efficiency, •Fuel flexibility, •Can use a variety, of catalysts, •Suitable for CHP |
•High efficiency, •Fuel flexibility, •Can use a variety of catalysts, •Solid electrolyte •Suitable for CHP & CHHP, •Hybrid/GT cycle |
|
Efficiency |
50-66% |
50-85% |
30-45% |
45-60% |
50-60% |
|
Common |
Aqueous potassium hydroxide solution immersed in a matrix |
Perfluoro sulfonic Acid |
Soaking phosphoric acid in a matrix |
Solution of lithium, sodium, and/or potassium carbonates soaked in matrix |
Yttria stabilized zirconia |
Figure 1. Fundamental fuel cell operation [5]
Fuel cells can be classified into different types based on their electrolyte, operating temperature, and fuel source [6, 7]. The main types of fuel cells are PEM fuel cells (PEMFCs), solid oxide fuel cells (SOFCs), alkaline fuel cells (AFCs), direct methanol fuel cells (DMFCs), and phosphoric acid fuel cells (PAFCs) [8-10]. PEMFCs are the most commonly used fuel cells, operating at relatively low temperatures and using hydrogen as the fuel source. SOFCs operate at high temperatures and can use a variety of fuels, including hydrogen, natural gas, and biogas. AFCs use potassium hydroxide as an electrolyte and operate at relatively high temperatures. Portable applications like mobile phones and laptops use DMFCs, which use methanol as their fuel source. PAFCs use phosphoric acid as the electrolyte and operate at relatively high temperatures [11]. Table 1 provides a detailed description and explanation of each type of fuel cell [12, 13]. Fuel cells offer several advantages over conventional power generation systems, including high efficiency, low emissions, and low noise. A range of applications, from small portable devices to large power plants, can utilize their high scalability.
Fuel cells can provide reliable and secure power, particularly in remote areas where grid access is limited or nonexistent. Due to their high efficiency, low emissions, and versatility, fuel cells have a wide range of potential applications. Vehicle manufacturers are developing fuel cells for use in cars, buses, and even airplanes. Hydrogen fuel cell vehicles can potentially reduce greenhouse gas emissions and dependence on fossil fuels. Buildings, data centers, and other applications that require reliable and uninterrupted power can utilize fuel cells as stationary power generators.
In many cases, fuel cells can provide heat and electricity, making them more efficient than traditional combustion-based generators. Fuel cells can also power portable devices like laptops, smartphones, and other electronics. Compared to batteries, fuel cells offer longer runtimes and faster recharge times, making them attractive for a range of applications [14, 15]. A crucial determinant impacting the efficiency of PEM fuel cells is the configuration and fortification of the gas flow pathways within the cell. Effective gas transfer is indispensable for attaining optimal electrochemical reactions and ensuring uniform dispersal of reactants across the membrane's surface. A careful study of the existing literature shows that there is a big knowledge gap and not many systematic studies that look into how to improve gas flow channels in PEM fuel cells. This is mostly because doing experiments is too expensive. Consequently, many researchers have turned to exploring alternative avenues, with COMSOL Multiphysics emerging as a pivotal tool that has broadened the scope for enhancing gas flow channels. Recognizing the pivotal role of these channels in overall cell performance, researchers have embarked on innovative approaches aimed at augmenting mass transport, minimizing pressure differentials, and refining water management within the cell. Table 2 provides an overview of the key researchers involved in advancing PEM fuel cell technology and their respective design endeavors.
Fuel cell technology is one of the most promising approaches to energy generation. However, there are some obstacles to using this technology as a replacement for fossil fuels. The effect of the design of the flow field (paths of flow gases) on the performance of PEM fuel cells is one of the most significant obstacles. However, numerous researchers in this discipline have theorized about this issue. In contrast, this study will experimentally investigate the effect of flow field design on the efficacy of PEM fuel cells.
Table 2. Summary of relevant published research
|
References |
Method |
Parameters /Type |
Boundary Conditions |
Figures |
|
Isanaka et al. [16] |
HT |
Schematic of flow field plate (parallel Z-type) -The dimensions of the flow field plate Ap = 5×5 cm2 Wc = 1-2 mm Hc = 1 mm |
Operating temperature = 80℃ -Pressure inlet = 2 atm |
|
|
Dehsara et al. [17] |
EX |
The bipolar plates of PEM fuel cells are fabricated by (A) Graphite, (B) Stainless Steel (SS316), (C) Aluminum, and (D) Titanium. (Parallel Z-type and serpentine) The dimensions of the field flow plate Ap = 5×5 cm2 Wc = 1 mm Hc = 1 Wr = 1 m |
operating temperature = 80℃ -Cathode inlet flow rate = 5.83×10⁻⁶ [m3/s] -Anode inlet flow rate = 5×10⁻⁶ [m3/s] -Pressure inlet = 2 atm |
|
|
Maharudrayya et al. [13] |
TH |
Schematic diagram of flow field plates (A- U-type, B- 2U-type with and without modification, CZ-type, D- 3Z-type). The dimensions of the field flow plate Wh = 4 mm, Hh = 1.5 mm Wc = 2 mm, Hc = 0.72 mm Wr = 2 mm
|
The mass flow rate of Air = 2.2×10⁻⁵ kg/s |
|
|
Wang [18] |
TH |
-Schematic of flow field plates: (A)-single serpentine, (B)- Multiple serpentine, (C)-Straight parallel and (D)- Interdigitated. -The dimensions of the flow field plate Wh = 4 mm, Hh = 1.5 mm Wc = 2 mm, Hc = 0.72 mm Wr = 2 mm |
Re = 0-1000 |
|
|
Edupuganti and Daglen [19] |
TH |
Schematic of the flow field plates (A-Single serpentine with Wc = 0.5,1 and 1.5) and (B-Parallel Z-type with Wc = 0.5, 1 and 1.5) -The dimensions of the flow field plate Plate width = 24 mm Wc = 0.5-2 mm, Hc = 1 mm N = 10, Hc = 1 mm, length of channel Lc = 10 mm. |
Velocity of air = 0.1 m/s |
|
|
Pal et al. [20] |
TH |
The flow field channels (A) Uniform pin type, (B) Zigzag pin type, and (C) single serpentine. -The dimensions of the flow field plate Ap = 50×50 mm2 Wc = 2 mm, Hc = 2 mm Wr = 2 mm |
Pressure = 1 bar Temperature = 325 K |
|
|
Her et al. [21] |
EX |
The dimensions of the flow field plate Ap = 5 cm2 Hp = 0.25 mm, Wc = 0.3 mm Hc = 0.2 mm, Wr = 0.6, 0.3 and 0.15 mm |
The hydrogen flow rate = 20 and 30 cm3/s -The airflow rate = 100 and 150 ccm/s, - Pressure = 97 kPa, Temperature = 25℃ |
|
|
Ahmed and Sung [22] |
TH |
cross-sectional view of different geometrical configurations analyzed: A) Rectangular; B) Trapezoidal; C) Parallelogram. -The dimensions of the flow field plate Case (a): Wc = 0.8 mm, Hc = 1 mm and Wr = 0.4 mm Case (b): Wc = 0.9 mm, Hc =1 mm and Wr = 0.35 mm Case (c): Wc = 0.8 mm, Hc = 1 mm and Wr = 0.4 mm |
Anode and cathode pressure = 1atm -Cell temperature = 70℃ -Anode temperature = 80℃ -Cathode temperature = 70℃ |
|
|
Ramesh and Duttagupta [23]
|
TH |
The schematic PEM fuel cell model The dimensions of the field flow plate Wc = 0.5, 1, 1.5, and 2 mm Wr = 0.2, 0.7, 1, and 1.2 mm |
Anode inlet flow velocity of hydrogen = 0.2 m/s -Cathode inlet flow velocity of oxygen = 0.5 m/s |
|
|
Shen and Tu [24] |
TH |
Height of main channel 1.0 x 10⁻³ m, length of main channel 1.0 x 10⁻³ m, Number of flow channel 50, Thickness of catalyst layer 1.0 x 10⁻⁵ m. |
Output voltage increasing to 4.4% at 1.6 A cm-2 and up to 10% at 2 A cm-2 |
|
|
Yang et al. [11] |
TH |
Channel width/depth [mm]: 1 / 1, BP length/width/height [mm]: 100 / 2 / 1.5, Block width [mm]: 2.0, GDL thickness [mm]: 0.3, CL thickness [mm]: 0.0129, PEM thickness [mm]: 0.108 |
Inlet Pressure: 101,325 Pa, Inlet Temperature: 343.14 K, Ratios: Anode: 1.5 and 3.0, Cathode: 2.0 and 3.0 |
|
|
Sugii and Okamoto, [25] |
EX |
Schematic of flow field such as: A-Single serpentine and B- Parallel Z-type. The dimensions of the field flow plate Wc = 1 mm, Hc = 0.5 mm |
Averaged velocity = 0.4 and 2.0 m/sec, which corresponded to Reynolds number = 26 and 130, respectively |
|
|
Almaliki et al. [26] |
TH |
Z-shaped flow field with 19 designs (Z, S, U, W, spherical. |
Anode in flow = 0.27 m/s, Cathode in flow = 0.5 m/s H2 molar mass = 0.002 kg/mol, |
The objective of this paper is to develop a novel fuel cell design aimed at enhancing performance. Specifically, the study focuses on optimizing the distribution of reacting gases within the fuel cell, aiming to achieve even distribution across electrodes. This optimization serves two main purposes: firstly, to increase power density by maximizing power generation per unit electrode area, thereby facilitating the development of smaller, lighter, and more efficient fuel cell systems. Secondly, it enhances durability by mitigating localized electrode degradation caused by uneven gas distribution, thus prolonging the lifespan of the fuel cell.
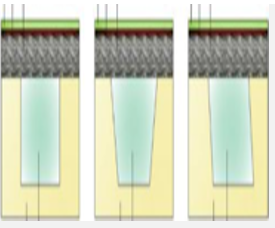
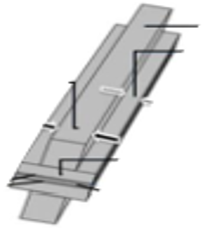
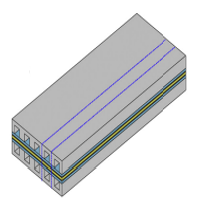
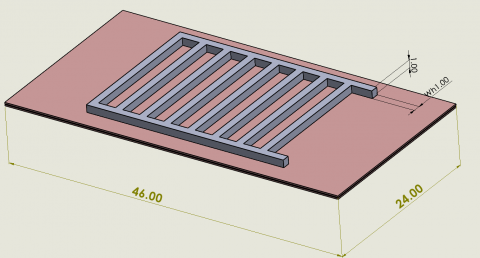
2.1 Designs of the models
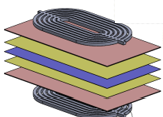
This section focuses on designing the models using SolidWorks 2020 software to import geometry and COMSOL Multiphysics software for computational modeling and simulation of a PEM fuel cell. The design process involved the incorporation of the essential components of the fuel cell, such as the anode, cathode, proton exchange membrane, gas channels, and flow field plates. The dimensions and configurations of these components are determined based on the recommendations and guidelines provided by Dhahad et al. [27], whose work has contributed valuable insights into fuel cell design.
2.2 Assumptions and boundary condition
The model is built upon several fundamental assumptions. Firstly, the steady state assumption posits that the system experiences no significant changes in operating conditions over time. Secondly, the model operates under the assumption of isothermal operation, maintaining a constant temperature throughout the system. Thirdly, the gas phase assumption stipulates that all reactants and products within the fuel cell exist solely in the gas phase, disregarding any potential presence of liquid or solid phases. Lastly, the ideal gas law assumption governs the behavior of all gases and water vapor within the system, relating to pressure, volume, and temperature. These assumptions serve as the cornerstone of the model, simplifying its mathematical representation. Selecting appropriate modeling parameters is crucial. Table 3 displays the ten different computational models, while Table 4 provides a comprehensive list of the computational domain dimensions and parameters utilized in this study, including those incorporated into the PEMFC model for COMSOL Multiphysics for each flow field employed in the current simulation.
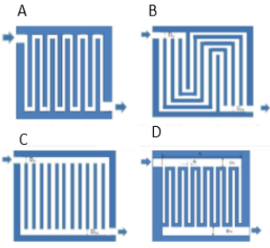
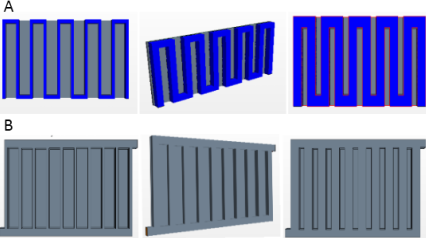
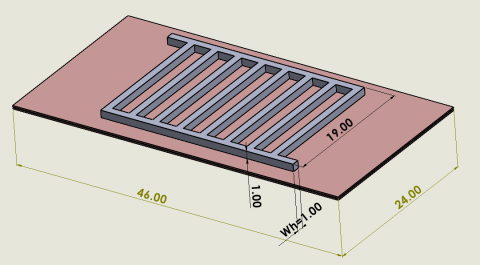
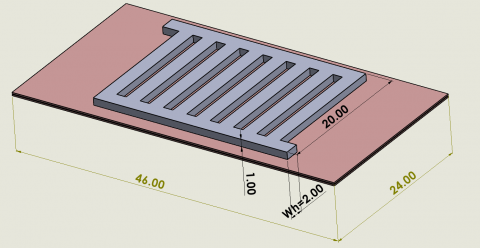
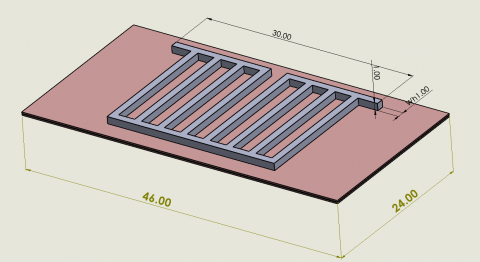
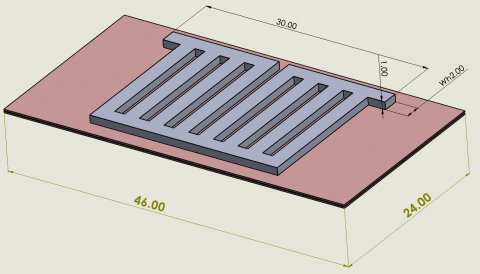
Table 3. The ten different proposed designs were investigated in the study
|
Name |
Description |
Computational Modeling |
|
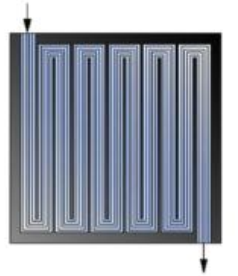
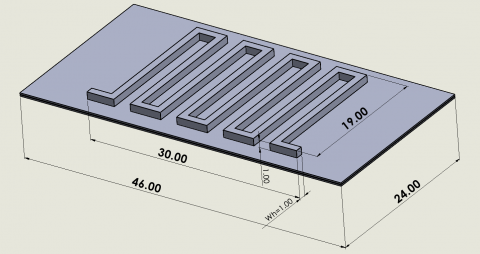
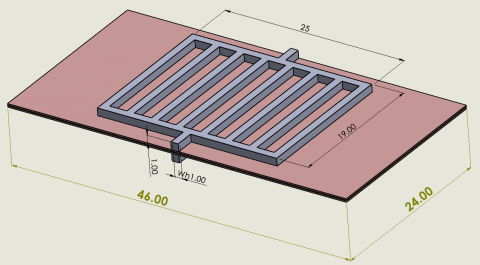
Model A1 |
single Z-type serpentine flow field design Wh = 1 mm |
|
|
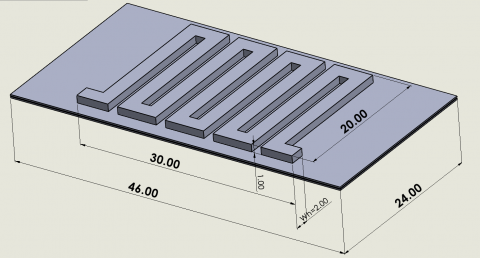
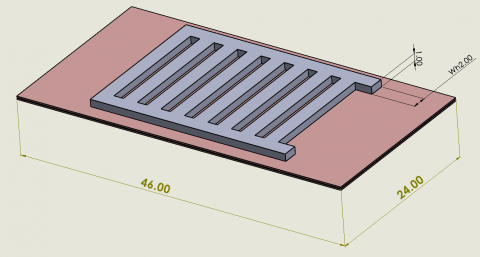
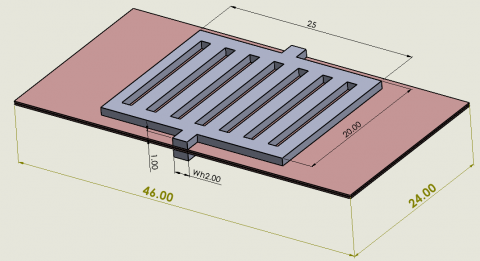
Model A2 |
change the area exposed to the reaction Model A1. It becomes double Wh = 2 mm |
|
|
Model B1 |
This changes the basic model by replacing the flow field and the entry and exit path in the gas flow channel pattern. |
|
|
Model B2 |
change the area exposed to the reaction Model B2. It becomes double Wh = 2 mm |
|
|
Model C1 |
changing the path of airflow by cutting off one side and narrowing the other path, forcing gases to pass through it, Wh =1 mm |
|
|
Model C2 |
modification of the C1 design, the change that was made, which is the change in the area of the gas entry area, Wh = 2 mm |
|
|
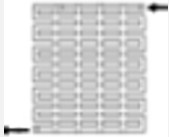
Model D1 |
the gas flow channels have a U-shaped path inside each channel, Wh =1 mm |
|
|
Model D2 |
modification of the D1 design, with Wh = 2 mm. |
|
|
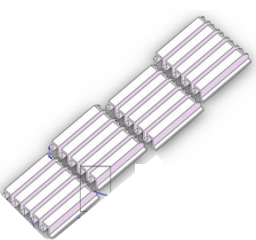
Model E1 |
Gas flow channels are modified to form a set of interconnected p-pathways with direct channels. |
|
|
Model E2 |
This design is a modification of the E1 design, with Wh = 2 mm. |
Table 4. The parameters incorporated into COMSOL Multiphysics for the PEMFC model encompass
|
Parameter |
Symbol |
Value |
|
Channel width (m) |
Wch |
1.1 x 10⁻³ |
|
Rib width (m) |
Wrib |
0.2 x 10⁻³ |
|
Channel height (m) |
Hch |
1.1 x 10⁻³ |
|
Anode viscosity (Pa.s) |
μaode |
8.42E-6 |
|
GDL permeability (m2) |
kappa_gdl |
1.18 x 10⁻³ |
|
Cell active area (cm²) |
A |
9.84 |
|
GDL width (m) |
Hgdl |
0.190 x 10⁻³ |
|
Porous electrode thickness (m) |
Helectrode |
0.015 x 10⁻³ |
|
Membrane thickness (m) |
Hmembrane |
0.050 x 10⁻³ |
|
Cathode Inlet mass fraction |
wO2_in |
0.3 |
|
Cathode inlet velocity (m/s) |
Uin_cathode |
0.5 |
|
GDL electric conductivity (s/m) |
σgdl |
222 |
|
Inlet H2 mass fraction (anode) |
wH2_in |
0.99 |
|
Inlet H2O mass fraction |
wH2O_in |
0.001 |
|
Anode inlet flow velocity (m/s) |
Uin_anode |
0.27 |
3.1 Validation of the models
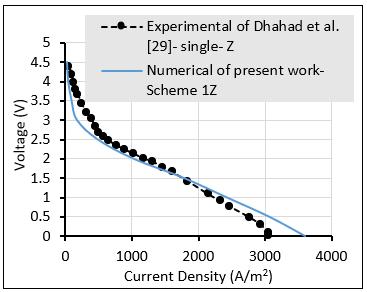
Validation was conducted by comparing the results obtained with those reported by Dhahad et al. [28] performed by a previous researcher. The comparison revealed that our findings closely aligned with those of the earlier study. Figure 2 shows the comparison of the numerical results for present work by COMSOL Multiphysics 6.1 and experimental results [28] of the baseline design single serpentine Z flow field, i.e., the operation voltage, Vcell versus the current density of fuel cells, I (A/m2).
The comparison indicates that the simulation results are in favorable agreement with experimental data. At high current densities, the experimental results of Dhahad et al. [28] have low value compared to the simulation results of the present work due to some differences in physical parameters, like reactants inlet boundary conditions, relative humidity of gases, coefficient stoichiometric of anode, and cathode.
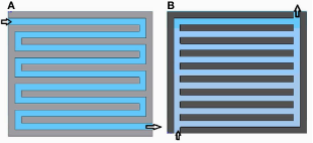
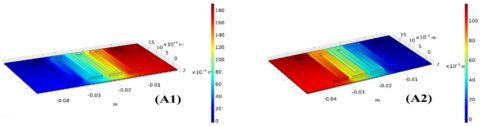
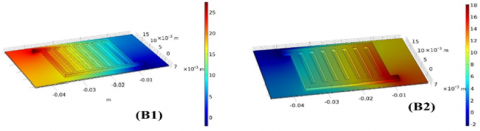
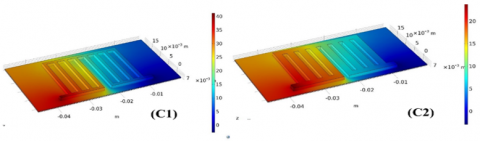
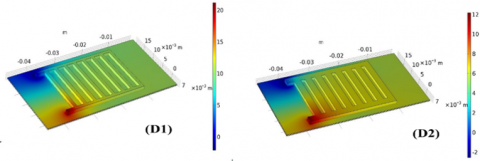
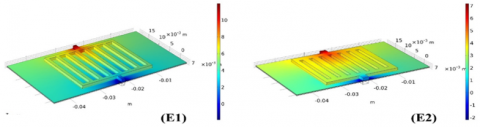
The numerical results illustrate the behavior of the flow field in terms of pressure loss distributions, species concentration distributions, and current density distribution over the electrolyte surface. Pressure distribution is thought to be a key component of the PEM fuel cell's performance. The pressure distribution through the various flow field designs on the cathode and anode side at 0.4 V, respectively, is depicted in Figure 3. The results show that the pressure falls throughout the flow field since it is highest at the start of the flow field and lowest with 0 Pa at the outlet with a reference pressure is 101,325 Pa. The parallel Z flow field design exhibits low-pressure drop-in comparison to other flow field designs, as can also be seen from the findings of Model B1, Model C1, Model C2, Model D1, Model D2, Model E1, and Model E2. Gases are compelled to pass through the serpentine, connecting the intake and outlet, which is the cause of this.
Figure 2. Comparison of the numerical results for present work and experimental results of Dhahad et al. [28]
Figure 3. The distribution of pressure drops across flow field designs Model (A1, B1, C1, D1, E1, A2, B2, C2, D2, E2) on the anode side at 0.4 V
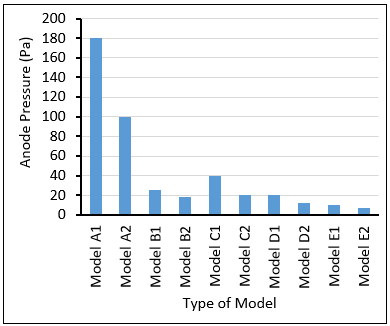
Serpentine is beneficial for managing water. However, because of the significant pressure loss, it also results in power losses. The Parallel Z flow field's maximum pressure loss values for Models A1, B1, C1, D2, and E1 are 180, 25, 40, 20, 12, and 10 Pa, respectively, and for Models A2, B2, D2, and E2 are 100, 18, 20, 12 and 7 Pa, respectively. The performance of double and triple serpentines is inferior to single serpentines, although an increase in the number of channels, particularly serpentine flow fields, reduces pressure losses. Due to a single serpentine flow channel, high pressure and high power are provided. The pressure generally fell as the fluids moved from the entrance to the outlet in the pressure distribution scenes of the flow fields for all flow field designs.
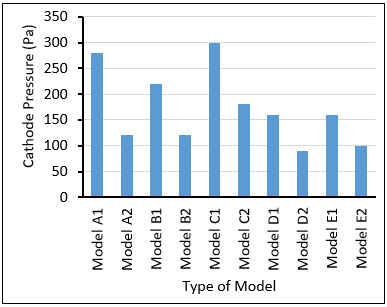
Figures 4 and 5 show the Bar chart for the Cathode and Anode side, respectively, and show that the lowest pressure obtained is model D2 with 90 pa for the cathode side and model E2 with 7 pa for the anode side. The distribution of oxygen concentration plays a crucial role in the performance of PEM fuel cells, with restrictions in oxygen transport significantly impacting their efficiency. It is essential to comprehend how oxygen transport operates in the cathode channel, gas diffusion layer (GDL), and catalyst layer. The Schemes (Model E1 and Model E2) flow field design offers a low-pressure difference; however, its drawback is poor water management inside the cell. This is due to two main factors: the first is friction, which causes a pressure loss along the header, and the second is inertial forces, which represent the momentum of working fluid going into the channel's inlet header. These forces tend to bring the gases toward the closed end and produce a pressure rise, leading to the maximum pressure at the lateral channel (higher flow velocity). The gases pass over different parallelly divided ways, resulting in dropping the length of the paths; consequently, the gases flow in smaller paths than in a serpentine design. This behavior concurrently reduces the pressure drop and the velocity of reactant gases along the channels.
Additionally, because of many parallel paths, the velocity of reactant gases from the inlet to the outlet is not identical; it varies from channel to channel. Reactants spread heterogeneously above the active surface area as a result. At high current density regions (low voltage), the electrochemical reaction is swift and consumes much oxygen. Therefore, the quantity of oxygen is not adequate for the reactions, leading to a reduction of the reactant gases at the zones with low gas flow, which will reduce the performance of the fuel cell significantly. From simulation results, it can be seen that high-pressure losses on the cathode side compared with those on the anode side. This can be related to the form of water caused by an electrochemical reaction on the cathode side. So, it needs to have high power to overcome the accumulation of water. This power needs to be high.
Figure 4. Pressure drop in the cathode side of ten simulated models
The simulation prediction of pressure on both sides, anode, and cathode, it can be seen that the serpentine Model A1 is the worst part of the high-pressure drop. This can be related to providing high power and accomplished power. Oxygen distribution was examined in both the Cathode and Anode sides across ten different flow field designs, revealing a progressive decrease in oxygen concentration from the entrance to the output due to consumption at the catalyst layer. Additionally, the GDL exhibited higher oxygen content under the channel area compared to the land area, highlighting a typical feature of its distribution. Water concentration, a byproduct of the electrochemical reaction within the PEM fuel cell, poses challenges as its accumulation obstructs pores in the GDL and catalyst layers, impairing cell function.
Figure 5. Pressure drop in the anode side of the ten simulated models
Methods to mitigate water buildup include evaporation, water-vapor diffusion, capillary transport through the GDL into the flow channels, and water back-diffusion through the membrane to the anode. Analysis indicated that Model B2 exhibited similar water intake levels at 5 mole/m3 but lower outflow levels at 0.016 mole/m3, attributed to water used for electrolyte moistening. These findings are detailed in Table 5.
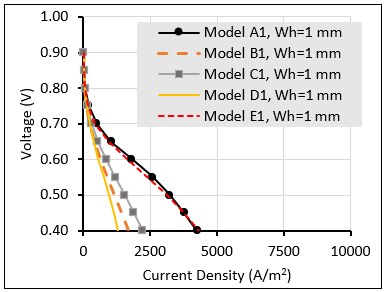
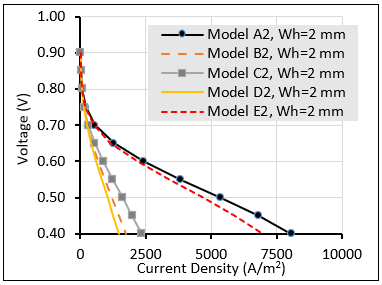
Activation losses arise due to the sluggish kinetics of the electrode surface reactions, leading to a notably nonlinear voltage drop. Fuel crossover and internal currents, resulting from fuel wastage across the electrolyte and electron conduction within it, can be disregarded for PEM applications. Ohmic losses denote resistive effects occurring as electrons traverse the electrodes and interconnections alongside ion flow within the electrolyte. Mass transport or concentration losses predominantly emanate from changes in reactant concentrations occurring at the electrode surface. The current density was extracted after completing the range for the models (Model A1, Model A2, Model B1, Model B2, Model C1, Model C2, Model D1, Model D2, Model E1, Model E2) in Figures 6 and 7 show the comparison between each model that was designed at Wh = 1 and 2 mm, respectively and it turns out that the maximum current density design obtained is Model A2.
Table 5. Result of model fuel cell PEM
|
Model |
Anode Hydrogen Concentration |
Anode Pressure (Pa) |
Anode Water Concentration (mol/m3) |
Cathode Oxygen Concentration (mol/m3) |
Cath. Pressure (Pa) |
Cath. Water Concentration (mol/m3) |
|
A1 |
11.4 |
180 |
0.024 |
3 |
1800 |
5 |
|
A2 |
11.4 |
100 |
0.023 |
3 |
1200 |
5 |
|
B1 |
11.4 |
25 |
0.0175 |
3 |
220 |
4.5 |
|
B2 |
11.4 |
18 |
0.016 |
3 |
120 |
4.5 |
|
C1 |
11.4 |
40 |
0.018 |
3 |
300 |
4.5 |
|
C2 |
11.4 |
20 |
0.0165 |
3 |
180 |
4.5 |
|
D1 |
11.4 |
20 |
0.028 |
3 |
160 |
4.5 |
|
D2 |
11.4 |
12 |
0.026 |
3 |
90 |
4.5 |
|
E1 |
11.4 |
10 |
0.03 |
3 |
160 |
5 |
|
E2 |
11.4 |
7 |
0.026 |
3 |
100 |
5 |
Figure 6. Current-voltage correlation within an individual PEMF for (Model A1, Model B1, Model C1, Model D1, Model E1) at Wh = 1 mm
Figure 7. Current-voltage correlation within an individual PEMF for (Model A2, Model B2, Model C2, Model D2, Model E2) at Wh = 2 mm
This study investigated the impact of flow field design on the performance of PEM fuel cells using theoretical simulations. The contributions of this work are as follows:
Pressure Drop Management: The results revealed that the E2 model outperforms other designs in managing pressure drop, with the lowest pressure drop at the anode side (7 Pa). This indicates its potential for improving fuel cell efficiency by minimizing energy losses due to pressure gradients.
Cathode Pressure Performance: The A1 and A2 models were found to produce the highest pressures at the cathode, which aligns with expectations given the chemical reactions occurring in this region. This insight is crucial for designing flow fields that optimize pressure conditions for enhanced fuel cell performance.
Current Density Optimization: Analysis of polarization curves identified the A2 model as delivering the highest current density, particularly at high pressures of up to 1200 Pa. This highlights the importance of pressure management in maximizing fuel cell output.
Best Overall Design: Among the designs studied, the E2 model emerged as the most effective, proving upper-pressure distribution and efficient management of reactants and products.
The following are recommended as future work and extensions of the research.
Long-term Performance: Investigating the long-term durability and performance of the E2 model under varying operating conditions.
Advanced Flow Field Designs: Further exploration of alternative flow field designs or modifications to the E2 model could yield even greater improvements in fuel cell efficiency and performance.
|
T |
Temperature, C |
|
P |
Pressure, Pa |
|
A |
Area, mm2 |
|
C |
Concentration, mol/m3 |
|
Dji |
Binary diffusion coefficient, m2/s |
|
Hch |
Channel height, m |
|
Hgdl |
Gas diffusion layer height, m |
|
Helectrode |
Porous electrode thickness, m |
|
Hmembrane |
Membrane thickness, m |
|
Abbreviations |
|
|
CFD |
Computational Fluid Dynamic |
|
GDL |
Gas diffusion Layer |
|
GSSEM |
Generalized steady-state electrochemical model |
|
PEM |
Proton Exchange Membranes |
[1] Dincer, I., Rosen, M.A. (1999). Exergy: Energy, environment and sustainable development. Newnes. https://doi.org/10.1016/S0306-2619(99)00111-7
[2] Larminie, J., Dicks, A. (2003). Fuel Cell Systems Explained. John Wiley & Sons.
[3] Chang, W.T., Chao, Y.H., Li, C.W., Lin, K.L., Wang, J.J., Kumar, S.R., Lue, S.J. (2019). Graphene oxide synthesis using microwave-assisted vs. modified Hummer's methods: Efficient fillers for improved ionic conductivity and suppressed methanol permeability in alkaline methanol fuel cell electrolytes. Journal of Power Sources, 414: 86-95. https://doi.org/10.1016/j.jpowsour.2018.12.020
[4] Lim, Y., Lee, H., Hong, S., Kim, Y.B. (2019). Co-sputtered nanocomposite nickel cermet anode for high-performance low-temperature solid oxide fuel cells. Journal of Power Sources, 412: 160-169. https://doi.org/10.1016/j.jpowsour.2018.11.025
[5] Fuel Cells Technologies Program. https://web.archive.org/web/20100609041046/http://www1.eere.energy.gov/hydrogenandfuelcells/fuelcells/fc_types.html, accessed on 10 Aug 2004.
[6] Wang, S., Jiang, S.P. (2017). Prospects of fuel cell technologies. National Science Review, 4(2): 163-166.
[7] Stambouli, A.B., Traversa, E. (2002). Solid oxide fuel cells (SOFCs): A review of an environmentally clean and efficient source of energy. Renewable and Sustainable Energy Reviews, 6(5): 433-455. https://doi.org/10.1016/S1364-0321(02)00014-X
[8] Giorgi, L., Leccese, F. (2013). Fuel cells: Technologies and applications. The Open Fuel Cells Journal, 6(1): 1-20. https://doi.org/10.2174/1875932720130719001
[9] Vaghari, H., Jafarizadeh-Malmiri, H., Berenjian, A., Anarjan, N. (2013). Recent advances in application of chitosan in fuel cells. Sustainable Chemical Processes, 1(1): 1-12. https://doi.org/10.1186/2043-7129-1-16
[10] Sazali, N., Wan Salleh, W.N., Jamaludin, A.S., Mhd Razali, M.N. (2020). New perspectives on fuel cell technology: A brief review. Membranes, 10(5): 99. https://doi.org/10.3390/membranes10050099
[11] Yang, P., Zhang, H., Hu, Z. (2016). Parametric study of a hybrid system integrating a phosphoric acid fuel cell with an absorption refrigerator for cooling purposes. International Journal of Hydrogen Energy, 41(5): 3579-3590. https://doi.org/10.1016/j.ijhydene.2015.10.149
[12] Saikia, K., Kakati, B.K., Boro, B., Verma, A. (2018). Current advances and applications of fuel cell technologies. In: Sarangi, P. K., Nanda, S., Mohanty, P. (Eds.), Recent Advancements in Biofuels and Bioenergy Utilization. Springer Singapore, pp. 303-337. https://doi.org/10.1007/978-981-13-1307-3_13
[13] Maharudrayya, S., Jayanti, S., Deshpande, A. (2006). Pressure drop and flow distribution in multiple parallel-channel configurations used in proton-exchange membrane fuel cell stacks. Journal of Power Sources, 157(1): 358-367. https://doi.org/10.1016/j.jpowsour.2005.07.064
[14] Kumar, R., Singh, L., Zularisam, A., Hai, F.I. (2018). Microbial fuel cell is emerging as a versatile technology: A review on its possible applications, challenges, and strategies to improve the performances. International Journal of Energy Research, 42(2): 369-394. https://doi.org/10.1002/er.3780
[15] Chan, C.C. (2007). The state of the art of electric, hybrid, and fuel cell vehicles. Proceedings of the IEEE, 95(4): 704-718. https://doi.org/10.1109/JPROC.2007.892489
[16] Isanaka, Praneeth, S., Das, A., Liou, F. (2012). Design of metallic bipolar plates for PEM fuel cells. Missouri University of Science and Technology. Center for Transportation.
[17] Dehsara, M., Kimiaghalam, F., Ghorbani, B., Amidpour, M. (2013). Experimental study on the effect of bipolar plates substance on the performance of proton exchange membrane fuel cells. Iranian Fuel Cell Seminar. March 12-13. Tehran, Iran.
[18] Wang, J. (2011). Flow distribution and pressure drop in different layout configurations with z-type arrangement. Energy Science and Technology, 2(2): 1-12. https://doi.org/10.3968/j.est.1923847920110202.122
[19] Edupuganti, V., Daglen, B. (2012). An investigation of the impact of the proton exchange membrane fuel cell flow field plate geometry and design using computational fluid dynamic modeling and simulation. Journal of Power Sources, (189): 1083-1092.
[20] Pal, V., Karthikeyan, P., Anand, R. (2015). Performance enhancement of the proton exchange membrane fuel cell using pin type flow channel with porous inserts. Journal of Power and Energy Engineering, 3(5): 1-10. https://doi.org/10.4236/jpee.2015.35001
[21] Her, B.S., Hsieh, S.S., Chen, J.H. (2009). Channel-to-rib width ratio effects of flowfield plates in the performance of a micro-PEM fuel cell stack. NSTI, 3: 103-106.
[22] Ahmed, D.H., Sung, H.J. (2006). Effects of channel geometrical configuration and shoulder width on PEMFC performance at high current density. Journal of Power Sources, 162(1): 327-339. https://doi.org/10.1016/j.jpowsour.2006.06.083
[23] Ramesh, P., Duttagupa, S. (2013). Effect of channel dimensions on Micro PEM fuel cell performance using 3D modeling. International Journal of Renewable Energy Research, 3(2): 353-358.
[24] Shen, J., Tu, Z. (2022). Flow channel design in a proton exchange membrane fuel cell: From 2D to 3D. International Journal of Hydrogen Energy, 47(5): 3087-3098. https://doi.org/10.1016/j.ijhydene.2021.10.252
[25] Sugii, Y., Okamoto, K. (2006). Velocity measurement of gas flow using Micro PIV technique in polymer electrolyte fuel cell. International Conference on Nanochannels, Microchannels, and Minichannels, pp. 533-538. https://doi.org/10.1115/ICNMM2006-96216
[26] Almaliki, M.A., Jahanian, O., Abdul-Ghafoor, Q.J. (2023). Enhancement and design of the proton exchange membrane of hydrogen fuel cell. In 2023 16th International Conference on Developments in eSystems Engineering (DeSE), pp. 462-467. https://doi.org/10.1109/DeSE60595.2023.10469104
[27] Dhahad, H.A., Alfayydh, E.M., Fahim, K.H. (2018). Effect of flow field design and channel/header ratio on velocity distribution: An experimental approach. Thermal Science and Engineering Progress, 8: 118-129. https://doi.org/10.1016/j.tsep.2018.08.013
[28] Dhahad, H.A., Alawee, W.H., Hassan, A.K. (2019). Experimental study of the effect of flow field design to PEM fuel cells performance. Renewable Energy Focus, 30: 71-77. https://doi.org/10.1016/j.ref.2019.05.002