Ala Keblawi![]() | Nur Sabahiah Binti Abdul Sukor*
| Nur Sabahiah Binti Abdul Sukor*![]() | Khaled Al-Sahili
| Khaled Al-Sahili![]() | Ahmad Farhan Bin Mohd Sadullah
| Ahmad Farhan Bin Mohd Sadullah![]() | Samer Abdulhussein
| Samer Abdulhussein![]() | Aseel Al-Qudsi
| Aseel Al-Qudsi![]()
© 2025 The authors. This article is published by IIETA and is licensed under the CC BY 4.0 license (http://creativecommons.org/licenses/by/4.0/).
OPEN ACCESS
Public transportation (PT) plays a vital role in promoting sustainable mobility, particularly in congested urban areas. Effective PT planning requires attention to country-specific objectives and challenges. Evaluating bus services is essential for ensuring that transit systems meet mobility demands while reducing congestion and pollution. However, no globally recognized evaluation indicators currently exist for assessing PT services and stations in developing countries. To address this gap, a systematic literature review was conducted to establish a weighted assessment checklist tailored to the context of developing nations. The study employed expert judgment from 15 professionals and applied the Analytic Hierarchy Process (AHP) to identify best practices. Key indicators for evaluating bus stations included infrastructure, operations, and facilities, while the level of service (LOS) and sustainability emerged as the most critical indicators for bus service evaluation. Among the highest-weighted factors were reliability, safety and security, connectivity and integration, and operational efficiency, underscoring their importance in delivering effective and sustainable PT solutions. This research contributes to the body of knowledge by proposing context-specific indicators that account for the unique challenges faced by low-income countries, such as limited resources, infrastructure constraints, and socio-economic conditions.
public transportation service indicators, Analytic Hierarchy Process (AHP), experts' judgment, developing countries
Developing countries have seen incredible population expansion over the past two decades [1]. The rise in population has increased the demand for urban transportation in megacities [2]. Although the importance of public transportation (PT) is increasing with the rapidly growing population of developing countries, the transport infrastructure is not adequately meeting the current transport demand [3]. A considerable percentage of people are constrained to use their private cars, rather than their preferred choice of public transit, and this has generated severe traffic congestion on the city's streets [4]. PT is an important component of sustainable urban transportation in developing and developed cities [5, 6]. High-occupancy public bus transport systems are a key component of a sustainable transportation system [7]. Furthermore, PT helps to minimize greenhouse gas emissions [8]. According to Sanz [9], the possible benefits of PT include reduced traffic congestion and pollution, increased social access, and increased economic efficiency and activity [10]. High-capacity public bus transportation services in several nations have been steadily decreasing due to poor service performance; this has negatively impacted the sustainability of transportation systems, particularly in developing nations [11]. Many cities and localities continue to struggle with providing efficient bus transportation [2]. Many developing country cities lack adequate bus services [12].
Cities in developing countries face acute pressures due to rising motorization, urbanization, and population expansion [13, 14]. By 2050, approximately 66% of the world's population is expected to reside in cities [13]. The rate of urban expansion is likely to accelerate in the future decades, creating a challenge to the delivery of urban passenger transportation services, which are expected to increase by 60-70% by 2050, at the same time, motorized transportation is anticipated to grow by 94% between 2015 and 2050 [15]. Therefore, many cities worldwide are now developing sustainable mobility strategies to reduce the use of private vehicles by enhancing PT [16]. The quality of service is assessed in order to improve availability and hence raise demand for PT services [17]. To provide a high-quality transportation system and increase its appeal to passengers, a corresponding evaluation index system for the comprehensive service quality of public transit must first be established [18]. PT system can be assessed using indicators, which are variables, units, or scales used to measure service performance [19]. Indicators serve a variety of functions, including describing, demonstrating, comparing, and quantifying observable occurrences, and they must be specific and measurable [20]. Several indicators have been employed to evaluate various types of transportation worldwide [21]. Measuring the service of PT is a complicated and challenging process; it is a dynamic, multidisciplinary system and a multi-characteristic issue that has numerous indicators [22, 23].
Developing countries are struggling to decide which indicators are required to assess the sustainability of PT [20]. Data is generally limited and expensive to obtain; there is a lack of understanding regarding the purpose of indicators and the responsibilities of various sectors [2]. To address these critical challenges, identifying appropriate and context-specific evaluation indicators is an important step toward improving PT systems in developing nations. By providing a clear framework for assessing service quality, these indicators can assist policymakers and planners in identifying performance gaps, allocating resources more effectively, and prioritizing improvements that have a direct influence on user happiness and system efficiency. Reliable indicators enable us to evaluate and improve characteristics such as dependability, safety, accessibility, and affordability, all of which have a significant impact on public trust and ridership. A targeted evaluation system is expected to contribute to reducing traffic congestion, improving service delivery, and promoting public transit use, resulting in more sustainable and inclusive urban mobility.
There are several types of technologies available worldwide, as well as technological tools for evaluating the public transport sector and its services [10]. However, there are not enough studies about approved measurement indicators in developing countries [2]. Furthermore, different methodologies are commonly used to analyze urban transportation infrastructure; for example, examining the main PT factors, such as comfort, timeliness, pricing, and directness, and identifying the most convenient distance for public transit. Therefore, this research aims to identify relevant indicators to evaluate the services provided by PT in developing countries. Two sub-research questions direct the study: (1) What are the commonly used criteria and indicators in the literature for evaluating the PT sector and its services? (2) What are the most important indicators appropriate for implementation in developing countries as a special case?
Assessing transportation quality of service is the first step in boosting customer satisfaction in any system [1]. Much research focuses on customer satisfaction in PT, understanding how to favorably influence public transit customers' behavioral intentions for the future, and hence influence consumers' loyalty [1, 2]. This study combined the results of a comprehensive analysis of the articles reviewed from 2019 to 2024 using a Rose Flow chart to identify research discussing sustainable PT indicators. The purpose of the review is to investigate context-specific indicators for developing countries.
2.1 Types of criteria and indicators
A variety of indicators have been proposed and developed to examine sustainable urban mobility scenarios [24]. The most significant factors are travelling time navigation, coverage, access to navigation services, price, ease and pleasure, multimedia communication, and integration [25]. While Lai et al. [26] proposed a method for evaluating public transit service quality based on passenger energy cost, Hu et al. [18] developed an evaluation index system about the overall passenger experience and the quality of service provided by public transit enterprises to enhance the overall operational efficiency and service quality of urban public transit. In addition, Tiwari and Phillip [16] presented two considerations, quantitative variables (coverage, accessibility, affordability, etc.) and qualitative variables (public finance, integration, comfort and pleasure, etc.) [25, 27].
Previous research indicates that reliability, availability, accessibility, affordability, safety, and comfort are significant factors in determining an effective transportation system and satisfaction [2, 19, 28]. Reliability depends mostly on schedule adherence [29, 30]. Improvements in reliability can raise passenger satisfaction and attract new passengers [31]. Satisfaction occurs when services meet or surpass expectations [32]. Rider satisfaction is a standard metric for evaluating service quality [33]. Studies indicate that enhancing the service quality of PT contributes to commuter happiness over time [34]. On the other hand, the term "safety" is commonly defined as the degree to which services provided match users' standards [35]; safety has an immediate impact on the sustainability of PT and the choice of travel mode [32]. According to the expectation model developed by Atombo and Wemegah [32], price, availability, security, and reliability were the most important aspects of service quality associated with passengers' expected satisfaction.
Accessibility is another important aspect of PT services, passengers' pleasure is influenced by the ease of access to public bus transportation at the origin and destination [19, 36]. A public bus system's service performance is judged by the perceptions and expectations of its users [32]. Besides, commuter satisfaction with PT is linked to affordability, which refers to a person or household's ability to travel when necessary [34]. Moreover, availability refers to transportation options within a reasonable distance between the origin and destination [37]. The criteria of availability include path and coverage, as well as the number of facilities at bus stations [38]. Research indicates that commuters are more satisfied when PT is available [32]. As same as comfort of the buses helps to entice and keep ridership [39].
As important indicators that can't be ignored, Sustainable Development Goals (SDGs) and particularly SDG target 11.2, which explicitly refers to urban transportation [40]. It requires governments to have a PT system with at least two elements of accessibility: physical and economic [16]. This means ensuring barrier-free physical access to the public transport (PT) system while maintaining reasonable user fees [41]. One of the most important things to focus on is improving accessibility in order to expand access to PT [31]. An efficient and dependable transportation infrastructure is required to establish circumstances for the development and territorial expansion of the city [42].
2.2 Analysis and evaluation methodologies
There are many methods used to evaluate the indicators of transportation service. For example, Gunawan and Sam [43] used the SERVQUAL technique to analyze the core public bus transport users' quality of service, bus service dependability, and responsiveness, while Gaschi-Uciecha [31] used SERVQUAL method to assess reliability. Furthermore, the Customer Satisfaction Index (CSI) approach was employed to evaluate service quality, including reliability [33, 44]. Additionally, Stojic et al. [34] used correlation analysis, factor analysis, and regression analysis to analyze the factors influencing satisfaction with travelers based on the younger user group.
Stojic et al. [34] developed a user comfort assessment model for PT that utilizes the benefits of the Analytic Hierarchy Process (AHP), entropy weight technique, and fuzzy comprehensive evaluation approach. while Shiddiqi et al. [20] combined AHP with the best-worst method for evaluating the quality of public transit services. Moreover, Hu [3] developed a traveller satisfaction index system based on AHP and a fuzzy comprehensive evaluation approach. Similarly, Moslem et al. [45] presented an integrated grey Analytic Hierarchy Process and grey Multi-Objective Optimization Method using Ratio Analysis technique to assess the quality of PT services.
Another method was used, which is multi-criteria analysis. Rajsman and Škorput [46] introduced a multi-criteria model to evaluate the quality of transportation services by assessing satisfaction among travellers using a disaggregated approach and linear programming modelling. Ušpalytė-Vitkūnienė et al. [47] conducted a multi-criteria analysis with 14 experts to evaluate the significance (weight) of each criterion of PT services. While Kalifa et al. [25] developed a multi-criteria decision analysis for prioritization of public transport system.
Several other methods were used. The Structural Equation Model (SEM) and SPSS were used by Atombo and Wemegah [32] to check reliability, and a spider chart or radar map of indicators was used to check the efficiency of PT [23]. Additionally, the Random Sampling Method was used in choosing commuters [32]. Experts' Judgments were used by Shiddiqi et al. [20] to get indicators for sustainable PT. Finally, Cyril et al. [17]; Zope et al. [48] used benchmarks to determine the LOS of PT.
2.3 Results and gap
According to the previous research findings, the majority of existing research content focused on evaluating PT service or passenger satisfaction separately, rather than combining the two for a more holistic review. Previous research has not examined the relationship between satisfaction and usage, which is critical to enhancing the bus system's sustainability. Furthermore, several methods are employed; the majority of evaluation methods in the preceding studies utilised the analytical hierarchy process and multi-criteria method, which rely on the evaluation of users or experts. Therefore, the sample must be reliable. This means that each assessment is specific to a case study and cannot be generalized; therefore, it confirms the goal of research in finding special evaluation indicators for developing countries.
The geographical distribution and sequence of studies vary; the selected publications cover distinct samples from various countries worldwide, spanning Europe, Asia, and the Americas. The scope of case studies varied as well, with the majority being national, followed by regional, and metropolitan. Furthermore, the vast majority of publications focused on developed countries, with some on transitional countries. Although some research focused on underdeveloped countries, they also considered global indicators. Moreover, some researchers have used one, two, or all three types of sustainability aspects in their research, the majority focused on social aspects, followed by economic and environmental aspects.
As a result, this paper introduces an evaluation checklist for the PT system, focusing on the quality of service and stations. Combinatorial weighing employs the analytical hierarchy process AHP based on the selection principle of assessment indicators. This study builds an evaluation index system to understand how passengers in developing countries perceive and expect service quality characteristics that impact their satisfaction and use of bus services.
3.1 Data collection methodology
In this research, the selected indicators will be merged from two resources, which are directly related to the research objective, as presented in Figure 1. These can be seen in the following:
Table 1. Number and type of indicators used in the systematic literature review
|
Types of Reviewed Papers |
Types of Indicators |
||
|
Methodology |
No. of References |
Item |
No. of Indicators |
|
Qualitative |
1 |
Bus Station |
21 |
|
Quantitative |
11 |
Bus Service |
46 |
|
Mixed Method |
25 |
City Profile |
19 |
|
Total |
37 |
Total |
86 |
Figure 1. Research methodology
Figure 2. Methodological approach for selecting papers-roses flow diagram
Table 2. Number and type of indicators used in the master thesis [4]
|
Types of Indicators |
Types of LOS Indicators |
|||
|
Item |
No. of Indicators |
No. of Sub-Indicators |
Item |
No. of Indicators |
|
Bus terminl |
5 |
22 |
Coverage |
6 |
|
Route segment |
6 |
2 |
Reliability |
6 |
|
Level of service (LOS) |
3 |
17 |
Performance |
5 |
|
Total |
14 |
41 |
Total |
17 |
3.2 Indicators improvement process
After receiving a comprehensive overall review of the resulting indicators, the indicators were further refined. A total of 141 indicators were gathered from previous studies. The grouping step was done by:
3.2.1 Results of indicators found in the literature
Following the preceding method, three types of indicators were identified and classified into sections:
The city's profile, presented in Table 3, is essential for assessing bus services, as it provides a comprehensive understanding of the specific requirements and characteristics of the metropolitan area [20]. Population density, for example, is important because densely populated cities necessitate more regular and widespread bus service to efficiently convey huge numbers of people [10]. The geographical layout of the city, including the distribution of residential, commercial, and industrial zones, aids in the construction of efficient bus routes that connect vital locations while reducing travel time [32, 44].
Economic considerations in the city, such as average income levels and employment rates, are significant since they affect the affordability and necessity of public transit for inhabitants [6]. The quality of infrastructure, particularly road conditions and bus stop conditions, has a direct impact on the reliability and efficiency of bus service [49]. Environmental factors, such as air quality and the availability of green spaces, are also important [38, 50]. Efficient bus services can help to minimize pollution and promote sustainability by reducing the number of private vehicles on the roads [51]. Understanding the city's profile allows planners to design bus services to match the population's individual needs, assure economic viability, and promote environmental goals, resulting in a more effective and sustainable PT system [31].
As shown in Table 4, two criteria of infrastructure and facilities were fixed; 6 indicators and 31 sub-indicators were used.
As shown in Table 5, two criteria of LOS and sustainability were fixed; 7 indicators and 37 sub-indicators were used.
Table 3. Evaluation indicators found in the literature for city profile
|
Indicators |
References |
|
Environmental Indicators (air quality, green space availability) Economic Factors (average income levels, employment rates) Infrastructure (road conditions, bus stop facilities, number of vehicles, length of main roads, annual fleet vehicle increase, road accidents rate (per 100,000 population), annual road accidents increase, casualty accidents increase, cars (per 100 household), motorcycle (per 100 household), public buses (total number), bicycles (per 100 household), sidewalks, regular monitoring and evaluation for pt systems (y/n)) Demographic Factors (population density, age distribution) |
[4, 14, 15, 20, 25, 39, 47, 48, 52-55] |
Table 4. Bus station evaluation indicators
|
Criteria |
Indicator |
Sub-Indicators |
References |
|
Infrastructure (7 Indicators, 32 Sub-Indicators) |
(2 Sub-Indicators) |
|
[15, 31, 37, 39] |
|
|
[4, 13, 53, 56] |
|
(4 Sub-Indicators) |
|
[4, 10, 27, 31, 53] |
|
(8 Sub-Indicators) |
|
[4, 15, 18, 39, 53] |
|
|
Operation |
(7 Sub-Indicators) |
|
[4, 20, 30] |
(3 Sub-Indicators) |
|
[4, 23, 44] |
|
(2 Sub-Indicators) |
|
|
|
|
Facilities (4 Indicators, 18 Sub-Indicators) |
(3 Sub-Indicators) |
|
[4, 24] |
(4 Sub-Indicators) |
|
[13, 25, 47] |
|
(9 Sub-Indicators) |
|
[4, 17, 54, 57] |
|
(2 Sub-Indicators) |
|
[4, 22, 49] |
Table 5. Bus service evaluation indicators
|
Criteria |
Indicator |
Sub-Indicators |
References |
|
LOS (7 Indicators, 34 Sub-Indicators) |
(5 Sub-Indicators) |
|
[4, 18, 31, 37, 39, 50] |
(8 Sub-Indicators) |
|
[4, 22, 31, 49, 55] |
|
(3 Sub-Indicators) |
|
[17, 19, 47] |
|
(5 Sub-Indicators) |
|
[13, 47, 48, 54] |
|
(7 Sub-Indicators) |
|
[10, 14, 22, 23] |
|
(3 Sub-Indicators) |
|
[6, 9, 23, 44, 52] |
|
(3 Sub-Indicators) |
|
[9, 13, 25, 31] |
|
|
Sustainability indicators (4 Indicators, 11 Sub-Indicators) |
(2 Sub-Indicators) |
|
[27, 30, 51] |
(4 Sub-Indicators) |
|
[49, 58] |
|
(2 Sub-Indicators) |
|
[18, 23, 27] |
|
(3 Sub-Indicators) |
|
[38, 47] |
3.3 Methodology to weigh indicators for developing countries
The following methodology, which is summarized in Figure 1, was developed to find a scientific approach to rank evaluation indicators of PT systems in developing countries. The main steps are:
3.3.1 Analytic Hierarchy Process (AHP)
AHP is a human being's innate choice mechanism when confronted with a decision-making challenge [61]. AHP, based on expert evaluations, identifies the collection of criteria that will affect the complicated and multi-purpose judgments made in real life, as well as the relative relevance of these factors [64].
The process of AHP analysis contains [63, 65, 66]:
3.3.2 Hierarchy structure
Table 6. Linguistic scale and the corresponding numeric value
|
Scale for Comparison [66] |
|||
|
Definition |
AHP Scale |
Definition |
AHP Scale |
|
Equal importance |
1 |
Intermediate values |
2 |
|
Somewhat more important |
3 |
4 |
|
|
Much more important |
5 |
6 |
|
|
Very much more important |
7 |
8 |
|
|
Absolutely more important |
9 |
||
3.3.3 Establishing the comparative relevance of criteria
The expert's feedback is collected to determine the relative value of each decision-making criterion. The critical score contributions from each expert are gathered via an interview or an online questionnaire. The pairwise comparison approach, a suitable method for comparing elements, is employed in this study to evaluate each aspect and criterion. The classical AHP has a 1-9 scale for paired comparisons, as shown in Table 6. This scale converts evaluators' language preferences to numerical scales.
3.3.4 Development of the evaluation matrix and building a decision hierarchy
A decision hierarchy must be established for each multi-criteria decision-making situation. This hierarchy prioritizes factors based on decision-making goals. Complex situations often require a multi-level hierarchy with sub-objectives and sub-criteria. Stakeholders evaluate each criterion in the evaluation matrix. The assessment matrix includes stakeholders, objectives, and criteria; each with a value ranging from 0 to 1 (normalized weight matrix). Eq. (1) defines a pairwise comparison.
$a_{i j}=\frac{W_i}{W_j}$, where $\mathrm{i}, \mathrm{j}=1,2,3 \ldots \ldots \mathrm{n}$ (1)
where, n = number of criteria compared, wi = weights for criterion i, and aij = weight ratio of criteria i and j. The matrix in Eq. (2) displays the weight (w) ratio between n objects, including alternatives, objectives, criteria, and sub-criteria [3].
$\mathrm{A}=\left|\begin{array}{llll}w_1 / w_1 & w_1 / w_2 & \ldots . & w_1 / w_n \\ w_2 / w_1 & w_2 / w_2 & \ldots . & w_2 / w_n \\ w_n / w_1 & w_2 / w_n & \ldots . & w_n / w_n\end{array}\right|$ (2)
A normalized matrix is carried out by applying Eq. (3), in which each column (i) and row (j) in the matrix is divided by the largest value in column (i).
$a_{i j}=\frac{a_{i j}}{{Max}~a_{i j}}, \forall \mathrm{i}, \mathrm{j}$ (3)
The evaluation matrix A must have rank 1 for all consistent pairwise comparison conditions, and the biggest eigenvector (λmax) must equal the number of criteria (h). Every subsystem in the hierarchy follows the aforementioned approach. Priority vectors must be weighted based on global priority, starting at the top of the hierarchy. The options are ranked based on their contribution to the problem statement as perceived by stakeholders [64].
3.3.5 Checking consistency
A consistency check is carried out to achieve a faultless decision. The consistency check is carried out once the eigenvalue and maximum eigenvalue have been calculated. When PCMs are consistent, the primary eigenvalue (λmax) is used to determine the priority matrix. For matrix entries, A: aij. ajk = aik defines consistency. Eq. (4) reveals the Consistency Index (CI).
$C I=\frac{\lambda_{\max }-n}{n-1}$ (4)
Fifteen experts, selected using purposive sampling from different regions and specialists, assessed the indicators. Table 7 presents the profile of the experts.
Table 7. Experts' profile
|
Specialty |
No. |
Job Position |
No. |
|
Road and Transportation Engineering |
8 |
Government |
4 |
|
Urban and Transportation Planning |
2 |
Academic |
8 |
|
Transportation Management |
1 |
Private Sector and NGOs |
3 |
|
Traffic Safety |
1 |
Experience Years |
No. |
|
Applied Mechanics-Civil Engineering |
1 |
Less than 10 |
1
|
|
Sustainable Development |
1 |
10-20 |
5 |
|
Travel Behaviour |
1 |
More than 20 |
9 |
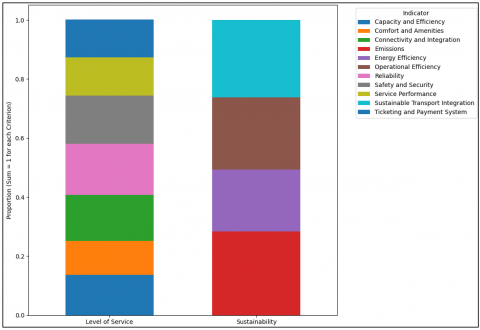
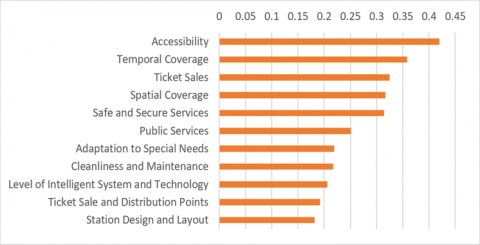
The results of the evaluations by 15 experts for weighing the indicators are presented in Tables 8 and 9. The final score for each indicator was calculated by averaging the responses and was weighted according to the determined weight scores of each criterion. Figures 3 and 4 illustrate the variables, their weights, and their order due to their importance.
Through AHP analysis, the inconsistency was calculated to first determine the highest eigenvalue of the matrix λmax. The consistency ratio (CR) should be < 0.1 for the matrices to be accepted. In this study, most experts’ judgments had a CR below 0.01 (average CR of 0.0045), and the average CI was 0.009, which is acceptable.
As shown in Tables 8 and 9, the weights of the bus station evaluation criteria were close. Infrastructure received the highest rating, which was related to the accessibility, followed by the level of intelligent system and technology, while in operation, the results were close to temporal coverage and ticket sales. In facilities, the most important elements were safe and secure services. Furthermore, related to the bus station service, the LOS had a significant impact on reliability, connectivity, integration, and capacity and efficiency, while emissions and sustainable transport integration had significant weights in sustainability. Figures 3 and 4 present the rank of indicators.
Table 8. Bus station evaluation indicators and the related weights extracted from the experts' choice
|
Rank |
Criteria |
Indicator |
Weight (W) |
Rank |
Inconsistency |
|
1 |
Infrastructure W=0.350 |
Ticket Sales and Distribution Points |
0.192 |
3 |
0.00066 |
|
Level of Intelligent System and Technology |
0.206 |
2 |
|||
|
Accessibility |
0.420 |
1 |
|||
|
Station Design and Layout |
0.182 |
4 |
|||
|
2 |
Operation W=0.333 |
Spatial Coverage |
0.317 |
3 |
0.00909 |
|
Temporal Coverage |
0.358 |
1 |
|||
|
Ticket Sales |
0.325 |
2 |
|||
|
3 |
Facilities W=0.317 |
Adaptation to Special Needs |
0.219 |
3 |
0.01 |
|
Safe and Secure Services |
0.314 |
1 |
|||
|
Public Services |
0.251 |
2 |
|||
|
Cleanliness and Maintenance |
0.217 |
4 |
|||
|
Inconsistency=0.00909 |
|||||
Table 9. Bus station service evaluation indicators and the related weights extracted from the experts' choice
|
Rank |
Criteria |
Indicator |
Weight (W) |
Rank |
Inconsistency |
|
1 |
Level of service (LoS) W=0.537 |
Comfort and Amenities |
0.116 |
6 |
0.02 |
|
Reliability |
0.174 |
1 |
|||
|
Connectivity and Integration |
0.155 |
2 |
|||
|
Capacity and Efficiency |
0.136 |
3 |
|||
|
Service Performance |
0.130 |
4 |
|||
|
Ticketing and Payment System |
0.127 |
5 |
|||
|
Safety and Security |
0.163 |
5 |
|||
|
2 |
Sustainability W=0.463 |
Energy Efficiency |
0.211 |
4 |
0.00608 |
|
Emissions |
0.283 |
1 |
|||
|
Operational Efficiency |
0.244 |
3 |
|||
|
Sustainable Transport Integration |
0.262 |
2 |
|||
|
Inconsistency=0.00001 |
|||||
Figure 3. Bus station evaluation indicators and weights
Figure 4. Bus station service evaluation indicators and weights
In this research, indicators pertaining to evaluating the service and stations of PT systems within the context of developing nations were evaluated by specialists, who assigned rankings according to their projected importance through the application of AHP methodology. In light of the lack of prior research concerning the sustainability of PT in developing countries, this investigation holds the potential to facilitate more comprehensive subsequent inquiries into the subject matter.
5.1 Bus station evaluation indicators
When evaluating public transit services, it is essential to emphasize specific benchmarks to guarantee both sustainability and operational efficacy. Within these benchmarks, infrastructure, operational management, and amenities emerge as critical components that significantly influence the overall efficacy and sustainability of the transportation framework. Infrastructure as a criterion got the maximum rank, then operation, and finally facilities. The infrastructure constitutes the fundamental framework of any PT system. Since infrastructure establishes the underpinning upon which the entire system operates, its caliber and expansiveness are of utmost importance. A resilient infrastructure guarantees accessibility, level of intelligent system and technology, ticket sale and distribution points, and station design and layout (sequentially according to their resulting importance in the evaluation), directly affecting the system's ability to meet present and future demands. This criterion received the highest evaluation since, in the absence of a meticulously planned and well-maintained infrastructure, other facets of the system cannot operate at peak efficiency, resulting in inefficiencies and a deficiency in sustainability.
The operation encompasses the quotidian administration and functionality of the transportation network. It entails temporal coverage, ticket sale, and spatial coverage (sequentially in importance). While infrastructure serves as the underpinning, proficient operations sustain the system's efficacy, ensuring that it fulfills users' requirements in a dependable and prompt manner. Nevertheless, operation is subordinate to infrastructure in the hierarchy of significance, as even the most exemplary operational methodologies are incapable of offsetting deficiencies in infrastructure. Facilities denote the amenities afforded to passengers, safe and secure service, public services, adaptation to special needs, and finally cleanliness and maintenance. These components significantly enhance the user's experience, rendering PT more comfortable and convenient. Although facilities play a crucial role in attracting and retaining users, they are perceived as less pivotal than infrastructure and operations in the context of sustainability. Facilities contribute value; however, their efficacy is ultimately contingent upon the quality and reliability of the underlying infrastructure and operations.
Figure 5. Bus station evaluation indicators
Figure 5 presents the indicators and their orders in the three criteria. Given the need for evaluation indicators suited to the conditions of developing countries, the key priorities for assessing bus station services are represented by the indicators shown in the figures, which have been weighted based on expert judgment. The highest-weighted indicators—such as accessibility, safety and security, temporal and spatial coverage, and accommodation of special needs—highlight their critical importance in evaluating bus station services. These metrics are even more crucial in the context of a developing country, a nation facing specific challenges such as limited mobility due to military checkpoints, complex topography, and inadequate infrastructure investment. Reaching rural and underprivileged groups requires accessibility and spatial coverage, while political unrest raises serious safety concerns. Additionally, it is imperative that transportation services be modified to accommodate the requirements of individuals with disabilities, many of whom are impacted by conflict. To make the most use of limited resources, operational effectiveness and service integration must be prioritized. As a result, the targeted indicators support equitable and sustainable transportation development by closely matching the unique circumstances in Palestine and other developing countries.
5.2 Bus station service evaluation indicators
Two criteria were used for evaluation; the most important one, in the experts' opinions, was the LOS, followed by sustainability. The LOS considerably influences sustainability by shaping users' behaviours. A reliable, safe, and efficient service may lead to a shift from personal vehicle reliance to using PT, consequently helping to cut down on emissions and relieve congestion. Nonetheless, the impact on sustainability is predominantly driven by user engagement, contingent upon the extent to which the system addresses the requirements of its passengers.
Sustainability criteria specifically address the transportation system's environmental and long-range operational dimensions. Curtailing emissions, advancing integration, and refining operational efficiency exert a straightforward and measurable influence on the system's sustainability. These benchmarks ensure that the transit network is effective in today's context while remaining feasible for future populations.
Related to the LOS, the concept of reliability is paramount in guaranteeing that PT systems fulfil their users' anticipations. A service that is both consistent and punctual cultivates a sense of trust amongst patrons, thereby incentivizing them to prefer public transit over personal vehicles. Safety constitutes an indispensable facet of PT. It encompasses the physical security of passengers, operators, and pedestrians and the integrity of the transit environment. Optimal connectivity guarantees that passengers can conveniently access their intended destinations, enhancing the system's user-friendliness and effectiveness. PT efficiency is defined by route enhancements, reduced travel times, and the best possible use of resources. A highly efficient system can accommodate a more efficient number of passengers with a diminished allocation of resources, ultimately resulting in cost reductions and an enhancement in the quality of service provided.
The mitigation of emissions constitutes a fundamental component of sustainability. PT networks that effectively lessen their ecological footprint facilitate the attainment of cleaner air, diminished greenhouse gas emissions, and enhanced public health outcomes. Integration pertains to the degree of cohesiveness among various transportation modalities (e.g., buses, trains, bicycles) in delivering a fluid travel experience. Robust integration bolsters sustainability by streamlining the process for passengers to utilize PT throughout their entire journey, thereby decreasing reliance on private vehicles. Operational efficiency within the paradigm of sustainability underscores the enhancement of energy utilization, the minimization of waste, and the judicious management of resources. An operation characterized by sustainable efficiency curtails expenditures and lessens the environmental impact associated with the transportation system.
Figure 6. Bus station service evaluation indicators
The weighted indicators for assessing bus station services are presented in Figure 6, highlighting the elements that experts consider most important in the context of developing nations. The indicators with the highest weights (reliability, safety and security, connectivity and integration, and operational efficiency) highlight the significance of these factors in guaranteeing efficient and sustainable PT. In developing countries, where service outages, fragmented networks, and political instability are ongoing concerns, these metrics are especially pertinent. While connectivity and operational efficiency are critical for overcoming regional fragmentation and limited resources, high reliability and safety are critical for establishing user trust in an environment of insecurity. The necessity of long-term, resource-conscious planning is further reflected in the focus on sustainable transportation, emissions, and energy efficiency. In developing areas, these weighted priorities provide a customized framework for enhancing transportation services under extraordinary restrictions.
5.3 Comparison between developed and developing countries
The indicators of sustainable PT in developed and developing nations exhibit considerable divergence in terms of infrastructure and policy implementation. Developed nations typically possess more sophisticated infrastructure and robust policy frameworks, whereas developing nations encounter distinct challenges that necessitate customized strategies. Developed countries usually have well-established infrastructure that supports sustainable PT. The infrastructure in developed countries often includes advanced technologies and systems that facilitate efficient and sustainable transport. In contrast, developing countries often struggle with inadequate infrastructure. Public buses, a common mode of transport, are frequently powered by non-renewable energy sources like diesel, contributing to environmental degradation [20]. The infrastructure in these regions may not support the integration of new technologies, which are essential for achieving sustainability.
Policies in developed countries are generally more comprehensive and are supported by robust governance frameworks [4]. In contrast, policy implementation in developing countries faces challenges such as institutional barriers and a lack of cross-sectoral coordination [20]. Developing countries need to adapt global sustainability indicators to their specific contexts to address these challenges effectively. Indicators in developed countries are often more refined and include technical aspects such as traffic flow and speed, which are supported by existing infrastructur [4]. Whereas, in developing countries, indicators such as safety, transport quality, and accessibility are more relevant due to the existing infrastructural and institutional challenges [20].
While developed countries benefit from advanced infrastructure and comprehensive policies, developing countries must navigate significant challenges in both areas. The focus in developing regions is often on adapting global indicators to local contexts and overcoming institutional barriers to implement sustainable PT effectively. Sustainability indicators are constant globally but vary according to the development of countries and their needs, and all standards must be aligned with existing challenges.
The gap in infrastructure and policy between developed and developing countries has a direct impact on the usefulness and efficacy of evaluation indicators. In developing nations, poor infrastructure often hinders the implementation of indicators related to technology integration or real-time data collection, making basic indicators such as accessibility, safety, and reliability even more crucial. Without robust systems in place, the emphasis switches to fundamental service quality improvements rather than advanced performance optimization.
For example, in places such as Palestine, Yemen, and Nepal, measures including spatial coverage, operational efficiency, and safety have identified critical areas for intervention. While efforts to increase dependability and connection continue, obstacles such as budget deficits, institutional fragmentation, and informal transportation operations impede implementation. Nonetheless, these markers are valuable tools to guide phased improvements and policy alignment.
For evaluating a bus station, all three criteria—infrastructure, operations, and facilities—are essential to achieving a sustainable public transport (PT) framework. However, infrastructure stands out as the most critical for long-term sustainability, as it shapes the lasting effectiveness and expansion potential of the network. Operations play a daily role in maintaining system function, while facilities enhance user satisfaction and encourage public transport use, though their impact is more supportive than foundational.
In evaluating PT service, both levels of service and sustainability are closely linked and equally important. High-quality service attracts users, while sustainability ensures resource efficiency and environmental responsibility. Key elements such as reliability, safety, connectivity, and emission reduction must be considered together. A thorough assessment of these factors supports the creation of a PT system that meets current needs and remains resilient for future demands.
As an overall conclusion, the weighted indicators highlight the fundamental criteria for assessing bus station services in developing nations. High ratings for efficiency, safety, accessibility, and dependability underscore the need for urgently inclusive, safe, and resource-conscious transportation systems. These metrics address issues such as limited mobility, disjointed infrastructure, and social vulnerability. When combined, they create a customized framework for the creation of sustainable and equitable PT in extraordinary circumstances.
This study is limited by its geographical emphasis and reliance on experts' assessment, which may not accurately reflect the diverse situations encountered in all developing nations. To increase impact, governments should prioritize infrastructure investment, cross-sector collaboration, and better data systems. The proposed indicators are a useful tool for leading improvements in accessibility, safety, and operational efficiency. Future studies should investigate flexible indicator frameworks and conduct comparative analyses across various modes of transportation and geographies to support broader application and long-term sustainability. Additionally, a comparative analysis of sustainability indicators across PT modes in developing countries is warranted.
[1] Al-Sahili, K., Hassouna, F.M. (2024). National transport connectivity assessment for landlocked area–Cross-border transport in Palestine. An-Najah University Journal for Research-A (Natural Sciences), 39(2): 1-14. https://doi.org/10.35552/anujr.a.39.2.2359
[2] Keblawi, A.Z.A., Al-Sahili, K. (2022). Performance level of the public transportation in the West Bank. RSF Conference Series: Engineering and Technology, 2(2): 232-246. https://doi.org/10.31098/cset.v2i2.577
[3] Enea Consulting. (2021). The case for impact investment in sustainable mobility in developing countries. https://www.enea-consulting.com/static/0ddddaea80241e76e91efdd0d5a469b3/enea_shellfoundation_impactcasesustainablemobility_web.pdf.
[4] Olaian, A.Z.A. (2017). Study of intercity public transportation services and coverage in the West Bank. Doctoral dissertation, Faculty of Graduate Studies, An-Najah National University, Palestine.
[5] Kusuma, C.E., Dewantoro, F. (2024). Study of operational and maintenance costs for public bus transport. Jurnal Teknik Industri: Jurnal Hasil Penelitian dan Karya Ilmiah dalam Bidang Teknik Industri, 10(1): 154-162. https://doi.org/10.24014/jti.v10i1.26552
[6] Ghafouri-Azar, M., Diamond, S., Bowes, J., Gholamalizadeh, E. (2023). The sustainable transport planning index: A tool for the sustainable implementation of public transportation. Sustainable Development, 31(4): 2656-2677. https://doi.org/10.1002/sd.2537
[7] Zacharof, N., Bitsanis, E., Broekaert, S., Fontaras, G. (2024). Reducing CO2 emissions of hybrid heavy-duty trucks and buses: Paving the transition to low-carbon transport. Energies, 17(2): 286. https://doi.org/10.3390/en17020286
[8] Shaaban, K., Siam, A. (2023). Factors affecting public transportation ridership in a high-income developing country. The Open Transportation Journal, 17(1). https://doi.org/10.2174/18744478-v17-e230109-2022-28
[9] Sanz, L.D.B. (2023). Sustainability index for public transport in Mexico City. Transportation Research Procedia, 71: 69-76. https://doi.org/10.1016/j.trpro.2023.11.059
[10] Al-Sahili, K., Qaisi, K. (2021). A methodology for measuring a local index of public transport accessibility. Proceedings of the Institution of Civil Engineers-Transport, 176(6): 337-348. https://doi.org/10.1680/jtran.20.00029
[11] Kolin, A.V., Rybakov, P.V., Evreenova, N.Y. (2024). Peculiarities of determining the capacity of land urban passenger transportation vehicles. The Russian Automobile and Highway Industry Journal, 21(3): 412-421. https://doi.org/10.26518/2071-7296-2024-21-3-412-421
[12] Hanif, N.A., Nurmandi, A. (2022). Sustainable transport development strategy in developed and developing countries. In Human Interaction & Emerging Technologies (IHIET 2022): Artificial Intelligence & Future Applications. AHFE Open Access, pp. 174-180. https://doi.org/10.54941/ahfe1002729
[13] Thondoo, M., Marquet, O., Marquez, S., Nieuwenhuijsen, M.J. (2020). Small cities, big needs: Urban transport planning in cities of developing countries. Journal of Transport & Health, 19: 100944. https://doi.org/10.1016/j.jth.2020.100944
[14] Sanchez-Atondo, A., Garcia, L., Calderon-Ramirez, J., Gutiérrez-Moreno, J.M., Mungaray-Moctezuma, A. (2020). Understanding public transport ridership in developing countries to promote sustainable urban mobility: A case study of Mexicali, Mexico. Sustainability, 12(8): 3266. https://doi.org/10.3390/su12083266
[15] Vargas-Maldonado, R.C., Lozoya-Reyes, J.G., Ramírez-Moreno, M.A., Lozoya-Santos, J.D.J., Ramírez-Mendoza, R.A., Pérez-Henríquez, B.L., Velasquez-Mendez, A., Vargas, J.F.J., Narezo-Balzaretti, J. (2022). Conscious mobility for urban spaces: Case studies review and indicator framework design. Applied Sciences, 13(1): 333. https://doi.org/10.3390/app13010333
[16] Tiwari, G., Phillip, C. (2021). Development of public transport systems in small cities: A roadmap for achieving sustainable development goal indicator 11.2. IATSS Research, 45(1): 31-38. https://doi.org/10.1016/j.iatssr.2021.02.002
[17] Cyril, A., Mulangi, R.H., George, V. (2019). Performance optimization of public transport using integrated AHP-GP methodology. Urban Rail Transit, 5(2): 133-144. https://doi.org/10.1007/s40864-019-0103-2
[18] Hu, X.H., Chen, X.H., Zhao, J.H., Yu, K., Long, B., Dai, G. (2022). Comprehensive service quality evaluation of public transit based on extension cloud model. Archives of Transport, 61(1): 103-115. https://doi.org/10.5604/01.3001.0015.8198
[19] Bartzokas-Tsiompras, A., Photis, Y.N. (2019). Measuring rapid transit accessibility and equity in migrant communities across 17 European cities. International Journal of Transport Development and Integration, 3(3): 245-258. https://doi.org/10.2495/TDI-V3-N3-245-258
[20] Shiddiqi, A.A.A., Sutjiningsih, D., Tjahjono, T., Darmajanti, L., Suprayoga, G.B. (2022). Evaluating sustainable transport indicators for metropolitan areas in developing countries: The case of Greater Jakarta. The Open Transportation Journal, 16(1). https://doi.org/10.2174/18744478-v16-e2206130
[21] Daimi, S., Rebai, S. (2022). Sustainability governance indicator-based framework for public transport companies in developing countries. Journal of Cleaner Production, 380: 134942. https://doi.org/10.1016/j.jclepro.2022.134942
[22] Jiang, W., Huan, Z. (2022). Sustainability measurement of transportation systems in China: A system-based Bayesian network approach. Mathematical Problems in Engineering, 2022(1): 4801336. https://doi.org/10.1155/2022/4801336
[23] Makarova, I., Shubenkova, K., Pashkevich, A. (2021). Efficiency assessment of measures to increase sustainability of the transport system. Transport, 36(2): 123-133. https://doi.org/10.3846/transport.2021.14996
[24] Hipogrosso, S., Nesmachnow, S. (2020). Analysis of sustainable public transportation and mobility recommendations for Montevideo and Parque Rodó neighborhood. Smart Cities, 3(2): 479-510. https://doi.org/10.3390/smartcities3020026
[25] Kalifa, M., Özdemir, A., Özkan, A., Banar, M. (2021). Application of multi-criteria decision analysis including sustainable indicators for prioritization of public transport system. Integrated Environmental Assessment and Management, 18(1): 25-38. https://doi.org/10.1002/ieam.4486
[26] Lai, X.F., Teng, J., Ling, L. (2020). Evaluating public transportation service in a transit hub based on passengers energy cost. In 2020 IEEE 23rd International Conference on Intelligent Transportation Systems (ITSC), Rhodes, Greece, pp. 1-7. https://doi.org/10.1109/ITSC45102.2020.9294662
[27] hammassi, E., Rehimi, F., Halawani, A.T., Kalboussi, A. (2024). Energy transition policy via electric vehicles adoption in the developing world: Tunisia as a case study. Energy Policy, 185: 113927. https://doi.org/10.1016/j.enpol.2023.113927
[28] Lee, S., Bencekri, M. (2021). Urban form and public transport design. In Urban Form and Accessibility. Elsevier, pp. 289-306. https://doi.org/10.1016/B978-0-12-819822-3.00018-3
[29] Hassannayebi, E., Hashemi, H., Basirati, M., Saidi, S., Ebrahimi, A. (2024). Data-driven multi-criteria assessment framework for analyzing the reliability of bus services. Transportation Research Record, 2678(4): 415-439. https://doi.org/10.1177/03611981231185140
[30] Dulce, F., Murillo-Hoyos, J., Caicedo, E. (2024). Comparative analysis of the performance, environmental impact, and costs of electric, combustion, and gas buses in an operating context of a mid-sized city of an emerging country. Transportation Research Interdisciplinary Perspectives, 25: 101113. https://doi.org/10.1016/j.trip.2024.101113
[31] Gaschi-Uciecha, A. (2023). The problem of reliability in public transport for the Metropolis GMZ area–Pilots studies. Sustainability, 15(4): 3199. https://doi.org/10.3390/su15043199
[32] Atombo, C., Wemegah, T.D. (2021). Indicators for commuter’s satisfaction and usage of high occupancy public bus transport service in Ghana. Transportation Research Interdisciplinary Perspectives, 11: 100458. https://doi.org/10.1016/j.trip.2021.100458
[33] Rahnama, S., Cortez, A., Monzon, A. (2024). Navigating passenger satisfaction: A structural equation modeling-artificial neural network approach to intercity bus services. Sustainability, 16(11): 4363. https://doi.org/10.3390/su16114363
[34] Stojic, D., Ciric, Z., Sedlak, O., Marcikic Horvat, A. (2020). Students’ views on public transport: Satisfaction and emission. Sustainability, 12(20): 8470. https://doi.org/10.3390/su12208470
[35] Ruiz-Padillo, A., de Oña, J. (2024). Analysis of the relationships among infrastructure, operation, safety, and environment aspects that influence public transport users: Case study of university small and medium sized cities in Brazil. Transportation Research Part A: Policy and Practice, 185: 104115. https://doi.org/10.1016/j.tra.2024.104115
[36] Awad-Núñez, S., Julio, R., Moya-Gómez, B., Gomez, J., González, J.S. (2021). Acceptability of sustainable mobility policies under a post-COVID-19 scenario. Evidence from Spain. Transport Policy, 106: 205-214. https://doi.org/10.1016/j.tranpol.2021.04.010
[37] Varabuntoonvit, V., Boonyarith, K., Pakornkarn, P., Pichetwanit, P., Sittipong, W. (2023). Sustainable efficiency indicator for urban transportation: Case study of public bus and rapid transit systems in Bangkok. Environmental Progress & Sustainable Energy, 42(4): e14154. https://doi.org/10.1002/ep.14154
[38] Hassouna, F.M., Assad, M. (2020). Towards a sustainable public transportation: replacing the conventional taxis by a hybrid taxi fleet in the West Bank, Palestine. International Journal of Environmental Research and Public Health, 17(23): 8940. https://doi.org/10.3390/ijerph17238940
[39] Gorzelanczyk, P., Madajczak, A. (2023). Analysis of the sustainable public transportation plans in Poland. Technical Sciences, 26: 141-160. https://doi.org/10.31648/ts.8944
[40] United Nations. (2015). Transforming our world: The 2030 agenda for sustainable development. https://sdgs.un.org/2030agenda.
[41] Liu, X., Yuan, M. (2023). Assessing progress towards achieving the transport dimension of the SDGs in China. Science of the Total Environment, 858: 159752. https://doi.org/10.1016/j.scitotenv.2022.159752
[42] United Nations Development Programme. (2002). Human development report. https://hdr.undp.org/content/human-development-report-2002.
[43] Gunawan, G., Sam, T.L. (2023). Exploring the association between mobility fluctuations and socioeconomic indicators using data mining techniques in Indonesia and Malaysia. DIU Journal of Business and Entrepreneurship, 16(1): 79-105. https://doi.org/10.36481/diujbe.v016i1.w8qv3970
[44] Hasan, U., Whyte, A., AlJassmi, H. (2024). A multi-criteria decision-making framework for sustainable road transport systems: Integrating stakeholder-cost-environment-energy for a highway case study in United Arab Emirates. Journal of Cleaner Production, 450: 141831. https://doi.org/10.1016/j.jclepro.2024.141831
[45] Moslem, S., Alkharabsheh, A., Ismael, K., Duleba, S. (2020). An integrated decision support model for evaluating public transport quality. Applied Sciences, 10(12): 4158. https://doi.org/10.3390/app10124158
[46] Rajsman, M., Škorput, P. (2022). Methodological approach for evaluation and improvement of quality transport service in public road passenger transport. Tehnički Vjesnik, 29(1): 139-148. https://doi.org/10.17559/TV-20201031104641
[47] Ušpalytė-Vitkūnienė, R., Šarkienė, E., Žilionienė, D. (2020). Multi-criteria analysis of indicators of the public transport infrastructure. Promet–Traffic & Transportation, Traffic in the Cities, 32(1): 119-126. https://doi.org/10.7307/ptt.v32i1.3175
[48] Zope, R., Vasudevan, N., Arkatkar, S., Joshi, G. (2022). Structural equation model for sustainable transport system performance enhancement. In Proceedings of the Fifth International Conference of Transportation Research Group of India. Springer, Singapore, pp. 121-133. https://doi.org/10.1007/978-981-16-9925-2_8
[49] Sevtuk, A., Amindarbari, R. (2021). Does metropolitan form affect transportation sustainability? Evidence from US metropolitan areas. Environment and Planning B: Urban Analytics and City Science, 48(8): 2385-2401. https://doi.org/10.1177/2399808320971310
[50] Yang, Y.H., Dong, R.X., Ren, X.Y., Fu, M.Z. (2024). Exploring sustainable planning strategies for carbon emission reduction in Beijing’s transportation sector: A multi-scenario carbon peak analysis using the extended STIRPAT model. Sustainability, 16(11): 4670. https://doi.org/10.3390/su16114670
[51] Fattah, M.A., Morshed, S.R. (2021). Assessing the sustainability of transportation system in a developing city through estimating CO2 emissions and bio-capacity for vehicular activities. Transportation Research Interdisciplinary Perspectives, 10: 100361. https://doi.org/10.1016/j.trip.2021.100361
[52] Bassi, A.M., Pallaske, G., Niño, N., Casier, L. (2022). Does sustainable transport deliver societal value? Exploring concepts, methods, and impacts with case studies. Future Transportation, 2(1): 115-134. https://doi.org/10.3390/futuretransp2010007
[53] Nagy, S., Csiszár, C. (2022). Assessment methods for comparing shared mobility and conventional transportation modes in Urban Areas. Periodica Polytechnica Social and Management Sciences, 30(2): 158-166. https://doi.org/10.3311/PPso.16605
[54] Al-Thani, S.K., Amato, A., Koç, M., Al-Ghamdi, S.G. (2019). Urban sustainability and livability: An analysis of Doha’s urban-form and possible mitigation strategies. Sustainability, 11(3): 786. https://doi.org/10.3390/su11030786
[55] Koskinen, K., Mallat, N., Upreti, B.R. (2024). Shared benefits and sustainable mobility–A case of autonomous bus. Case Studies on Transport Policy, 18: 101286. https://doi.org/10.1016/j.cstp.2024.101286
[56] Heidari, I., Toloie Eshlaghy, A., Hosseini, S.M.S. (2024). Effect of improving sustainable transportation indicators on quality of life in Tehran. Environmental Research, 263(Part 3): 120241. https://doi.org/10.1016/j.envres.2024.120241
[57] Patalas-Maliszewska, J., Łosyk, H. (2020). Analysis of the development and parameters of a public transport system which uses low-carbon energy: The evidence from Poland. Energies, 13(21): 5779. https://doi.org/10.3390/en13215779
[58] Almashhour, R., AlQahtani, M., Ndiaye, M. (2023). Highway transportation, health, and social equity: A Delphi-ANP approach to sustainable transport planning. Sustainability, 15(22): 16084. https://doi.org/10.3390/su152216084
[59] Öztürk, E.A. (2024). Sustainable urban transportation performance in Ankara: A comparative study. International Journal of Automotive Science and Technology, 8(1): 23-29. https://doi.org/10.30939/ijastech..1369878
[60] Seker, S., Aydin, N. (2020). Sustainable public transportation system evaluation: A novel two-stage hybrid method based on IVIF-AHP and CODAS. International Journal of Fuzzy Systems, 22(1): 257-272. https://doi.org/10.1007/s40815-019-00785-w
[61] Velasco, A., Gerike, R. (2024). A composite index for the evaluation of sustainability in Latin American public transport systems. Transportation Research Part A: Policy and Practice, 179: 103939. https://doi.org/10.1016/j.tra.2023.103939
[62] Al Qudsi, A.M. (2023). Developing energy and water efficiencies rating system for existing buildings in palestine using the analytical hierarchy process (AHP). Doctoral dissertation, Faculty of Graduate Studies, An-Najah National University, Palestine.
[63] Hamadneh, J., Duleba, S., Esztergár-Kiss, D. (2022). Stakeholder viewpoints analysis of the autonomous vehicle industry by using multi-actors multi-criteria analysis. Transport Policy, 126: 65-84. https://doi.org/10.1016/j.tranpol.2022.07.005
[64] Awasthi, A., Chauhan, S.S., Hurteau, X., Breuil, D. (2008). An analytical hierarchical process-based decision-making approach for selecting car-sharing stations in medium size agglomerations. International Journal of Information and Decision Sciences, 1(1): 66-97. https://doi.org/10.1504/IJIDS.2008.020049
[65] Saaty, T.L. (2014). Analytic heirarchy process. In Wiley StatsRef: Statistics Reference Online. Wiley. https://doi.org/10.1002/9781118445112.stat05310
[66] Al-lami, A., Torok, A. (2023). Sustainability indicators of surface public transportation. Sustainability, 15(21): 15289. https://doi.org/10.3390/su152115289