Mohammed S. Alfawzan*![]() | Essam Radwan
| Essam Radwan![]() | Marwa Elbany
| Marwa Elbany![]() | Meshal Almoshaogeh
| Meshal Almoshaogeh![]() | Hany A. Dahish
| Hany A. Dahish![]()
© 2025 The authors. This article is published by IIETA and is licensed under the CC BY 4.0 license (http://creativecommons.org/licenses/by/4.0/).
OPEN ACCESS
Traffic signal control systems play a critical role in managing urban mobility by regulating the flow at intersections. The Florida Department of Transportation (FDOT) installed a new signal timing system at several signalized intersections along multiple corridors in Central Florida. In December 2013, Orange County began implementing this system, which was completed in June 2015. This action was taken to reduce the frequency of red-light running incidents. The primary objective of this study was to assess how signalized intersections and corridors are affected by extended change and clearance intervals. Specifically, it aimed to evaluate FDOT’s signal timing effort and its potential impact on the safety and operational performance of selected intersections. To address this, twenty signalized intersections along three corridors in Central Florida were investigated. Additionally, three signal timing patterns were examined to evaluate the effectiveness and safety of the baseline (Pattern 1), the current FDOT implementation (Pattern 2), and the proposed alternative (Pattern 3). Microsimulation analysis was conducted using SimTraffic, a component of the Synchro 8 software. The study found that extended signal timing in Pattern 2 and the proposed Pattern 3, which incorporate longer change and clearance intervals, significantly increased intersection delay and volume-to-capacity (V/C) ratios. Furthermore, these patterns also led to noticeable increases in overall delay and travel time along the studied corridors.
FDOT's signal timing, signal timing patterns, SimTraffic tool, Synchro 8 software, intersection delay, volume-to-capacity
With the advent of the automobile revolution, intelligent transportation systems have introduced various signalized intersection control technologies aimed at developing efficient signal timing strategies that enhance intersection performance and overall roadway operations.
The purpose of change and clearance intervals is to enhance safety and facilitate traffic flow at signalized intersections. The change indication serves to alert approaching vehicles that the green interval is about to end. To ensure that any vehicle entering the intersection during the change interval can safely clear the intersection before any conflicting movements are released, a clearance interval is in place for all approaches. The FDOT's new signal timing was intended to lengthen the change and clearance intervals. It sought to reduce the red light running (RLR) frequency and the size of the dilemma zone.
The dilemma zone is defined as a zone of an intersection approach where a driver has to stop or move safely through the intersection during the change indication. When the change interval is long enough for a driver to either safely halt or move through the intersection before the change interval ends, another zone known as the option zone is created, according to traffic scientists. It lessens the detrimental effects of ineffective change intervals on safe driving practices.
The signal retiming adopted by the Florida Department of Transportation (FDOT) is designed to mitigate dilemma zones caused by inefficient change intervals, which can lead to increased red-light running. Three signal timing patterns with different change and clearance intervals were investigated using field data and microsimulation analysis at twenty signalized intersections along three corridors in Central Florida. These signal timing patterns were analysed using Synchro 8 software to assess the impact of signal retiming on the performance and safety of the studied intersections and corridors.
Several studies and resources on signal design indicate that change and clearance intervals are key components utilized in numerous ways. The change interval is designed to alert approaching traffic that the right-of-way for the current approach is about to end [1, 2]. It also warns drivers who are too close to the stop line to safely decelerate and stop, allowing them to continue through the intersection at their current speed and enter lawfully when the signal changes. The clearance interval, typically a red signal for all approaches, is intended to protect any vehicle that enters the intersection during the change interval by allowing it to safely clear the intersection before any conflicting movements are permitted [1]. The standard duration for the clearance interval at high-speed intersections is approximately two seconds [2].
The MUTCD has discussed the recommended change interval of three to six seconds [3]. It is stated that the longer change intervals should be allocated for approaches that have high posted speeds [4].
Numerous formulas for figuring out the change interval were given. ITE published a useful guide in 1985 that used a kinematic equation to determine the "vehicle clearance interval" or "change period." Before a change in right-of-way occurs, the equation determines how long it will take a driver to respond and notice the change in order to maintain his speed and safely enter the intersection or to slow down and stop comfortably. The dilemma zone refers to a specific area on an intersection approach where a driver, upon seeing the change indication, must decide whether to stop or proceed through the intersection [3].
It was early described by Gazis et al. [5] who found that a driver presented by a change interval indication and approaching a signalized intersection will have lack of time to safely inter the intersection or stop before the stop bar. An option zone is a zone within the onset of change interval; a driver can either stop safely or pass through the intersection before the end of the change interval. The zone is located where driver’s decision of either go through the intersection or stop is optional.
All cars approaching the intersection adhere to the prescribed speed limit, according to the ITE-recommended equations, which interpret traffic flow as predictable events. In practice, however, drivers' speeds differ, and the estimation of trip time is more random. According to Zegeer [6], a driver's choice at a particular crossroads approach defines the borders of the dilemma zone. He defined the beginning of the zone as a point where 90% of drivers tend to stop while the end of the zone is located where 10% of drivers tend to stop.
Travel time to the stop bar was chosen as the dilemma's border in 1985. By measuring the distance from the stop bar, the authors were able to determine the boundaries using this word. The majority of vehicles tend to proceed through the junction when they are two seconds or less from the stop bar, while 85% of drivers stop when they are three seconds or more back from the stop bar, according to the study. Accordingly, the dilemma zone is found to be between 5.5 and 2.5 seconds away from the stop bar [7].
Parsonson [8] and Si et al. [9] believed that the dilemma zone and option zone are theoretically different issues, even though the boundaries of the dilemma and option zones may overlap to a certain level. The dilemma zone can be eliminated by appropriate change and clearance duration while the option zone always exists at a particular area of an approach.
Click and Jones [10] investigated the traditional signal timing of change and clearance intervals to address the concern of signal timing on signalized intersection safety and capacity. They recommended a minimum time of 3 seconds for change time estimation based on ITE equations and to accept any change interval above 6 seconds [11].
To assess the impact of lengthening change intervals on RLR rates, several studies have been investigated. Retting et al. [12] proved that increasing amber time lengths by 1 second on studied signalized intersection approaches reduced RLR rates by almost 36% with a 95-confidence interval. In addition, Bonneson and Son [13] observed an increase of the change interval by 1 second can ideally decrease the RLR rate by 50%.
A major effort has been taken by traffic scientists to study the correlation between driver’s behavior and dilemma zone. El-Shawarby et al. [14] investigated an experiment consisting of sixty drivers to study driver’s behavior during the change interval. Derivers of various ages and sex were hired to drive a test vehicle at a test roadway system. They found that drivers stop at five predetermined distances. They specified that the dilemma zone was situated between 108 and 253 feet from the stop line at a speed of 45 mph.
Several studies have been conducted to estimate the driver’s perception-reaction time (PRT) in several environments. Taoka found that the 85th percentile PRT is in the range between 1.5-1.9 sec [15]. Chang et al. [16] studied the PRT and driver’s behavioural response and observed that speed significantly influences the median PRT which is almost 0.9 sec at a speed equal to or greater than 45 mph. Furthermore, Caird et al. [17] conducted a simulation experiment consisting of 77 drivers that focused on their driving behavior and found that the distance from the stop line also influences the PRT, which ranges from 0.86 sec for drivers who are close to the stop line to 1.03 sec for drivers who are far from it.
Several recent studies have underscored the critical role of change and clearance intervals in enhancing intersection safety and operational efficiency. Researchers have employed different methodologies to estimate optimal interval durations and assess their effects. For instance, some authors utilized high-resolution signal and trajectory data to model driver behavior during yellow intervals, revealing that short yellow durations significantly increased red-light running occurrences. Similarly, Marisamynathan and Perumal applied empirical field data and statistical modelling to explore vehicle-pedestrian conflicts during clearance intervals, highlighting that improperly timed intervals can increase crash risk, especially for turning movements [18].
In contrast, studies such as Al-Msari et al. used VISSIM micro simulation coupled with optimization algorithms to adjust change and clearance intervals dynamically, showing improvements in both safety and delay reduction [19]. Moreover, Tsitsokas et al. [20] proposed an adaptive control model that adjusts signal timing based on real-time data, suggesting that dynamically managed intervals can outperform static timing in congested environments.
While earlier studies often focused on static formulas, more recent approaches emphasize context-aware and behaviourally informed interval settings. Collectively, these findings suggest that the effectiveness of change and clearance intervals is highly sensitive to contextual factors such as driver behavior, vehicle speed, and pedestrian presence, and that adaptive, data-driven models offer promising improvements over traditional fixed-time approaches.
To mitigate dilemma zone impact on signalized intersections, the signal timing was studied to increase the degree of safety and efficiency of such signalized intersections. There were several formulas to estimate the duration of change interval as Rule-of Thumb Methods, Kinematic Model 1 and Kinematic Model 2. Kinematic Model 1 is the formal equation used to estimate the change interval based on the standard average deceleration shown in the ITE Transportation Engineering and traffic Engineering Handbook 1982. In essence, the Kinematic Model 2 is utilized to give enough change intervals so that, in the absence of a clearance interval, cars that choose not to stop can continue to pass through an intersection [21].
The Florida State uses the ITE formula found in ITE's Traffic Engineering Handbook 1999 to calculate the yellow change intervals. Florida State uses the ITE equation 3, found in ITE’s Traffic Engineering Handbook 1999 to compute the minimum clearance interval [22].
For protected left or right turns, the change and clearance intervals are selected based on the speed. While permissive left or right turns change and clearance intervals are identified by the concurrent through phase [22].
Several studies and state agencies have moved beyond traditional ITE-based formulas to incorporate more dynamic and context-aware methods for determining yellow and clearance intervals. For example, Li et al. [23] proposed a data-driven calibration approach using real-world driving behaviour and vehicle kinematics to refine yellow interval estimations, showing that local calibration significantly reduces red-light violations compared to standard ITE values.
Similarly, the Oregon Department of Transportation (ODOT) updated its signal timing guidelines in 2020 to recommend using observed driver behavior and high-resolution signal controller data for interval validation and adjustment, rather than relying solely on static formulas. These newer approaches account for variables such as driver reaction variability, intersection grade, and mixed traffic (including heavy vehicles and cyclists), providing a more robust foundation for calculating change and clearance intervals.
While the use of ITE-based formulas for determining change and clearance intervals is common practice, growing evidence suggests that these static models may not fully capture the complex dynamics of modern traffic conditions. Previous research has produced mixed findings regarding the impact of extended change and clearance intervals on operational performance and red-light running (RLR). Moreover, there is a lack of comprehensive empirical studies that evaluate alternative signal timing strategies across multiple intersections under consistent conditions.
This study addresses these gaps by using both field-collected data and microsimulation analysis to evaluate the effects of three distinct signal timing patterns—one current, one adopted, and one proposed—on twenty signalized intersections along three major corridors in Central Florida. By simulating real-world traffic scenarios using Synchro 8 and validating findings with FDOT-collected data, this research offers robust, context-specific evidence on how incremental adjustments in timing intervals influence intersection delay, safety metrics, and dilemma zone behaviour.
2.1 Research objective
This study aims to advance the current understanding of signal timing optimization by using both field data and micro-simulation analysis to assess the operational and safety impacts of varying change and clearance intervals at signalized intersections. Specifically, the objectives are to:
2.2 Data collection
Data collection was conducted as a part of the FDOT's corridor signal retiming program, which targeted multiple signalized intersections along state highways. The field implementation was carried out in phases between January 2011 and December 2015, with each corridor being monitored for a minimum of 12 consecutive months post-retiming to assess performance. Prior to retiming, baseline data were collected for each location over 4-week periods, capturing weekday peak and off-peak conditions. Field reviews included manual and automated observations performed during both AM (7:00–9:00 AM) and PM (4:00–6:00 PM) peak hours. Review teams used high-resolution controller logs, vehicle detection data, and direct video surveillance to monitor operations.
The endeavour to gather data and retime the signal consists of:
Key performance indicators assessed during field reviews include vehicle queue lengths, cycle failures, arrival types (platoon progression quality), phase utilization, red-light running occurrences, and pedestrian clearance violations.
Operational flaws are identified based on criteria such as excessive queue spillbacks, unserved vehicle arrivals within green intervals, frequent max-outs indicating insufficient green time, and significant delays beyond acceptable thresholds defined in the FDOT Traffic Signal Timing Manual.
The review process includes interviews with local signal operators and maintenance staff to document known problem areas or persistent complaints. This multi-faceted approach allowed for the targeted identification of signal timing deficiencies and informed the development of optimized timing plans.
A baseline for studies is created by modeling and calibrating current conditions.
Update local controller timings and develop three coordination timing plans.
Develop the “time of day” plans.
System timing development, implementation, fine-tuning, and post-implementation monitoring.
2.3 Selected intersections
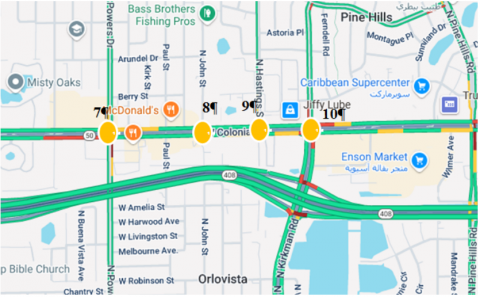
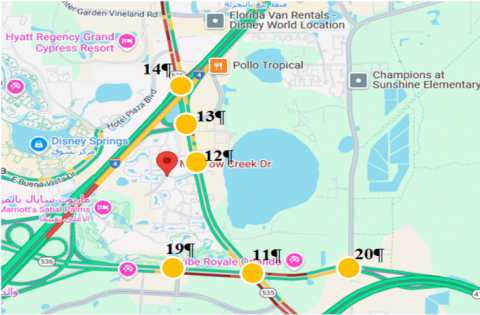
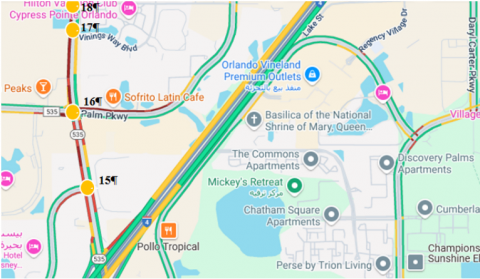
To study the impact of lengthening the duration of the change and clearance intervals on the performance of all intersections along the relevant corridors, four reports provided by Orange County, FDOT for the signal retiming project for 20 intersections along 3 corridors were investigated. The studied corridors are SR 50, which is divided into two segments with intersection numbered from 1 to 10 as shown in Figures 1 and 2. Also, SR535, SR536, are divided into two segments with intersection numbered from 11 to 20 as illustrated in Figures 3 and 4.
Figure 1. SR 50 layout (from 1 to 6)
Figure 2. SR 50 layout (from 7 to 10)
Figure 3. SR 535 and SR 536 layout (from 11 to 14 and 19, 20)
Figure 4. SR 535 and 536 layout (from 15 to 18)
Table 1. Signalized intersections along the SR 50 corridor
|
Int. |
Arterial |
Cross Street |
|
1 |
SR 50 |
Vizcaya Lakes Road |
|
2 |
SR 50 |
Good Homes Road |
|
3 |
SR 50 |
Apopka Vineland Road |
|
4 |
SR 50 |
Dorscher Road |
|
5 |
SR 50 |
Highland Lakes Center |
|
6 |
SR 50 |
CR 435 (Hiawassee Road) |
|
7 |
SR 50 |
Powers Drive |
|
8 |
SR 50 |
Paul Street |
|
9 |
SR 50 |
Hastings Street |
|
10 |
SR 50 |
SR 435 (Kirkman Road) |
Table 1 illustrates signalized intersections along SR 50 corridors, which start from Vizcaya Lakes Road to SR 435 (Kirkman Road).
The signalized intersections in the SR 535 and SR 536 corridors that are of interest to one another are displayed in Table 2. Along the SR 535, there are eight signalized intersections, and along the SR 536 are two.
Table 2. Signalized intersections on the SR 535 and SR 536 corridors
|
Int. |
Arterial |
Cross Street |
|
11 |
SR 535 |
SR 536 |
|
12 |
SR 535 |
Meadow Creek Drive |
|
13 |
SR 535 |
Vineland Ave/I-4 EB Ramp |
|
14 |
SR 535 |
I-4 Off Ramp |
|
15 |
SR 535 |
Hotel Plaza Blvd |
|
16 |
SR 535 |
Palm Parkway/CR 535 |
|
17 |
SR 535 |
Vinings Way Blvd |
|
18 |
SR 535 |
Lake Street |
|
19 |
SR 536 |
World Center Dr. |
|
20 |
SR 536 |
International Dr. |
2.4 Signal timing
The FDOT performed a signal system retiming effort along a number of corridors in several counties. In this paper, 20 signalized intersection data along three corridors were collected or calculated using revised 2010 and 2013 Florida Traffic Engineering Manuals 2002 based on three different signal timing patterns. Signal timing pattern 1 is the before data, which was the signal timing of all 20 signalized intersections implemented before 2011. Signal timing pattern 2 is the current signal timing system of implemented on most central Florida signalized intersections. Signal timing pattern 3 is the proposed signal timing pattern in this study to predict traffic operation if a PRT of two seconds is implemented.
Signal timing pattern 1 was based on ITE change and clearance Eqs. (1)-(3). The old signal timing of change interval was implemented on the intersections with a PRT of 1 second which is recommended by ITE based on a kinematic equation for calculating the "vehicle clearance interval" or "change period" [11, 22].
The all-red clearance interval values were computed using ITE's clearance interval formula found in ITE's Traffic Engineering Handbook (1999), and the FDOT Traffic Engineering Manual (2010) [22].
Table 3. Florida change interval (0% Grade)*, FDOT traffic engineering manual, 2013
|
Approach Speed (mph) |
Change Interval (Seconds) |
|
25 |
3.4 |
|
30 |
3.7 |
|
35 |
4.0 |
|
40 |
4.4 |
|
45 |
4.8 |
|
50 |
5.1 |
|
55 |
5.5 |
|
60 |
5.9 |
|
65 |
6.0 |
The signal timing pattern 2 had modifications on change and clearance intervals which are listed in the FDOT Traffic Engineering Manual FDOT. Traffic Engineering Manual 2013 states a longer minimum change interval. The PRT of change interval is increased from 1 second to 1.4 seconds. Table 3 found in the revised FDOT Traffic Engineering Manual 2013 shows the new standardization of the minimum change interval for signalized intersections based on speed limit.
The change period (CP) can be obtained from the following equation. For approach grades other than 0%, use ITE formula, Eq. (2).
$\mathrm{CP}=\mathrm{t}+\frac{\mathrm{V}}{2 \mathrm{a}+64.4 \mathrm{~g}}+\frac{\mathrm{W}+\mathrm{L}}{\mathrm{V}}$ (1)
where,
CP = change period (s);
t = perception reaction time (PRT) (usually 1 s);
V = approach speed (ft/s);
a = deceleration rate (ft/s2);
g = percent of grade divided by 100 (plus for upgrade, minus for downgrade);
W = width of intersection (ft);
L = length of vehicle (ft).
$Y=t+\frac{V}{2 a+2 G g}$ (2)
where,
Y = Change interval (s);
t = reaction time (typically 1 s);
V = design speed (ft/s);
a = deceleration rate (typically 10 ft/s2);
G = acceleration due to gravity (32.2 ft/s2);
g = grade of approach (percent/100, downhill is negative grade).
$\mathrm{R}=\frac{\mathrm{W}+\mathrm{L}}{\mathrm{V}}$ (3)
where,
R = clearance interval (s);
V = design speed (ft/s);
W = width of stop line to far-side no-conflict point (ft);
L = length of vehicle, typically 20 ft.
The clearance interval is estimated using engineering practices. The values are calculated using Equation 3 found in ITE's Traffic Engineering Handbook (1999) and the FDOT Traffic Engineering Manual (2002). The manual states a minimum value of 2.0 seconds and a maximum value of 6.0 seconds for clearance interval. Additionally, depending on an intersection's characteristics and engineering judgment, a clearance interval longer than two seconds may be implemented [19].
Recently, the engineering committee of Florida department of Transportation advocated lengthening the clearance intervals of signalized intersections on a number of corridors in several counties using such a technical method to provide adequate clearance intervals. Clearance intervals can significantly affect intersection safety by reducing the frequency of right angle crashes [24]. The method typically based on engineering judgment and intersections characteristic. Therefore, the lengthening of the intersection clearance interval is computed using Eq. (3) found in ITE's Traffic Engineering Handbook (1999). However, the new technique mainly relies on using a lower posted speed of such an intersection to compute the clearance. For example, the clearance period for high speed left turn approaches at signalized intersections is determined using the posted speed of 25 mph. Signal timing pattern 3 is based on ITE change and clearance Eqs. (1)-(3). However, a proposed minor modification is implemented on pattern 3 to prolong the change interval using PRT of 2.0 seconds [24].
Before and current change intervals were collected from the four reports provided by Orange County, FDOT for twenty intersections along three corridors while the proposed change intervals were calculated using a PRT of 2 seconds. The before and current clearance intervals were calculated using Eq. (3) Engineering Handbook (1999). Signal timing pattern 2 clearance intervals were computed using lower speed limit of 25 mph and 5.0 mph for left turn approaches and through approaches; respectively based on the signal retiming project implemented after 2011.
2.5 Traffic volume and approaches splits data
For the signal retiming project, Orange County, FDOT, produced four reports from which twenty signalized crossings' turning movement counts and split timing data were gathered during morning and evening peak hours.
2.6 Simulation tool
In this research, Synchro 8 software was utilized to analyze three different signal patterns timing for twenty signalized intersections along three corridors. The main objective of using Synchro 8 is to investigate the efficiency attributes of carries signal timings on signalized intersections. Basically, SimTraffic, which is a micro-simulation model as a part of Synchro 8, was used to measure three major parameters for each pattern. The three measures are the intersection delay (seconds per vehicle), the critical left turn movement 95th percentile queue length (feet), and intersection volume to capacity ratio (V/C). Eighteen hours of simulation runs were implemented on three patterns composed of twenty signalized intersections through three arterials during morning and evening peak hours.
2.7 Model calibration
There are prior studies using VISSIM, e.g., Park and Schneeberger [25]. Although Synchro 8 and SimTraffic were used in this study instead of VISSIM, the underlying principles for calibration remain consistent—particularly the adjustment of key input parameters to reflect observed field conditions. This study uses their parameters to ensure the reliability of simulation results; a systematic calibration process was applied following methodologies similar to those in prior studies.
Field data were collected from twenty signalized intersections, including volumes, signal phasing, saturation flow rates, and vehicle arrival patterns during peak periods. These data were input into Synchro 8, and simulation outputs (e.g., intersection delay, V/C ratio, queue length) were compared with observed performance metrics. Iterative adjustments were made to the signal timing settings, including green splits, cycle lengths, and change/clearance intervals, to minimize the difference between simulated and observed values. This follows the calibration steps outlined by Park and Qi [26], who emphasized minimizing the mean absolute percentage error (MAPE) between field and simulation data as a key criterion for calibration quality.
To investigate the impact of lengthening the change and clearance intervals timing on intersections and arterial efficiency, three major parameters were measured for the three signal timing patterns. The performance measures are determined. Finally, the equations of dilemma and option zones were utilized to study the impact of the three signal timing patterns of extending change and clearance phases on intersections' safety.
3.1 Signal timing plans
The delay, 95th percentile queuing length of the critical left turn movement, and V/C ratio were measured to investigate the extended change and clearance intervals on the signalized intersections and corridors.
3.1.1 Signal timing pattern 1
It was implemented for SR 50, SR 535, and SR 536 intersections before FDOT carried the signal system retiming project. Generally, the cycle's length of SR 50 corridor was ranged between 150 seconds and 170 seconds for morning peak hour and ranged between 180 seconds and 190 seconds for the evening peak hour.
3.1.2 Signal timing pattern 2
It is the current signal timing system implemented recently on central Florida signalized intersections. It was recently approved by the FDOT and performed on a number of corridors in Florida. The signal retiming system extended moderately the signal cycles by lengthening the change and clearance intervals. For pattern 2, the cycle lengths signalized intersections show longer cycles length with usually between 5 to 10 seconds more than in pattern 1 that led to an increase in delays of traffic passing through the corridors intersections.
3.1.3 Signal timing pattern 3
It is a proposed signal timing designed with a perception-response time (PRT) of 2 seconds. In this research the signal timing pattern 3 was theoretically proposed to predict the efficiency and safety risks expected on signalized intersections.
The cycle lengths of pattern 3 are optimized with longer cycle's length of usually 3 more seconds comparing to pattern 2. Pattern 3 signal timing composes of PRT of 2 seconds and clearance interval as same as pattern 2.
3.1.4 Signal timing patterns evaluation
The main purpose of signal retiming effort performed by FDOT is to minimize the RLR frequencies and improve the level of safety for signalized intersections. However, potential issues are considered to be obvious of extending the change and clearance intervals. Both adopted and proposed patterns of signal timing during morning and evening peak hours were investigated using proper traffic measurements to evaluate each pattern and how it varies from the before signal timing pattern 1. Results are graphically illustrated to complete the picture of the analysis.
(1) The estimated delay per vehicle for signal timing patterns
The overall intersection delay was used to evaluate signal timing patterns based on the Synchro 8 simulation of the signalized intersections along the three corridors.
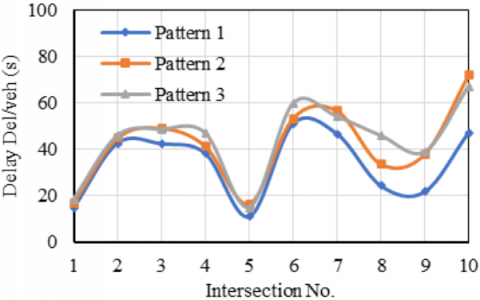
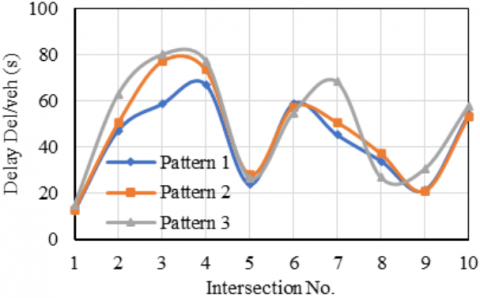
Figures 5 and 6 show the delay of the signal timing patterns for SR 50. From pattern 1 to patterns 2 and 3, it is evident that the general trend of delay rises. But from pattern 1 to patterns 2 and 3, the delay is more noticeable, whereas from pattern 2 to pattern 3, the delay is marginally acceptable. The reason is that pattern 1 has a shorter clearing interval duration than patterns 2 and 3, whereas patterns 2 and 3 have the same clearance interval time. Additionally, pattern 3, which have a longer cycle length and a longer PRT of two seconds. Some intersections were observed to have lower delay comparing with pattern 2. Certain approaches to those crossings have large volumes and short green intervals, which explains why there is less delay at those intersections with higher PRT and cycle duration. As a result, Synchro 8 views a longer PRT of change interval as a component of the green interval, which allowed for the discharge of more traffic and reduced the overall delay at intersections 3, 5, and 7.
Figure 5. Estimated signal timing pattern delays during SR 50's morning peak
Figure 6. Estimated signal timing pattern delays during SR 50's evening peak
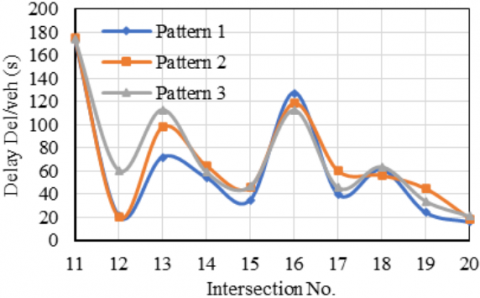
Figures 7 and 8 show the estimated delays for the signal timing patterns on SR 535 and SR 536. During both morning and evening peak hours, the overall delay increases from pattern 1 to patterns 2 and 3. Intersection delay is notably higher when comparing pattern 1 to pattern 2 or pattern 1 to pattern 3, while the difference between pattern 2 and pattern 3 is relatively minor. Synchro 8 treats the longer PRT of the change interval as part of the green interval, which allows more vehicles to discharge and helps minimize overall delay at certain intersections, such as intersections 11, 14, 16, and 19.
Figure 7. Estimated delays of signal timing patterns during SR 535 and SR 536's morning peak hour
Figure 8. Estimated delays of signal timing patterns during SR 535 and SR 536's evening peak hour
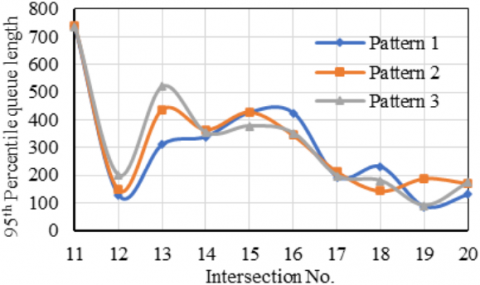
(2) The estimated 95th percentile queue length for signal timing patterns
Queue length can accurately assess signal timing efficiency. To find out how effective it is to lengthen the change and clearance intervals on the examined signalized junctions and arterials, the queue length measurement for left turn movement was measured for three signal timing patterns. Actually, the FDOT traffic engineers thoroughly examined the timing of the left turn movement signal in order to reduce the possibility of RLR on the main thoroughfares in Central Florida. This study will use the three signal timings throughout morning and evening peak hours to examine the 95th percentile queue duration of the critical left turn movement of such an intersection.
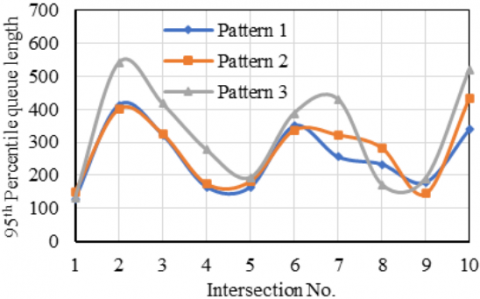
Figure 9. Queue lengths of signal timing patterns during SR 50's evening peak
Figure 9 shows the 95th percentile queue lengths for the three signal timing patterns implemented on SR 50. The trend indicates that queue lengths generally increase as the durations of the change and clearance intervals increase. When comparing patterns 2 and 3 to signal timing pattern 1, most signalized intersections along the SR 50 corridor exhibit longer queue lengths. However, for several intersections under pattern 3, increasing the clearance interval appeared beneficial during morning and evening peak hours. The longer PRT of 2 seconds, included in the change interval of pattern 3, is treated by Synchro 8 as part of the green interval. This treatment allows for greater vehicle discharge and helps reduce queue lengths at critical intersections where green time is limited and traffic volume is high.
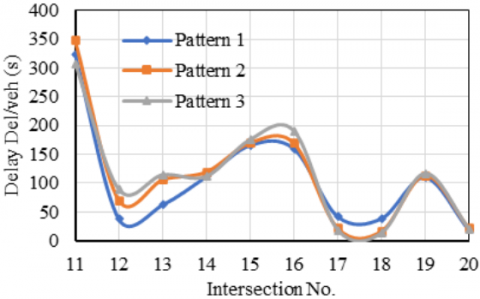
Most signalized intersections along SR 535 and SR 536 exhibited longer queue lengths as a result of the additional seconds added to the change and clearance intervals in signal timing patterns 2 and 3. Figure 10 illustrates the queue lengths for the three signal timing patterns across ten signalized intersections on SR 535. The results show that queue lengths increase with longer change and clearance intervals. The queue lengths observed under signal timing patterns 2 and 3 were significantly higher than those under pattern 1.
Figure 10. Queue length of signal timing patterns during SR 535 and SR 536's evening peak
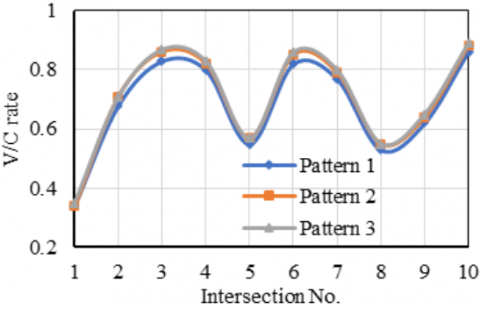
(3) Intersection V/C ratio for signal timing patterns
V/C ratio is used with other traffic measurements to distinguish between the different signal timing systems. It is found that extending the change and clearance intervals increases the intersection V/C ratio.
The intersection V/C ratio for three signal timings at the signalized intersections on SR 50 during evening peak hours is displayed in Figure 11. As the cycle length grows, so does the average V/C ratio of the three signal timings? It is demonstrated that the mean V/C ratio of signal timing patterns 2 and 3 is higher than the average of pattern 1.
Figure 11. V/C ratio of signal timing patterns during SR 50's evening peak
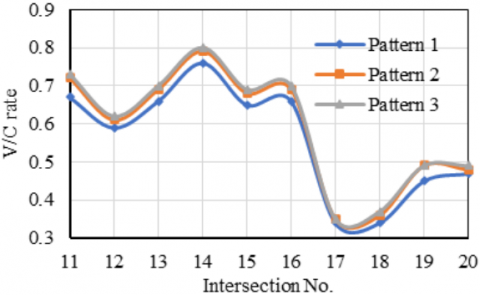
Figure 12. V/C ratio of signal timing patterns for SR 535 and SR 536
Figure 12 shows the intersection V/C ratio for the signalized intersections located on SR 535 and SR 536 arterials during evening peak hours for three signal timings. To conclude, it was observed that the average V/C ratio for signal timing pattern 2 and pattern 3 was found significantly more saturated than signal timing pattern 1.
3.1.5 Signal timing patterns impact on a corridor
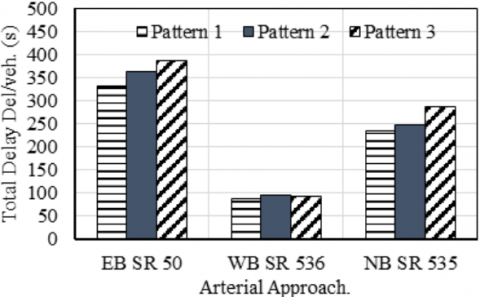
(1) Arterial total delay
Total delay (seconds per vehicle) is a measurement to estimate the arterial delay for a vehicle traveling with signal timing patterns system as shown in Figure 13.
It was observed that the additional time of change and clearance intervals significantly increases the total delay per vehicle traveling along the studied arterials. The new and proposed signal timing patterns 2 and 3 caused more total delay for a motorist traveling through the studied SR 50, SR 535, and SR 536 corridors.
Figure 13. Arterial total delays per vehicle during morning peak
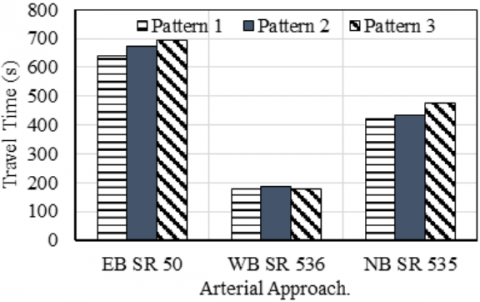
(2) Total travel time for a corridor
Travel time along a corridor is a key performance measure for evaluating signal timing patterns. Both total delay and travel time were assessed for the three signal timing patterns during the evening peak hour. The microsimulation results across the three corridors revealed significantly higher delays and longer travel times for signal timing patterns 2 and 3. Specifically, patterns 2 and 3 resulted in 3% to 10% additional delay and increased travel time on the arterials compared to pattern 1, as shown in Figure 14.
Figure 14. Arterial total travel time
3.2 Red light running statistics
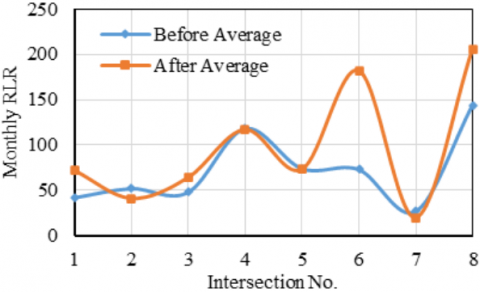
RLR is a safety risk issue in most metropolitan areas. The Florida States Department of Transportation, FDOT admitted this issue and investigates it widely for potential solutions. To mitigate this issue, the FDOT adopted the practice of prolonging the change interval to minimize running red light. In this part of the research, a naïve statistical method was performed to investigate the potential impact of additional change interval on red light running and if that reduces RLR. Based on limited data provided by Orange County FDOT for eight approaches located in six intersections during ten months, a naïve statistical method was performed as shown in Figure 15.
Figure 15. Average monthly red light running
Based on the naïve statistical method, it can be concluded that the new signal timing does not significantly reduce the frequency of red light running. However, the new signal timing shows a significant increase of RLR in congested approaches. To sum up, the limited data is not reliable enough to state such conclusion.
3.3 Dilemma and option zones study for SR 50 intersections
In order to assess how the new signal timing project would affect the potential safety risk of signalized intersections, a subset of signalized intersections on SR 50 for signal timing patterns 1, 2, and 3 were measured using Eqs. (4) and (5), which are described by Gazis et al. [5] and estimate dilemma and option zones.
$c=V 0 \delta 2+\frac{V 0^2}{2 a 2}$ (4)
$\mathrm{X} 0=\mathrm{V} 0 \tau-\mathrm{W}+\frac{1}{2} \mathrm{a} 1(\tau-\delta 1)^2$ (5)
where,
V0 = the approach speed (ft/s);
$\delta 2$ = the driver's perception-reaction time (sec);
a2 = the maximum vehicle's deceleration rate (ft2/s);
$\delta 1$ = the driver's perception-reaction time for running (sec);
a1 = the constant of the vehicle's acceleration rate (ft2/s);
τ = the duration of change interval (sec);
W = the summation of intersection width and the length of vehicle.
To put it simply, the area of the dilemma and option zones was quantified by obtaining the Xc and X0. The dilemma zone can be measured by subtracting X0 out of Xc. Otherwise, the option zone exists when the results of Xc-X0 are negative as shown in Table 4.
Table 4. Dilemma and option zones identification of intersection 2
|
Intersection 2 |
EBL |
WB |
SBL |
NB |
|
XC (ft) |
284.9 |
284.9 |
284.9 |
284.9 |
|
X0 pattern 1 (ft) |
243.9 |
243.9 |
209.9 |
209.9 |
|
XC-X0 pattern 1 |
41.0 |
41.0 |
75.0 |
75.0 |
|
X0 pattern 2 (ft) |
274.7 |
274.7 |
261.8 |
261.8 |
|
XC-X0 pattern 2 |
10.2 |
10.2 |
23.2 |
23.2 |
|
X0 pattern 3 (ft) |
350.1 |
350.1 |
316.1 |
316.1 |
|
XC-X0 pattern 3 |
-65.1 |
-65.1 |
-31.1 |
-31.1 |
|
Intersection 2 |
WBL |
EB |
NBL |
SB |
|
XC (ft) |
284.9 |
284.9 |
284.9 |
284.9 |
|
X0 pattern 1 (ft) |
227.9 |
227.9 |
207.9 |
207.9 |
|
XC-X0 pattern 1 |
57.0 |
57.0 |
77.0 |
77.0 |
|
X0 pattern 2 (ft) |
258.7 |
258.7 |
259.8 |
259.8 |
|
XC-X0 pattern 2 |
26.2 |
26.2 |
25.2 |
25.2 |
|
X0 pattern 3 (ft) |
334.1 |
334.1 |
314.1 |
314.1 |
|
XC-X0 pattern 3 |
-49.1 |
-49.1 |
-29.1 |
-29.1 |
Table 4 reveals meaningful implications for intersection safety. According to crash risk literature, particularly studies by Bonneson and Zimmerman [27] and Rakha et al. [28], a well-defined and minimized dilemma zone reduces the likelihood of indecisive driver behavior, which is a key contributor to red-light running and rear-end collisions. In this study, signal timing pattern 2 effectively reduced the size of the dilemma zone across all approaches, suggesting improved decision-making conditions for drivers as they approach the intersection at the onset of yellow. Pattern 3 further shortened the dilemma zone while extending the option zone, providing drivers with a larger buffer for safe manoeuvring decisions.
These outcomes imply that both patterns 2 and 3 have the potential to lower crash risks associated with late stopping or unsafe acceleration at the end of green intervals. As an actionable insight, agencies could consider implementing signal timing patterns that balance both reduced dilemma zones and extended option zones, especially at intersections with high-speed approaches or elevated red-light running histories. The use of vehicle trajectory data and high-resolution signal monitoring can further help traffic engineers identify critical approaches where targeted interval adjustments would yield the highest safety benefits.
3.4 Statistical analysis
This study evaluates the effects of prolonged change and clearance intervals on the operational efficiency and safety of signalized intersections and corridors. The change and clearance intervals function as independent variables, whereas the primary dependent variables include intersection delay, vehicle queue length, V/C ratio, and safety indicators, such as RLR frequency and dimensions of dilemma/option zones.
The following hypotheses were proposed, providing a way to test the effects of FDOT’s retiming strategy using simulations and statistical analysis:
The null hypothesis (H₀) posits that extending the change and clearance intervals at signalized intersections does not lead to statistically significant differences in intersection performance or safety, as assessed by metrics such as intersection delay, queue length, V/C ratio, and frequency of red-light violations.
Alternative hypothesis (H₁): Extending the change and clearance intervals at signalized intersections leads to statistically significant alterations in intersection performance and safety.
Prolonged cycle lengths result in heightened intersection delay and extended queue lengths.
Elevated V/C ratio signifies greater saturation levels.
Shortened dilemma zone lengths and extended option zone lengths may affect driver decision-making and potentially decrease the frequency of RLR.
A paired t-test was run to determine if the variations shown in the simulation results were statistically significant, therefore allowing an evaluation of the operational and safety consequences of the three signal timing patterns. The comparisons consisted of pattern 1 (pre-retiming) vs. pattern 2 (current FDOT implementation), pattern 1 vs. pattern 3 (suggested with 2.0 sec PRT), and pattern 2 vs. pattern 3.
Three main performance indicators were compared using these: delay at intersections (sec/vehicle), length of 95th percentile queue (ft), and the ratio of intersection volume to capacity (V/C).
Tables 5-8 summarize the results of the paired t-tests for both morning and evening peak hours.
Table 5. SR 50 paired t-test of signal timing patterns during morning plan
|
Morning Plan |
95% Confidence Interval Paired T-Test (2-Tailed) |
||
|
SR 50 |
Delay Del/veh (s) |
||
|
Mean |
Std. Dev |
Sig. |
|
|
Pattern 1 vs Pattern 2 |
-8.000 |
7.557 |
.009 |
|
Pattern 1 vs Pattern 3 |
-10.10 |
7.047 |
.001 |
|
Pattern 2 vs Pattern 3 |
-2.100 |
5.280 |
.240 |
|
SR 50 |
95th queue length (ft) |
||
|
Mean |
Std. Dev |
Sig. |
|
|
Pattern 1 vs Pattern 2 |
-30.400 |
55.448 |
.117 |
|
Pattern 1 vs Pattern 3 |
-7.450 |
16.177 |
.179 |
|
Pattern 2 vs Pattern 3 |
22.950 |
55.146 |
.221 |
|
SR 50 |
Intersection V/C |
||
|
Mean |
Std. Dev |
Sig. |
|
|
Pattern 1 vs Pattern 2 |
-.02000 |
.008165 |
.00003 |
|
Pattern 1 vs Pattern 3 |
-.0300 |
.011547 |
.00002 |
|
Pattern 2 vs Pattern 3 |
-.01000 |
.004714 |
.00009 |
As shown in Table 5, significant differences were observed among the three signal timing patterns during the morning peak period along SR 50. Specifically, the intersection delay showed a statistically significant difference between pattern 1 and pattern 3 at the 95% confidence level, while the difference between pattern 1 and pattern 2 was significant at the 90% confidence level. No significant difference was found between the delays associated with pattern 2 and pattern 3.
The paired t-test does not illustrate any significant difference between the 95th queue lengths signal timing patterns. In contrast, the paired t-test showed a slight increase in the V/C ratio in pattern 2 and a significant increase in pattern 3 compared to pattern 1.
Also, it applied on SR 535 & SR 536 signal timing patterns seem to behave as the SR 50 signal timing during morning peak hour. Table 6 shows a significant increase in delay in pattern and pattern 3 at a 90% confidence interval while the delay mean deference was found insignificant between pattern 2 and pattern 3.
On the other hand, the paired t-test applied between pattern 1 vs pattern 2, pattern 1 vs. pattern 3, and pattern 2 vs. pattern 3 at 95th percentile queue length does not show any significant difference. The paired t-test of intersection V/C ratio provides significant differences between all signals timing pattern in 95% confidence interval.
Table 6. SR 535 and SR 536 paired t-test of signal timing patterns during morning plan
|
Morning Plan |
95% Confidence Interval Paired T-Test (2-Tailed) |
||
|
SR 535 & SR 536 |
Delay Del/veh (s) |
||
|
Mean |
Std. Dev |
Sig. |
|
|
Pattern 1 vs Pattern 2 |
-7.730 |
11.711 |
0.066 |
|
Pattern 1 vs Pattern 3 |
-10.750 |
17.1036 |
0.078 |
|
Pattern 2 vs Pattern 3 |
-3.020 |
15.729 |
0.559 |
|
SR 535 & SR 536 |
95th queue length (ft) |
||
|
Mean |
Std. Dev |
Sig. |
|
|
Pattern 1 vs Pattern 2 |
-17.400 |
67.360 |
0.435 |
|
Pattern 1 vs Pattern 3 |
-17.700 |
80.491 |
0.504 |
|
Pattern 2 vs Pattern 3 |
-.30000 |
50.839 |
0.986 |
|
SR 535 & SR 536 |
Intersection V/C |
||
|
Mean |
Std. Dev |
Sig. |
|
|
Pattern 1 vs Pattern 2 |
-.0370 |
0.01494 |
.00003 |
|
Pattern 1 vs Pattern 3 |
-.0470 |
0.0170 |
.00001 |
|
Pattern 2 vs Pattern 3 |
-.0100 |
0.0047 |
.00009 |
Table 7. SR 50 paired t-test of signal timing patterns during evening plan
|
Evening Plan |
95% Confidence Interval Paired T-Test (2-Tailed) |
||
|
SR 50 |
Delay Del/veh (s) |
||
|
Mean |
Std. Dev |
Sig. |
|
|
Pattern 1 vs Pattern 2 |
-3.850 |
5.830 |
0.066 |
|
Pattern 1 vs Pattern 3 |
-7.860 |
10.139 |
0.037 |
|
Pattern 2 vs Pattern 3 |
-4.010 |
7.998 |
0.147 |
|
SR 50 |
95th queue length (ft) |
||
|
Mean |
Std. Dev |
Sig. |
|
|
Pattern 1 vs Pattern 2 |
-20.800 |
39.395 |
0.129 |
|
Pattern 1 vs Pattern 3 |
-71.600 |
79.787 |
0.019 |
|
Pattern 2 vs Pattern 3 |
-50.800 |
74.601 |
0.06 |
|
SR 50 |
Intersection V/C |
||
|
Mean |
Std. Dev |
Sig. |
|
|
Pattern 1 vs Pattern 2 |
-0.0210 |
0.0088 |
0.00003 |
|
Pattern 1 vs Pattern 3 |
-0.0280 |
0.0092 |
0.000005 |
|
Pattern 2 vs Pattern 3 |
-0.0070 |
0.0048 |
0.001 |
Table 7 states significant differences between the means of the signal timings different measurements during evening plan along SR 50 corridor. It can be concluded that there are significant differences between the intersection delay means of signal timings pattern 1 vs. pattern 2 using a 90% confidence interval and pattern 1 vs. pattern 3 using a 95% confidence interval. Moreover, the 95% percentile queue length shows significant differences between signal timings pattern 1 vs. pattern 3 and pattern 2 vs. pattern 3. The intersection V/C ratio shows significant differences between all the signal timing patterns 95% confidence interval.
Table 8 shows that there are no significant differences between the traffic measurements pattern 1 vs. pattern 2, pattern 1 vs. pattern 3, and pattern 2 vs. pattern 3 for intersection delay and 95th queue length during the evening plan along SR 535 & SR536. However, it shows significant differences between all signal timing patterns for the intersection V/C ratio.
Table 8. SR 535 and SR 536 paired t-test of signal timing patterns during evening plan
|
Evening Plan |
95% Confidence Interval Paired T-Test (2-Tailed) |
||
|
SR 535 & SR 536 |
Delay Del/veh (s) |
||
|
Mean |
Std. Dev |
Sig. |
|
|
Pattern 1 vs Pattern 2 |
-7.940 |
20.972 |
0.262 |
|
Pattern 1 vs Pattern 3 |
-8.550 |
27.939 |
0.358 |
|
Pattern 2 vs Pattern 3 |
-0.610 |
16.873 |
0.911 |
|
SR 535 & SR 536 |
95th queue length (ft) |
||
|
Mean |
Std. Dev |
Sig. |
|
|
Pattern 1 vs Pattern 2 |
-36.100 |
85.386 |
0.214 |
|
Pattern 1 vs Pattern 3 |
-22.900 |
96.799 |
0.473 |
|
Pattern 2 vs Pattern 3 |
13.200 |
33.918 |
0.25 |
|
SR 535 & SR 536 |
Intersection V/C |
||
|
Mean |
Std. Dev |
Sig. |
|
|
Pattern 1 vs Pattern 2 |
-.0420 |
.0210 |
.0001 |
|
Pattern 1 vs Pattern 3 |
-.0540 |
.0246 |
.0001 |
|
Pattern 2 vs Pattern 3 |
-6.1000 |
2.0838 |
.0001 |
3.4.1 Delay at intersections
Significant increases in delay were observed from pattern 1 to patterns 2 and 3, particularly along the SR 50 and SR 535 corridors during morning and evening peak times. The rise from pattern 2 to pattern 3 was modest and usually not statistically relevant.
This suggests that longer cycle lengths result from prolonging change and clearance intervals, hence lowering green time efficiency and raising the time every car spends at the junction. Although greater change intervals can potentially enhance safety by lowering red-light running, the related delay might affect travel time dependability, particularly during peak traffic. The non-significant difference between patterns 2 and 3 implies declining benefits when raising PRT beyond 1.4 seconds.
Observed increases in wait length, especially between pattern 1 and pattern 3. Most variations, however, were not statistically relevant.
Longer lines indicate lower junction throughput and possible spillback into upstream intersections. Although the rises are not always statistically significant, they may still have practical consequences in busy urban areas with limited queue space. The outcome indicates that while the longer intervals noticeably affect latency, their effect on queue lengths is more unpredictable and reliant on the situation.
3.4.2 Volume-to-capacity (V/C) ratio
All corridors and peak times exhibited very significant variations in all comparisons.
Pattern 1 had the lowest V/C ratio, followed by pattern 2, while pattern 3 had the highest.
The V/C ratio indicates how saturated an intersection is. A higher V/C ratio shows that crossings are functioning nearer to their capacity, hence raising the likelihood of congestion and operational failures. The results imply that especially under peak demand, prolonged change and clearing intervals might impair capacity, thereby driving junctions closer to oversaturation situations.
Traffic engineers need this knowledge especially. Although longer intervals may provide safety advantages, trade-offs in junction capacity have to be carefully considered, especially on arterials with large traffic volumes.
Table 9. Summary of operational implications
|
Comparison |
Delay |
Queue Length |
V/C Ratio |
Interpretation |
|
P1 vs. P2 |
↑ Significant |
↑ Slight (NS) |
↑ Significant |
Moderate safety gain; increased congestion risk |
|
P1 vs. P3 |
↑ Higher |
↑ Higher (NS) |
↑ Highest |
Greater safety zone extension; higher delay |
|
P2 vs. P3 |
~ Similar |
~ Similar |
↑ Small but significant |
Marginal safety gain; minimal operational benefit |
3.4.3 Consequences for safety and RLR
Although the paired t-test emphasized operational metrics, qualitative safety insights from limited RLR data and dilemma/option zone computations revealed that pattern 2 dramatically lowered dilemma zones, potentially decreasing crash risks. Though it included much too lengthy choice zones, pattern 3 further lowered dilemma zones, maybe leading to driver hesitancy or non-compliance.
A longer PRT increases the chance for drivers to make better choices, but beyond a certain point, it might needlessly postpone traffic without a corresponding safety advantage. The challenge lies in finding the best balance between operational efficiency and safety improvements. Table 9 summarizes the operational implications.
This study evaluated the impact of extending change and clearance intervals at signalized intersections along three major corridors as part of FDOT's signal retiming initiative. Using Synchro 8 simulations across three signal timing patterns during peak periods, the results indicated that extending these intervals (patterns 2 and 3) led to measurable increases in intersection delay and V/C ratio compared to the base timing (pattern 1). Specifically, delays increased by 6% to 30%, and V/C ratio was significantly affected along most arterial approaches. Despite these operational drawbacks, pattern 2 was found to reduce the size of dilemma zones at several approaches, which is a key factor in improving driver decision-making and potentially enhancing safety.
However, the study also found that extending change and clearance intervals did not significantly reduce red-light running (RLR) rates based on the limited available data. This suggests that while longer intervals may offer theoretical or localized safety benefits, they may not be sufficient on their own to reduce RLR in practice—especially without broader driver behavior modifications or enforcement strategies.
Given the mixed effects of longer change and clearance intervals—reduced dilemma zones but increased delay—it is recommended that signal timing changes be implemented selectively, targeting high-risk intersections with frequent dilemma zone issues or crash histories. In addition, complementary strategies such as red-light cameras, high-visibility enforcement, or driver advisory systems may be more effective in curbing RLR while avoiding unnecessary increases in delay. Adaptive signal control systems that can dynamically adjust clearance intervals based on real-time traffic conditions may also offer a more balanced solution.
The study is limited by its reliance on simulation data and a relatively short observational period for RLR frequency, which restricts the ability to draw definitive safety conclusions. The absence of extensive before-and-after crash data further limits the evaluation of actual safety outcomes. Moreover, driver behavior variability across different geographic areas was not incorporated into the models, which may affect the generalizability of the results.
A critical gap in previous works was filled by applying a structured, corridor-wide analysis across multiple intersections using real-world traffic data. The results demonstrate that although extended intervals can help mitigate dilemma zones and potentially improve driver decision-making, they also introduce measurable increases in intersection delay and V/C ratio. These findings challenge the assumption that longer intervals always yield safer outcomes without operational costs.
Therefore, a key recommendation is that intersection-specific characteristics—such as approach speed, traffic composition, and historical crash patterns—should guide interval adjustments. Future work should further explore adaptive signal timing methods and long-term safety data to validate and extend these findings. This study lays a foundation for more targeted, data-informed approaches to signal retiming that align safety improvements with operational efficiency.
Transportation agencies like FDOT must balance safety improvements with operational efficiency when adjusting signal timing. This study shows that while extended change and clearance intervals can reduce safety risks like red-light running, they may also increase delays. FDOT guidelines recommend context-sensitive decisions based on crash history and performance data. In high-risk areas, longer intervals may be justified, while in low-risk areas, maintaining efficiency may take priority. Tools like adaptive signal control and high-resolution data can support data-driven, location-specific decisions.
To strengthen the findings, future research should include long-term observational data on RLR and crash trends following signal retiming, incorporate driver behavior modeling, and explore the integration of adaptive signal technologies. Evaluating the cost-benefit trade-offs of signal timing strategies in terms of both safety and operational efficiency is also recommended to support more data-driven policy decisions.
[1] Knodler Jr, M.A., Hurwitz, D.S. (2009). An evaluation of dilemma zone protection practices for signalized intersection control. Report No. 2009-6.
[2] National Library of Australia (2003). Guide to traffic engineering practice: Part 7–Traffic signal. Austroads Inc. http://www.sinaldetransito.com.br/biblioteca_interna/manual_australiano_de_semaforos.pdf.
[3] McGee Sr, H., Moriarty, K., Gates, T.J. (2012). Guidelines for timing yellow and red intervals at signalized intersections. Transportation Research Record, 2298(1): 1-8. https://doi.org/10.3141/2298-01
[4] Federal Highway Administration. (2003). Manual on Uniform Traffic Control Devices (MUTCD). https://mutcd.fhwa.dot.gov/htm/2003/mutcd2003cl.htm.
[5] Gazis, D., Herman, R., Maradudin, A. (1960). The problem of the amber signal light in traffic flow. Operations Research, 8(1): 112-132. https://doi.org/10.1287/opre.8.1.112
[6] Zegeer, C.V. (1977). Effectiveness of green-extension systems at high-speed intersections. Kentucky Transportation, Research Report, No. 472. https://doi.org/10.13023/KTC.RR.1977.472
[7] Wu, M.M., Ma, W.J., Li, L. (2013). Characterize dilemma zone and minimize its effect at coordinated signalized intersections. Procedia–Social and Behavioral Sciences, 96: 766-778. https://doi.org/10.1016/j.sbspro.2013.08.087
[8] Parsonson, P.S. (1992). NCHRP Synthesis of Highway Practice 172: Signal Timing Improvement Practices. Transportation Research Board, National Research Council, Washington, DC. http://onlinepubs.trb.org/Onlinepubs/nchrp/nchrp_syn_172.pdf.
[9] Si, J.W., Urbanik, T., Han, L.D. (2007). Effectiveness of alternative detector configurations for option zone protection on high-speed approaches to traffic signals. Transportation Research Record: Journal of the Transportation Research Board, 2035(1): 107-113. https://doi.org/10.3141/2035-12
[10] Click, S.M., Jones, D.L. (2006). Calculation of yellow change and all-red clearance intervals: North Carolina experience. In Transportation Research Board 85th Annual Meeting, Washington D.C., United States.
[11] Click, S.M. (2008). Application of the ITE change and clearance interval formulas in North Carolina. Institute of Transportation Engineers. ITE Journal, 78(1): 20.
[12] Retting, R.A., Ferguson, S.A., Farmer, C.M. (2008). Reducing red light running through longer yellow signal timing and red light camera enforcement: Results of a field investigation. Accident Analysis & Prevention, 40(1): 327-333. https://doi.org/10.1016/j.aap.2007.06.011
[13] Bonneson, J.A, Son, H.J. (2003). Prediction of expected red-light-running frequency at urban intersections. Transportation Research Record: Journal of the Transportation Research Board, 1830(1): 38-47. https://doi.org/10.3141/1830-06
[14] El-Shawarby, I., Rakha, H.A., Inman, V., Davis, G. (2006). Effect of yellow-phase trigger on driver behavior at high-speed signalized intersections. In 2006 IEEE Intelligent Transportation Systems Conference, Toronto, ON, Canada, pp. 683-688. https://doi.org/10.1109/ITSC.2006.1706821
[15] Taoka, G.T. (1989). Brake reaction times of unalerted drivers. ITE Journal, 59(3): 19-21.
[16] Chang, M.S., Messer, C.J., Santiago, A.J. (1985). Timing traffic signal change intervals based on driver behavior. Transportation Research Record, 1027: 20-30.
[17] Caird, J.K., Chisholm, S.L., Edwards, C.J., Creaser, J.I. (2007). The effect of yellow light onset time on older and younger drivers’ perception response time (PRT) and intersection behavior. Transportation Research Part F: Traffic Psychology and Behaviour, 10(5): 383-396. https://doi.org/10.1016/j.trf.2007.03.002
[18] Marisamynathan S., Vedagiri, P. (2020). Pedestrian safety evaluation of signalized intersections using surrogate safety measures. Transport, 35(1): 48-56. https://doi.org/10.3846/transport.2020.12157
[19] Al-Msari, H., Koting, S., Ahmed, A.N., El-shafie, A. (2024). Review of driving-behaviour simulation: VISSIM and artificial intelligence approach, Heliyon, 10(4): e25936. https://doi.org/10.1016/j.heliyon.2024.e25936
[20] Tsitsokas, D., Kouvelas, A., Geroliminis, N. (2023). Two-layer adaptive signal control framework for large-scale dynamically-congested networks: Combining efficient Max Pressure with Perimeter Control. Transportation Research Part C: Emerging Technologies, 152: 104128. https://doi.org/10.1016/j.trc.2023.104128
[21] Thompson, B.A. (1994). Determining vehicle signal change and clearance intervals. Institute of Transportation Engineers. https://redlightrobber.com/red/links_pdf/ITE-Determining-Vehicle-Signal-Change-Intervals.pdf.
[22] FDOT. (2002). Traffic Engineering Manual. Revised 2010. https://www.fdot.gov/traffic/trafficservices/trafficstudies.shtm/traffic-engineering-manual.
[23] Li W.J., Tan L.D., Lin, C.Y. (2021). Modeling driver behavior in the dilemma zone based on stochastic model predictive control. PLOS One, 16(2): e0247453. https://doi.org/10.1371/journal.pone.0247453
[24] FDOT. (2002). Traffic Engineering Manual. Revised 2013. https://www.fdot.gov/roadway/ds/02/istds.shtm.
[25] Park, B., Schneeberger, J.D. (2003). Microscopic simulation model calibration and validation: Case study of VISSIM simulation model for a coordinated actuated signal system. Transportation Research Record: Journal of the Transportation Research Board, 1856(1): 185-192. https://doi.org/10.3141/1856-20
[26] Park, B., Qi, H.T. (2005). Development and evaluation of a procedure for the calibration of simulation models. Transportation Research Record: Journal of the Transportation Research Board, 1934(1): 208-217. https://doi.org/10.1177/0361198105193400122
[27] Bonneson, J.A., Zimmerman, K.H. (2004). Effect of yellow-interval timing on the frequency of red-light violations at urban intersections. Transportation Research Record: Journal of the Transportation Research Board, 1865(1): 20-27. https://doi.org/10.3141/1865-04
[28] Rakha, H., El-Shawarby, I., Setti, J.R. (2007). Characterizing driver behavior on signalized intersection approaches at the onset of a yellow-phase trigger. IEEE Transactions on Intelligent Transportation Systems, 8(4): 630-640. https://doi.org/10.1109/TITS.2007.908146