Raja H. Alyaffer* | Baynah M. Almarri | Fatimah M. Alraheb | Shahd H. Alramis | Renad A. Alaboosh | Wejdan M. Alzahrani | Esra A. Alsalim | Nourah F. Alqahtani | Reem H. Alshammari
© 2025 The authors. This article is published by IIETA and is licensed under the CC BY 4.0 license (http://creativecommons.org/licenses/by/4.0/).
OPEN ACCESS
Social media generates massive amounts of data, but the sheer volume and unstructured nature of this data make it challenging to analyze and understand. Data visualization is a powerful method to graphically represent complex datasets, enabling clearer insights into public discourse. This paper introduces a web-based visualization system, AutDepViser, designed to analyze and visualize the symptoms and causes of autism and depression in Saudi Arabia. Due to the sensitive nature of clinical data, posts related to autism and depression were collected from X.com as an alternative data source. These posts were preprocessed, tokenized, and analyzed using Latent Dirichlet Allocation (LDA) to extract meaningful topics and patterns. The findings, visualized in multiple formats, reveal the most frequently mentioned symptoms and causes for both conditions. Notably, genetics was the dominant cause of depression, and vaccines the dominant cause of autism, in the collected posts. Commonly highlighted symptoms for both conditions included anorexia, communication problems, stress, and sleep issues. It also found common factors, such as the role of smart devices. The COVID-19 pandemic also emerged as a major factor, suggesting that the pandemic has led to worsening mental health issues for both autism and depression. This visualization shows key information about public attitudes, myths, and facts surrounding autism and depression. The persistent myth that vaccines are a cause of autism, for instance, highlights the need for targeted public awareness and education campaigns. In summary, these findings not only showcase the advantage of using AutDepViser as a tool for repetitively extracting valuable insights from unstructured social media information, but also emphasize the ability to help policymakers and health care practitioners with controlling misconceptions, enhancing early detection, and feedback targeted interventions for mental illness in Saudi Arabia. This includes attempts to integrate data from additional sources, improve the analysis, or work with experts to ensure alignment between the findings and what clinicians and public health are interested in.
Latent Dirichlet Allocation (LDA), data visualization, X.com (formerly Twitter), autism, depression
With the spread of the Internet and social media, it has become easy for anyone to publish and share information with others, which has led to the appearance of the term “Big Data.” Twitter is one of the most popular social networks, where users can express their problems, feelings, and opinions about health, social, and other issues [1]. Thus, there are many data that can be used, analyzed, and visualized, making the information easier to understand.
In fact, the information about healthcare or disorders shared on social media significantly influences users' perceptions, often shaped by the personal experiences people post. However, if this shared content conflicts with established medical knowledge, it can lead to confusion among users and potentially result in them following misguided advice [2].
Globally, there is a high demand for data visualization because of its importance and impact in business and research fields. Data visualization has reached high value and popularity in our lives to facilitate the understanding of Big Data by representing them graphically and helping in decision-making [3].
Numerous studies have focused on analyzing and visualizing published data related to mental disorders to gain insights into their characteristics and common symptoms. In this study [4], they examined and visualized various dimensions of individuals' social media posts, including activity patterns, vocabulary usage, psychometric attributes, and emotional indicators. Through the exploration of these dimensions, they identified several notable differences that have the potential to assist healthcare practitioners in determining the likelihood of an individual being affected by a mental disorder.
This paper presents a visualization system of some widespread disorders in the Kingdom of Saudi Arabia that have not received sufficient attention-autism and depression. These conditions are considered due to their significant impact on public health. A study conducted in Riyadh in 2022 estimated that 2.51% of children aged 2 to 4 years (equivalent to 25 per 1,000) are affected by autism disorder [5]. Additionally, depressive disorders are a major global contributor to disability and disease burden and are ranked as the fifth leading cause of death and disability in Saudi Arabia [6]. Many studies have found that there are overlapping symptoms between autism and depression [7], and depression is probably the most common symptom that occurs in autistic persons [8]. This makes clear that society needs adequate awareness about the symptoms and causes of autism and depression. Therefore, in this study we used some visualization techniques to improve the understanding of the relationship between the autism and depression from the society view.
The main goal of this paper is to develop an AutDepViser visualization system. Data from X.com (formerly Twitter) related to autism and depression in Saudi Arabia are collected. Then, the dataset is prepared and cleaned with natural language processing techniques to be analyzed with Latent Dirichlet Allocation (LDA) modeling. Finally, the results are presented with multiple data representation methods to reach the most important results related to these two diseases, such as causes, symptoms, and common shared points between them. This visualization will represent the data in easy and clear ways, so this will help the reader quickly understand the data when looking at them.
This paper offers valuable insights for analysts and the general public interested in examining content shared within community posts on X.com. By leveraging the visualizations presented in this paper, individuals can gain a clearer understanding of common symptoms and perceived causes of mental disorders from a societal perspective. Furthermore, the findings could assist the healthcare sector in identifying misinformation prevalent among the public regarding such disorders, highlighting the potential need for targeted awareness campaigns to address these misconceptions.
The remainder of this paper is arranged as follows: Section 2 presents related work on visualization systems, and Section 3 describes the developed visualization system. Results and discussions are presented in Section 4. Finally, Section 5 concludes and outlines directions for future work.
In this section, related work on visualization systems is reviewed.
Ashok et al. [9] implemented a real-time disease monitoring system. to achieve this goal, they proposed properly scraping and preprocessing tweets to detect and track diseases. Furthermore, the tweets were mapped according to geographical data in densities of the disease in question. It helps predict outbreaks of disease earlier and to prepare for them. However, unlike ours, it is a real-time system.
Kang et al. [10] also made a breakthrough in proposing coordination evaluation of multi-agent systems and proposed PG-CODE (Policy Knowledge Graph for Coordination among Government Departments), which focuses on the problem of evaluation of the coordination among the different departments of China with only limited data (up to October 2023). This coordination has been evaluated by traditional methods such as subjective manual analysis. PG-CODE used a knowledge graph to organize and interconnect information from different policy documents. The system extracted key themes for each policy using topic modeling techniques (specifically Latent Dirichlet Allocation (LDA)). This made it possible to objectively analyze coordination strength and information flow within and between different levels of governance. The validity of PG-CODE was verified by its application to analyze rural innovation and entrepreneurship policies in China. This practice enhanced our comprehension about inter-departmental collaboration, and the results are shown below. PG-CODE used LDA for the thematic analysis, but this was limited to policy evaluators. Our system, by contrast, applies LDA to analyze social media data, and explore interconnections.
Dang et al. [11] generated an analytic tool called HealthTvizer to determine health awareness in the United States using people’s tweets. The researchers applied topic modeling to detect the disease name and other information that can help in examining and exploring to take the required steps to increase understanding of public health. This system is similar to our system. While similar in applying topic modelling, our system examines the relationship between autism and depression, extending the scope beyond single-disease awareness.
Makris and Mitrou [12] presented a novel method for automatically classifying books and collections based on their subject matter. It integrated Latent Dirichlet Allocation (LDA), which identified underlying topics within the text, with a structured subject term vocabulary. By analyzing the frequency of words within book Table of Contents and their association with specific subjects, the method established probabilistic relationships between words and subjects. This allowed it to determine the likelihood of a book belonging to various subject categories. The approach was successfully applied to a large collection of Springer e-books, demonstrating its effectiveness in accurately classifying books based on their subject content. This work created an efficient and automated model for book classification using the benefit of a statistical model and a structured form of subject knowledge representation. Although this model managed to classify books appropriately, it did not attempt health-oriented data or dynamic visualization. From a modeling perspective, our study extends the applications of LDA to study societal perceptions of a mental health condition, with the benefit of actionable insights visually illustrated.
According to the study conducted by Li et al. [13], an unsupervised learning method was used to extract features of misinformation in Weibo, a popular social media in China. First of all, they applied BERT (Bidirectional Encoder Representations from Transformers) for sequence classification used to distinguish between true and false information in the dataset and were able to achieve a 100% recall rate for correctly classifying that the information is false. However, true information precision was low, with 3% precision, 6% recall, and an F1 of 6%, suggesting significant levels of misclassification. To address this, the researchers conducted a Latent Dirichlet Allocation (LDA) analysis on the misclassified true information, identifying specific features that led to incorrect classification. Additionally, social network analysis revealed the presence of structural holes within the information network. This study contributes to the understanding of misinformation detection mechanisms and provides insights into the social dynamics of information spread. The focus of this work was on information authenticity and social network dynamics. In contrast, our study applies LDA to examine health-related discourse, emphasizing the identification and visualization of key topics.
As reported by Ma and Wang [14], a semantic graph was created to discover depression symptoms. Because of privacy issues related to patients’ medical data, the authors used public tweets about depression by multiple Twitter users. They suggested an approach that combines a prediction model and natural language processing to obtain a semantic graph. The final graph can be used to create intelligent software for health professionals for depression diagnosis. This study concern about depression only, while our system concern about the depression and the autism and the relationship between them.
Lee et al. [15] demonstrated in their study that a real-time surveillance system is developed to monitor and predict seasonal diseases, such as the flu, and the distribution of other diseases, such as cancer. The data were collected from Twitter and used spatial, temporal, and text mining methods. In addition, real-time monitoring findings were visually recorded in terms of US disease surveillance charts and timelines of disease forms, signs, and therapies. The final visual results were expected to help promote quicker responses to and planning for epidemics and make better decisions. Our focus is not on real-time surveillance but on providing a web-based visualization platform to analyse and compare common symptoms and causes of autism and depression.
The findings of Stojanovski et al. [16] suggest that a visualization tool called TweetVis was developed to visualize the topic distribution in Twitter by entering any keyword. The final output is represented as a streamgraph with the help of the LDA algorithm. In our system, LDA algorithm was used but to investigate the relationship between the diseases.
Ji et al. [17] designed a monitoring system called ESMOS to show how concerned Twitter users are about multiple diseases. This system uses machine learning algorithms to classify Twitter users’ opinions about different diseases. Then, it visualizes the result as a map to determine the progression of a specific disease with the time and place.
Although previous research has made much progress in utilizing social media data to monitor, raise awareness of, and analyze health problems, there is historically limited focus on the comparison between two conditions of any type, such as autism and depression. Related works are largely limited to analyzing diseases, symptoms, or public health awareness as separate phenomena. But they do not sufficiently address overlapping conditions, nor do they provide interactive, web-based visualizations designed for comparative analysis of symptoms and causes. In addition, less focus is on using LDA to understand relationships between diseases. This disparity underscores the necessity for a system that is not just able to visualize individual disorder phenotypes, but rather able to discover possible connections between disorders to inform and aid in both public perception and health research.
This paper presents a web-based visualization system that graphically visualise the most common symptoms/causes of two common disorders, autism and depression, in different representations. Furthermore, it can discover possible overlapping symptoms and causes of both disorders based on the Latent Dirichlet Allocation (LDA) algorithm.
The way to develop the AutDepViser system, four main stages were followed:
The next subsections provide more detail on these stages.
3.1 Data collection
People in Saudi Arabia use X.com extensively to express their feelings and problems. Because of the relevant privacy regulations around clinical data that prohibit the direct gathering of patient-specific clinical notes, the dataset in this work was collected from X.com. A data mining and machine learning platform called RapidMiner, was used to collect the data. As the dataset targeted Arabic-speaking users in Saudi Arabia, various filtering criteria were utilized during the data collection process. The posts were filtered by determining the location to Saudi Arabia and the language to Arabic. This was to ensure that the dataset reflected the local and cultural context related to the discourses around autism and depression. A predefined set of appropriate keywords and hashtags describing the two disorders was applied to extract relevant posts. These included terms directly related to symptoms and causes of autism and depression, such as:
"أعراض التوحد" (Autism symptoms), "أسباب التوحد" (Autism causes)"أسباب الاكتئاب" (Depression causes), أعراض الاكتئاب"" (Depression symptoms).
The collected posts were categorized into two primary groups:
Data collection led to a dataset containing a total of 10,000 posts. In addition to ensuring our datasets included relevant and diverse data, this method demonstrated that social media platforms such as X.com could serve as a valuable source of information to study public health issues when researchers did not have direct access to clinical datasets.
3.2 Preprocessing
The collected posts included a lot of unwanted symbols, words, and irrelevant content. To ensure the dataset was suitable for analysis and visualization, a few steps of data cleaning and preprocessing were performed, as outlined below. These steps were critical in transforming raw social media data into a structured format ready for analysis.
3.2.1 Removing duplication and irrelevant posts
As a part of preprocessing, duplicate and irrelevant posts are removed from the dataset by using both automated and manual processes. An automated Python script found duplicates, then removed the duplicates. Then, manually marked and removed the irrelevant posts. This step was important to keep the collected data pertinent to the purpose of the study. In order to reduce bias in this manual cleaning process, we devised a systematic two-step strategy. First, one researcher read all the posts and flagged those that appeared to be irrelevant using criteria such as posts that never mentioned autism or depression or that focused on topics not discussed in the study. A second researcher then independently reviewed all flagged posts to validate the original decisions. That way, this two-step process helped to maintain consistency and minimize potential misjudgment or subjective biases introduced by single reviewers. This collaborative process improved the accuracy and impartiality of data cleaning, leading to a concise and accurate dataset tailored to the study scope. After this stage, the dataset size was reduced to 4,268 posts, as shown in Table 1.
Table 1. The posts collection
|
Name |
Causes |
Symptoms |
|
Autism |
1083 posts |
1095 posts |
|
Depression |
1080 posts |
1010 posts |
3.2.2 Removing stop words and symbols
Stop words are omitted since the meaning of the sentence is not changed by them, like "and," "the," or "is" [18]. In this step, the Arabic stop words were removed by using Python, by matching the posts with a stop words repository. This was performed by creating Arabic stop words libraries specifically for this study. Then, the posts matched up against this library, and the identified stop words were filtered out. In addition, undesirable symbols like URL links, mentions (e.g., @username), emojis, punctuation, and other non-textual elements were eliminated from the dataset. Using Python’s Regex module was used to eliminate these elements efficiently. This way, we were sure that the resulted dataset contained only significative content, prepared for later preprocessing, analysis, and visualization.
3.2.3 Tokenization
Tokenization refers to the process of splitting text or sentences into smaller units, called "tokens"; these could be individual words, phrases, or even characters. It is a critical step in processing text for Natural Language Processing (NLP) cases. Tokenization helps to break the text into derived tokens that algorithms can consume, typically converting sentences or paragraphs into lists of words or numbers called tokens [19]. Tokenization frequently refers to breaking down sentences into n-gram elements when dealing with Latent Dirichlet Allocation (LDA) and other NLP subjects where n-grams can be a word (uni-gram), or word sets (bi-gram, tri-gram, etc.), based on the application we are working on. The default delimiter in the TF-IDF vectorizer is space, which means that if there is white space, separate them to form single tokens. Posts were tokenized, usually at whitespace. For example, this sentence “Autism symptoms include communication issues” will be divided into tokens like [“Autism”, “symptoms”, “include”, “communication”, “issues”]. These individual tokens (which can be words, numbers, or n-grams) are then transformed into word vectors or some form of numerical representations. LDA treats these tokens in the form of word counts or TF-IDF (Term Frequency-Inverse Document Frequency) vectors, required for identifying the distribution of words to topic using numerical data, such as in the case of the LDA algorithm. Such preprocessing steps ensured a good quality dataset to build upon while also allowing for efficient use of the LDA algorithm and various visualization techniques. The system could then identify prevalent symptoms and causes of autism and depression and explore possible correlations between the two disorders, all while cutting through the noise and providing structure to the millions of unstructured data points.
3.3 Application of LDA algorithm
The LDA algorithm is a probabilistic model that can identify the main topics of the corpus. In general, LDA groups the unsupervised data into a set of clusters; and helps to find similarity in the data features. The LDA model process defines the topics’ collection of different resources by estimating the distribution of topic-term to indicate how words are distributed across topics, and document-topic that represents the share of each topic in individual documents from an unlabelled dataset by using Dirichlet priors, thereby specifying the topics’ collection of different resources. LDA uses Dirichlet priors, which allow for meaningful and organised topic representations. LDA initializes by randomly assigning words to topics and refines these assignments iteratively based on the frequency of words appearing in topics together and the contribution of each topic to each document. The process repeats itself until the assignments stabilize, which turns into the cooperating topic structure of the document collection. LDA models each document as a finite mixture over an underlying set of topics, where each topic is itself modelled as an infinite mixture over an underlying set of topic probabilities. Mathematically, LDA assumes that document-topic distributions (θ) are drawn from a Dirichlet distribution with parameter α: θ ~ Dir(α).
Similarly, topic-word distributions (φ_k) for each topic k are also drawn from a Dirichlet distribution with parameter β: φ_k ~ Dir(β).
LDA then generates words (w_n) for each document by first selecting a topic (z_n) according to the document's topic distribution (θ) and then sampling a word from the chosen topic's word distribution (φ_z_n):
z_n ~ Multinomial(θ)
w_n ~ Multinomial(φ_z_n)
This generative process allows LDA to discover latent topics and their associated word distributions within a corpus of text [20].
Since being able to do this generative process allows LDA to identify the latent topics and their corresponding distributions for words in a set of documents. LDA is a probabilistic topic modeling method that finds latent topics in a corpus by grouping words with similar semantic relationships. It is well-suited to this study. Social media posts are typically short and unstructured, making them challenging to analyse. LDA's ability to uncover latent semantic structures and reduce dimensionality enables the extraction of meaningful patterns from this type of data. Therefore, by modelling text data as mixtures of topics, LDA provides insights into the relationship between words and topics, making it easier to interpret societal perceptions of autism and depression [21].
In this stage, the principles of LDA were applied separately to the datasets of symptoms and causes using a Python library called genism. This separation allowed the algorithm to identify latent topics within each dataset independently while maintaining the capability to compare the two conditions. The model's parameters kept to default such as passes that determines the number of iterations over the corpus; typically set to 10, alpha and beta which are hyperparameters controlling topic and word distribution set to "auto" to allows the model to learn optimal values, and random_state serves as a seed. Therefore, the LDA model built with 2 topics which is the number of topics we want to extract from the dataset. where each topic contains set of words, and each word has a certain weight to the topic. Then, extracted word distributions for the two topics to identify overlapping terms or similar themes between autism and depression.
3.4 Visualization
The final stage of this research includes visualizing the results obtained from the previous stages to achieve the study's objective. An interactive web-based visualization system was developed to enhance user engagement with the data, offering a dynamic and exploratory experience. Appropriate tools used to process the dataset, incorporate model outputs, and facilitate interactive data visualization.
The system AutDepViser was implemented using Python, HTML, and CSS. It provides a twofold visualization approach:
By integrating these visualization techniques, the AutDepViser system not only provides a comprehensive view of the symptoms and causes of autism and depression but also enables the identification of commonalities between the two disorders. This approach underscores the value of interactive and interpretable visual tools in facilitating deeper insights into datasets.
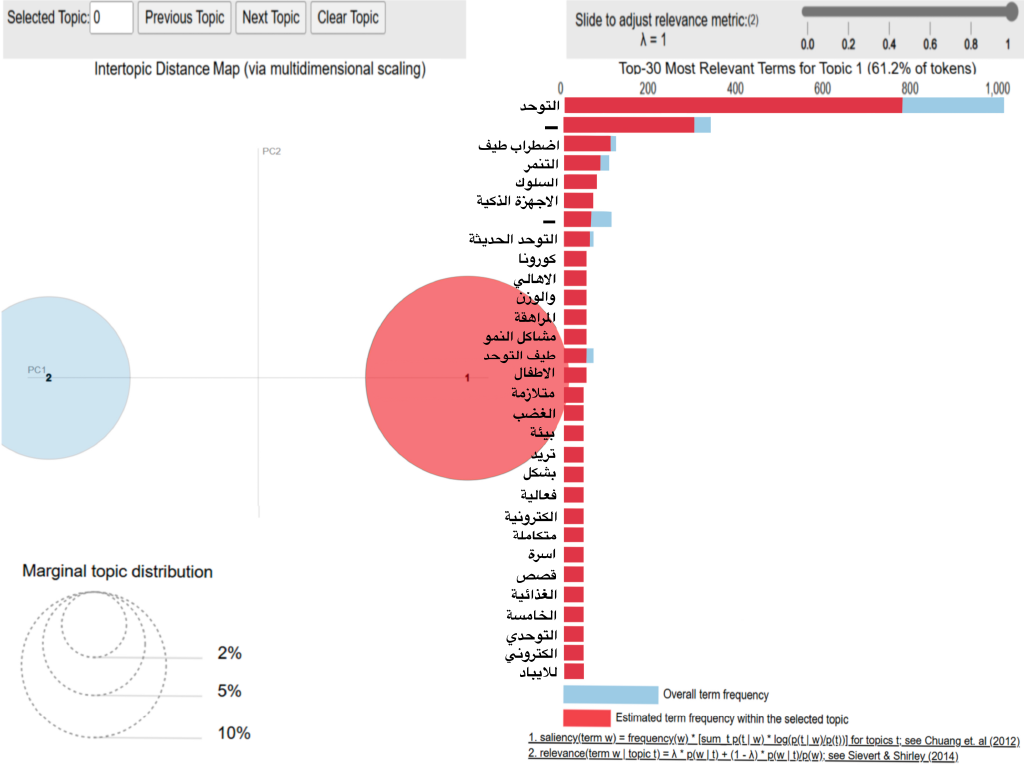
In addition, the left and right sides are connected to each other, which means that when the user selects a specific topic on the left side, the most relevant words will be shown on the right side. In addition, when the user selects a specific word on the right side, the distribution of the selected word will be shown over the topic. For example, the user can select a specific topic from the intertopic distance map on the left (in this case, Topic 1) as shown in Figure 2, and then explore the most relevant terms for that topic on the right. As a result, this connection allows the users to engage and explore the topic–term relationship in more depth.
Figure 1. AutDepViser system when using LDAvis
Figure 2. Interaction with AutDepViser system
In this section we present the results obtained from the previous phase of the study. The analysis identifying the most common symptoms and causes of autism and depression as expressed by society. Additionally, the study highlights the overlaps in societal perceptions and expressions concerning these two disorders.
4.1 Causes and symptoms of depression
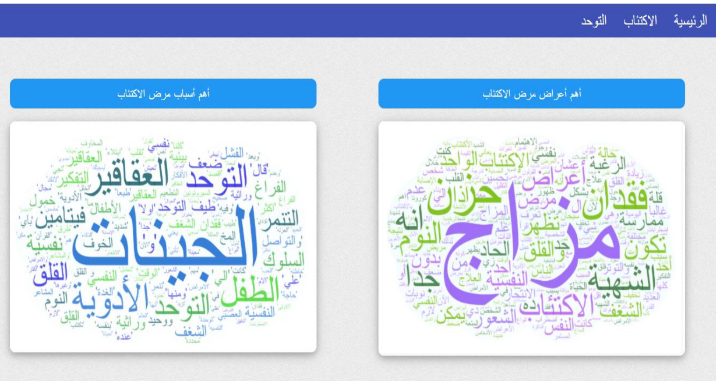
The data related to depression is visualized in a word cloud, as shown in Figure 3. The words are scaled to the frequency of words in the data. Genetics represents the most frequently word, underscoring its relevance in public perceptions. Additionally, terms such as autism and autism spectrum disorder appear in the word cloud, indicating that these conditions are also associated with depression as potential causes. Other common causes include anxiety, negative thinking habits, fear, neurotransmitter issues, and vitamin deficiencies. Moreover, the word cloud shows bipolar disorder symptoms, mood swings, and sadness being the most reported symptoms of depression. Other common words are anorexia, sleep problems (insomnia and other sleep disorders), and mania. In addition, laziness, stress, anxiety, and even suicide are also considered major signs of depression. This analysis underscores the multifaceted nature of depression, encompassing a range of psychological, physiological, and external phenomena that comprise depression with regard to how society diagnosed and expressed it. The word cloud is a good representation of these insights, which will help us understand more about how people perceive and associate with the causes and symptoms of depression. The findings underscore the importance of increasing public awareness of the nuanced intricacies of depression by addressing myths surrounding its causes and symptoms. Autism is widely recognized as a symptom of depression, which is consistent with scientific research findings, but the perception of autism as a cause that shows misunderstanding and needs to be clarified through targeted awareness campaigns. Moreover, the inclusion of other symptoms linked to depression, including sleep disturbances and anorexia, plus emotional factors such as anxiety and stress, highlights the growing necessity for a holistic approach to its diagnosis and management. Raising awareness can pave the way for early intervention and proper support that can lessen the burden of untreated depression on individuals and society as a whole.
4.2 Causes and symptoms of autism
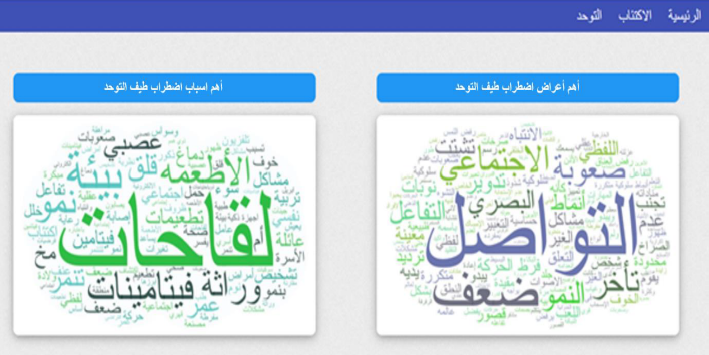
Figure 4 shows a word cloud visualization of the symptoms and causes of autism based on the perceptions expressed by Saudi society. The analysis shows several causes of autism, with vaccines emerging as the most frequently mentioned. Other significant causes include foods, the environment, genetics, vitamin deficiencies, bullying, and the use of smart devices. The prevalent attribution of vaccines as a primary cause reflects a potentially widespread misconception, as extensive scientific research has proved that there is no link between vaccines and autism [24]. This highlights the urgent need for targeted awareness campaigns to educate the public and correct such misunderstandings.
Regarding symptoms, the word cloud highlights difficulty in communication as the most commonly reported symptom, accompanied by challenges in social and visual interaction. Other notable symptoms include delayed growth, hyperactivity, distraction, fear, and a lack of expression or interaction. Additionally, individuals with autism were described as exhibiting frequent seizures, avoiding physical contact (e.g., hugs or touch), and engaging in behaviors such as screaming, word or phrase repetition, and repetitive movement patterns.
The society ensures on vaccines as a significant cause of autism underscores the importance of addressing misinformation. Public health authorities could implement evidence-based awareness initiatives to clear these myths and promote a more accurate understanding of autism.
Figure 3. Causes and symptoms of depression
Figure 4. Causes and symptoms of autism
4.3 The relationship between the causes of autism and depression
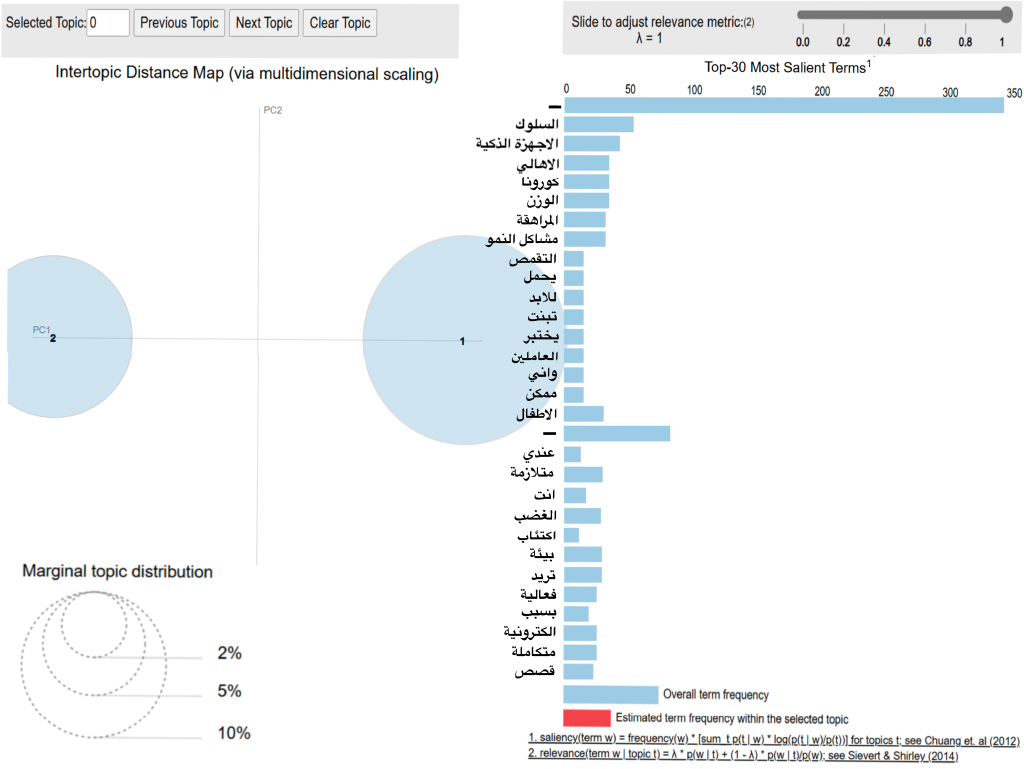
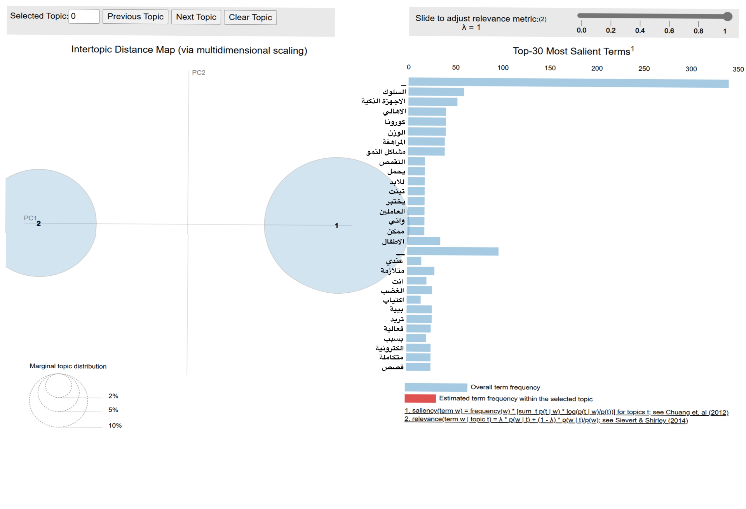
The visualization provided by LDAvis as illustrated in Figure 5, explores the relationship between depression and autism by analysing the underlying causes associated with these conditions. By applying (LDA), topics were extracted from a dataset, with the topics representing the most prevalent causes of both conditions. The interactive LDAvis tool reveals how these topics relate to each other in terms of similarity and salience.
The intertopic distance map on the left panel shows two distinct topics, labelled as Topic 1 and Topic 2, which represent different underlying causes for depression and autism. For the distance between these two topics, which is relatively large, suggesting that the causes or factors contributing to depression and autism have some notable differences. However, the presence of some overlapping terms (discussed below) indicates there are shared elements.
Moreover, both topics have fairly large circle sizes, indicating that the two topics are well-represented in the dataset.
The analysis of the top 30 most salient terms on the right panel reveals critical insights into the perceived causes of both depression and autism within society. Among the highlighted terms, smart devices (الأجهزة الذكية) emerge as most factor, indicating potential societal concerns about excessive screen time and its implications for mental health. The relationship between technology and mental health is a growing area of interest, with studies suggesting that prolonged use of electronic devices, particularly among children and adult, can exacerbate symptoms of both autism and depression by increasing isolation, reducing physical activity, and affecting sleep quality [25].
Another significant term, growth problems (مشاكل النمو), emphasizes the challenges related to physical or developmental delays. These issues are strongly linked to autism but can also contribute to depression, particularly when developmental struggles lead to low self-esteem, social rejection, or frustration. This association highlights the interplay between physical and mental health, underscoring the need for early interventions that address developmental and psychological aspects concurrently. The inclusion of Corona (كورونا) reflects the profound mental health impact of the COVID-19 pandemic. Beyond disrupting daily life, the pandemic has feelings of isolation, anxiety, and stress, which are common triggers for depression. For individuals with autism, the disruption of structured routines and limited access to support systems further intensified challenges, emphasizing the need for tailored strategies to support these populations during global crises. Additional factors such as teenage (المراهقة), families (العائلات), family workers (العاملون في الأسرة), electronics (الإلكترونيات), and anger (الغضب) provide further context. The teenage stage is a critical period marked by hormonal changes, identity formation, and increased susceptibility to mental health issues. Societal pressures, academic demands, and family dynamics during this phase may represent the impact of familial contexts and family-oriented stress on mental health outcomes. While families can be key in providing support, strained family relationships at home or an overburdened caregiver can serve as stressors, making emotional challenges persistent in individuals with autism as well as people with concurrent depression. Electronics also echo societal worries over the use of—some might argue, overuse of—digital media and how it relates to behavioral and psychological health. While electronic devices cannot be avoided in today's world, their over-reliance can lead to increased social withdrawal and reduced meaningful face-to-face interaction, especially in the younger population. Finally, anger as a salient term highlights the emotional impact of unaddressed frustrations, misunderstandings, and unmet needs that are frequently documented among people with autism and those experiencing depression. To conclude, these results highlight the complex, multifactorial nature of depression and autism influenced by individual, social, and environmental factors. Public education campaigns and targeted interventions could raise awareness, correcting societal misconceptions and driving early identification and support. Furthermore, dealing with modifiable factors like the use of technology and interactional dynamics at home, in tandem with broader systemic factors such as the impact of the pandemic, could be a major contributor to enhancing outcomes for those at risk.
Figure 5. The common points between the causes of autism and depression
4.4 The relationship between the symptoms of autism and depression
In general, the visualization explores the relationship between symptoms associated with depression and autism, and the dataset's latent topics (symptom clusters) are displayed, offering insights into how these symptoms overlap between the two conditions as indicated in Figure 6. This method allows for a deeper understanding of the shared and unique symptoms that are prevalent in individuals with depression and autism.
As observed in Figure 6, the intertopic distance map shows two distinct clusters, labelled Topic 1 and Topic 2, representing two major sets of symptoms for depression and autism. In addition, there is a moderate separation between the two clusters, indicating that while there are distinct symptom profiles for depression and autism, some overlap exists, as highlighted by shared salient terms. Regarding the topic proportions the two circles are of comparable sizes, suggesting that both sets of symptoms (depression and autism) have substantial representation in the dataset.
The most salient terms provide key insights into the primary symptoms for both depression and autism. Some of relevant terms such as depression (الاكتئاب) is one of the most frequent terms, depression can manifest in individuals with autism due to challenges with communication, social isolation, and unmet emotional needs [26]. Another significant term, sleep (النوم) disturbances are a critical symptom linked to both depression and autism. People with autism often experience irregular sleep patterns, and sleep problems are also a common symptom of depression. This suggests a shared physiological or neurological basis for sleep issues across both conditions. Moreover, the presence of psychological (النفسية) term indicates that both conditions deeply affect mental health. Emotional regulation difficulties, heightened anxiety, and stress are common psychological challenges in both autism and depression. Communication (التواصل) term is more closely associated with autism, as communication difficulties (both verbal and non-verbal) are core features of the condition. However, social withdrawal and poor communication can also be symptoms of depression, particularly in severe cases where individuals disengage from social interaction. Another symptom is anorexia (فقدان الشهية) or loss of appetite, associated with both autism and depression. In autism, sensory sensitivities may lead to selective eating, while depression often causes appetite changes, leading to weight loss or gain. Additional factor such as stress (الضغط) is a common symptom in both conditions. For individuals with autism, dealing with sensory overload, social expectations, and unfamiliar situations can lead to stress.
Figure 6. The common points between the symptoms of autism and depression
In conclusion, social media platforms have become essential channels for communities to discuss critical issues, including political, health, and educational matters. This has led to a vast amount of data being generated on these platforms. Effectively processing and analyzing such large datasets requires advanced tools, such as data visualization, which transforms complex data into intuitive, visual formats, facilitating better understanding and decision-making.
This study aimed to design a web-based visualization system to explore and visualize autism-related data and depression in Saudi Arabia based on X.com (formerly Twitter) posts. This data was analyzed using the Latent Dirichlet Allocation (LDA) model for topics after the cleaning and preparation of the dataset. The system was subsequently used to visualize the causes, symptoms, and relationships between the two conditions.
The analysis revealed several key insights into the perceived causes and symptoms of depression and autism, as reflected in social media discourse. For depression, genetics emerged as the leading cause, with symptoms such as anorexia, mood disorders, and sleep disturbances being prominently mentioned. This aligns with established research linking genetic predisposition to mental health disorders. Autism, on the other hand, was overwhelmingly associated with vaccines as a cause, reflecting a widely debated and scientifically contested narrative that underscores the need for better public awareness. The most frequent symptoms of autism included difficulties with communication and interaction, alongside developmental challenges. A significant overlap was observed between the causes and symptoms of depression and autism. Notably, the use of smart devices was highlighted as a potential contributing factor to both conditions. This raises important questions about the impact of technology on mental health. Shared symptoms between the two disorders, such as depression, anxiety, insomnia, anorexia, and grief, point to the interconnected nature of mental health conditions, emphasizing the need for a more integrated approach to diagnosis and treatment. From a broader public health perspective, these findings have several implications. The emphasis on genetics as a cause of depression underscores the importance of advancing genetic research and integrating it into personalized treatment strategies. For autism, the prevalence of vaccine-related discourse highlights the urgent need for targeted awareness campaigns to correct misconceptions and foster trust in public health initiatives. Additionally, the shared impact of technology, stress, and social factors across both conditions calls for policies that promote healthy digital habits and provide mental health support tailored to the challenges of modern living. The study’s reliance on social media data introduces certain limitations. While social media offers a rich and immediate source of public opinion, its users may not represent the broader population, and the unstructured nature of the text presents challenges in extracting nuanced insights. Additionally, cultural and regional biases inherent in the dataset may influence the perceived causes and symptoms. These limitations should guide future research toward incorporating more diverse and representative data sources, as well as employing advanced natural language processing tools for deeper analysis.
Exploring collaborative opportunities with healthcare professionals and policymakers will help translate these findings into actionable outcomes. By employing social media data to spot popular perceptions and trends, this tool could be an important resource for planning awareness campaigns, targeting mental health interventions, and shaping public health policy. Healthcare providers, for instance, might use this data to fine-tune diagnostic criteria and treatment plans, and policymakers could use it to correct misconceptions and improve resource allocation. Building on the study has the potential to help improve mental health outcomes and inform public health planning through partnerships in all sectors.
For future work, there are multiple things that could have been improved to allow the system to work better. New and improving elements, such as the application of interactive features, would help users communicate with the data in a more organized way. For example, customizable visualizations can allow viewers to filter, sort, and explore these subsets of data by topics or keywords. Such improvements would allow for a better understanding of the data, as well as more customized insights to suit the needs of various users. Moreover, including real-time capability should make this system particularly useful. This way, the system can present the latest posts, which can help in representing society better at that time. This ability is especially important for analysis of high-velocity areas of discourse, like public health emergencies and changing social norms. In the future, collaboration with psychologists, psychiatrists, neurologists, and other domain experts will be crucial to refining the categorization of the symptoms and causes. Similarly, expert input could help drive features of the system that prioritize clinically relevant findings, as well as ensure that results are consistent with established medical and scientific standards. Combined, such enhancements would make the system an invaluable resource for researchers, policymakers, and healthcare practitioners. The system has the capability to allow for more dynamic and fruitful engagement with the data, better insights into trends over time, and timely and informed decision-making, effective public health interventions, and continued research into the societal understanding of mental health and neurodevelopmental disorders.
[1] Mesk´o, B. (2013). Social Media in Clinical Practice. Springer London, UK. https://doi.org/10.4258/hir.2015.21.2.138
[2] Huber, J., Woods, T., Fushi, A., Duong, M.T., Eidelman, A.S., Zalal, A.R., Urquhart, O., Colangelo, E., Quinn, S., Carrasco-Labra, A. (2020). Social media research strategy to understand clinician and public perception of health care messages. JDR Clinical & Translational Research, 5(1): 71-81. https://doi.org/10.1177/2380084419849439
[3] Ward, M.O., Grinstein, G., Keim, D. (2010). Interactive Data Visualization: Foundations, Techniques, and Applications. AK Peters/CRC Press. https://doi.org/10.1201/9780429108433
[4] Ríssola, E.A., Aliannejadi, M., Crestani, F. (2020). Beyond modelling: Understanding mental disorders in online social media. In Advances in Information Retrieval: 42nd European Conference on IR Research, ECIR 2020, Lisbon, Portugal, Proceedings, Part I. Springer International Publishing, 42: 296-310. https://doi.org/10.1007/978-3-030-45439-5_20
[5] AlBatti, T.H., Alsaghan, L.B., Alsharif, M.F., Alharbi, J.S., BinOmair, A.I., Alghurair, H.A., Aleissa, G.A., Bashiri, F.A. (2022). Prevalence of autism spectrum disorder among Saudi children between 2 and 4 years old in Riyadh. Asian Journal of Psychiatry, 71: 103054. https://doi.org/10.1016/j.ajp.2022.103054
[6] Nour, M.O., Alharbi, K.K., Hafiz, T.A., Alshehri, A.M., Alyamani, L.S., Alharbi, T.H., Alzahrani, R.S., Almalki, E.F., Althagafi, A.A., Kattan, E.T., Tamim, H.M. (2023). Prevalence of depression and associated factors among adults in Saudi Arabia: Systematic review and meta-analysis (2000‐2022). Depression and Anxiety, 2023(1): 8854120. https://doi.org/10.1155/2023/8854120
[7] van Heijst, B.F., Deserno, M.K., Rhebergen, D., Geurts, H.M. (2020). Autism and depression are connected: A report of two complimentary network studies. Autism, 24(3): 680-692. https://doi.org/10.1177/1362361319872373
[8] Ghaziuddin, M., Ghaziuddin, N., Greden, J. (2002). Depression in persons with autism: Implications for research and clinical care. Journal of Autism and Developmental Disorders, 32: 299-306. https://doi.org/10.1023/A:1016330802348
[9] Ashok, A., Guruprasad, M., Prakash, C.O., Shylaja, S.S. (2019). A machine learning approach for disease surveillance and visualization using twitter data. In 2019 International Conference on Computational Intelligence in Data Science (ICCIDS), Chennai, India, pp. 1-6. https://doi.org/10.1109/ICCIDS.2019.8862087
[10] Kang, Y., Ou, R., Zhang, Y., Li, H., Tian, S. (2021). PG-CODE: Latent Dirichlet Allocation embedded policy knowledge graph for government department coordination. Tsinghua Science and Technology, 27(4): 680-691. https://doi.org/10.26599/TST.2021.9010059
[11] Dang, T., Nguyen, N.V., Pham, V. (2018). HealthTvizer: Exploring health awareness in twitter data through coordinated multiple views. In 2018 IEEE International Conference on Big Data (Big Data), Seattle, WA, USA, pp. 3647-3655. https://doi.org/10.1109/BigData.2018.8622445
[12] Makris, N., Mitrou, N. (2023). Multisubject analysis and classification of books and book collections, based on a subject term vocabulary and the Latent Dirichlet Allocation. IEEE Access, 11: 120881-120898. https://doi.org/10.1109/ACCESS.2023.3326722
[13] Li, Y., Wang, D., Li, X., Zhai, Y., Hon, C. (2024). Misinformation features detection in Weibo: Unsupervised learning, Latent Dirichlet Allocation, and network structure. IEEE Access, 12: 166977-166987. https://doi.org/10.1109/ACCESS.2024.3494015
[14] Ma, L., Wang, Y. (2019). Constructing a semantic graph with depression symptoms extraction from Twitter. In 2019 IEEE Conference on Computational Intelligence in Bioinformatics and Computational Biology (CIBCB), Siena, Italy, pp. 1-5. https://doi.org/10.1109/CIBCB.2019.8791452
[15] Lee, K., Agrawal, A., Choudhary, A. (2013). Real-Time disease surveillance using twitter data: Demonstration on flu and cancer. In Proceedings of the 19th ACM SIGKDD International Conference on Knowledge Discovery and Data Mining, pp. 1474-1477. https://doi.org/10.1145/2487575.2487709
[16] Stojanovski, D., Dimitrovski, I., Madjarov, G. (2014). Tweetviz: Twitter data visualization. Proceedings of the Data Mining and Data Warehouses, 1(2).
[17] Ji, X., Chun, S.A., Geller, J. (2013). Monitoring public health concerns using Twitter sentiment classifications. In 2013 IEEE International Conference on Healthcare Informatics, Philadelphia, PA, USA, pp. 335-344. https://doi.org/10.1109/ICHI.2013.47
[18] Oueslati, O., Cambria, E., HajHmida, M.B., Ounelli, H. (2020). A review of sentiment analysis research in Arabic language. Future Generation Computer Systems, 112: 408-430. https://doi.org/10.1016/j.future.2020.05.034
[19] Hedderich, M.A., Lange, L., Adel, H., Strötgen, J., Klakow, D. (2020). A survey on recent approaches for natural language processing in low-resource scenarios. arXiv Preprint arXiv: 2010.12309. https://doi.org/10.48550/arXiv.2010.12309
[20] Blei, D.M., Ng, A.Y., Jordan, M.I. (2003). Latent Dirichlet Allocation. Journal of Machine Learning Research, 3: 993-1022. https://doi.org/10.1162/jmlr.2003.3.4-5.993
[21] Pan, X., Xue, Y. (2023). Advancements of artificial intelligence techniques in the realm about library and information subject-A case survey of Latent Dirichlet Allocation method. IEEE Access, 11: 132627-132640. https://doi.org/10.1109/ACCESS.2023.3334619
[22] Heimerl, F., Lohmann, S., Lange, S., Ertl, T. (2014). Word cloud explorer: Text analytics based on word clouds. In 2014 47th Hawaii International Conference on System Sciences, Waikoloa, HI, USA, pp. 1833-1842. https://doi.org/10.1109/HICSS.2014.231
[23] Sievert, C., Shirley, K. (2014). LDAvis: A method for visualizing and interpreting topics. In Proceedings of the Workshop on Interactive Language Learning, Visualization, and Interfaces, pp. 63-70. https://doi.org/10.3115/v1/W14-3110
[24] Gabis, L.V., Attia, O.L., Goldman, M., Barak, N., Tefera, P., Shefer, S., Shaham, M., Lerman-Sagie, T. (2022). The myth of vaccination and autism spectrum. European Journal of Paediatric Neurology, 36: 151-158. https://doi.org/10.1016/j.ejpn.2021.12.011
[25] Akhtar, F., Patel, P.K., Heyat, M.B.B., Yousaf, S., Baig, A.A., Mohona, R.A., Muhamad Malik, M., Tanima, B., Bibi Nushrina, T., Li, J.P., Mohammad Amjad, K., Wu, K. (2023). Smartphone addiction among students and its harmful effects on mental health, oxidative stress, and neurodegeneration towards future modulation of anti-addiction therapies: A comprehensive survey based on SLR, Research questions, and network visualization techniques. CNS & Neurological Disorders-Drug Targets (Formerly Current Drug Targets-CNS & Neurological Disorders), 22(7): 1070-1089. https://doi.org/10.2174/1871527321666220614121439
[26] Lund-Petersen, M., Bertelsen, P. (2024). Autism and depression. Helping individuals with autism get a good enough grip on life by means of cognitive and life psychological intervention. Nordic Psychology, 76(3): 333-361. https://doi.org/10.1080/19012276.2023.2199135