Agus Mansur*![]() | Nashrullah Setiawan
| Nashrullah Setiawan![]() | Ahmad Hanif Faiz | Sri Indrawati
| Ahmad Hanif Faiz | Sri Indrawati![]()
© 2024 The authors. This article is published by IIETA and is licensed under the CC BY 4.0 license (http://creativecommons.org/licenses/by/4.0/).
OPEN ACCESS
This research addresses a gap in the existing literature by integrating value stream mapping (VSM) with system dynamics to optimize the blood donation supply chain, an area in which governments worldwide must enhance services as part of their broader health sector improvements. This study investigates the application of lean service principles to eliminate waste in the blood donation supply chain within blood banks and the Indonesian Red Cross. Specifically, this research aims to minimize the blood bag waste, shortages, and prolonged waiting times. The model is developed by first identifying waste in the existing system and then tracing the root causes of waste through fishbone analysis. The proposed model is validated using statistical testing under actual conditions. The results show that the lead time is reduced by 21%. Additionally, the results indicate that critical waste occurs primarily due to inappropriate processing and waiting. This research contributes to the field by providing a comprehensive framework for identifying and reducing inefficiencies in the blood donation process.
blood supply chain, system dynamics simulation, value stream mapping, lean service, blood bank in Indonesia
Blood is a vital component of the human body as it supplies oxygen, food, and other substances to sustain its functionality. In certain medical situations, a transfusion is needed to save lives and treat patients from various diseases and blood loss. Ideally, hospitals should have stable and sufficient bloodstock for patients in critical and emergency conditions, such as mothers experiencing bleeding after delivery or patients suffering road traffic injuries. Delays in transfusion due to the lack of blood stocks could result in mortality [1].
Blood services can be defined as human blood distribution for various humanitarian, non-commercial purposes. In Indonesia, these services are provided by the Indonesian Red Cross (IRC). Established on 17 September 1945, the Indonesian government authorized the organization to manage the national blood supply. Blood supply chain management (BSCM) regulates the long and interconnected supply chains, with stages comprising collection, production, inventory, and distribution [2]. IRC collects blood supply using the mobile and fixed location models. Mobile units visit institutions volunteering to organize blood donations, such as schools, universities, government offices, etc. Meanwhile, the fixed location model collects supplies from donors’ participation at the IRC offices.
These collection processes were disrupted by the COVID-19 outbreak in 2020 because the health sector was hit the hardest compared to the economic, education, and other social sectors. With the spread to more than 201 countries, the pandemic changed lives globally. In Indonesia alone, the death toll exceeded 15,000 cases. In such a crisis, governments in various countries curbed the spread by social distancing and implementing lockdowns. However, the Government of Indonesia chose not to implement lockdowns, fearing the devastating impact on the economy, and only opted for social distancing practices, which include forbidding crowds, keeping the 1.5-meter distance, advocating frequent hand washing, and wearing face masks. These policies to handle the outbreak have disrupted many supply chains, including a decrease in IRC’s supply. The reduction was almost even in all units in Indonesia at about 70%. This was also exacerbated by the public’s reluctance to donate blood for safety reasons.
Maintaining service quality is essential in the blood supply chain to encourage donations. However, this was difficult to achieve as the operations of IRC units were heavily affected by the movement restriction. The number of donors also declined, so meeting the local hospitals' blood demands was difficult. In this situation, strategic steps were needed to adjust the existing policies so that blood availability could be maintained under disrupted conditions. Demand for transfusion was very high due to other diseases, so more donor activities were needed. However, donors’ safety needed to be ensured by complying with the infectious disease’s prevention.
The lean service concept could be applied to improve the service quality of blood donation, especially during the pandemic. This methodology has improved operations in many sectors, including healthcare [3]. It is part of the continuous effort in various medical services, including IRC units, to reduce waste and add value service for customers [4]. Lean service is a quality improvement methodology to reduce waste that does not add value to a product or service [5] so that service quality and processes can be improved to enhance customer satisfaction. Meanwhile, system dynamics (SD) can identify critical waste efficiently and model the impact of waste on blood availability using the object-oriented simulation method. It models various wastes as feedback loops and their impacts on blood availability. In other words, SD can assess the initial conditions and the impact recommendations.
This research examines service improvements in abnormal conditions. The first step is to identify the existing wastes and provide recommendations to improve the system by providing sufficient supply. As such, the right solution to service quality improvement can be proposed. This research was conducted at Sleman IRC using the current VSM as a lean tool. The effect of the proposal from the fishbone diagram on the blood bag output was estimated using SD simulation. The main research questions are as follows: (1) What types of waste are identified that cause inefficiency? (2) What are the proposed scenarios for reducing waste by using the VSM method? To provide context for addressing these research questions, a review of previous studies was conducted, which served as a method and reference point to support and inform the research.
The rest of this paper is organized as follows: Section 2 presents the literature review. Section 3 outlines the methodology. Section 4 presents the analysis results and discussions, i.e., the comparison between the current and proposed systems. Finally, Section 5 concludes the study.
2.1 Lean services in the healthcare sector
Past studies have shown how lean service has been widely implemented in the healthcare sector [6]. Womack and Jones [7], the founder of the lean production concept, identified the opportunities for lean concept development in the health system. The lean concept in the healthcare sector is similar to the manufacturing sector, aiming to minimize waste in the process. The differences lie in the relationship between the process line and its object. In the manufacturing sector, the process line relates to the material to be processed to produce tangible products for consumption. Meanwhile, the process line of lean services in the healthcare sector is the intangible customers’ needs. These differences result in different design parameters, implementation, and performance indicators.
Previous studies have shown that lean concepts in the healthcare sector have been implemented through various methods to achieve optimal operational performance. The operational excellence of lean healthcare was measured based on the workflow efficiency and increased capacity [8, 9], added value activities, ergonomic environment [10], improved outpatient and inpatient services through an automated queuing system and facility management [11], reduced service time from the identified critical waste [12-14], continuous improvement of quality health services and patient safety [15], reduced overprocessing, and minimized unnecessary inventory and transportation waste of medical supplies to surgery rooms [16]. The various analytical methods used in previous studies include VSM, failure mood and effect analysis (FMEA), simulation model, fuzzy logic, and kaizen tools. It should be noted that studies on lean healthcare services above focused on achieving operational excellence by identifying internal challenges.
The external challenges, such as the supply chain context, must also be responded to by stakeholders to ensure that quality standards, service responsiveness, and the material supply lead time support the company’s internal business processes. Past studies have examined the supply chain in healthcare services, such as by Almutairi et al. [17], Wijewardana and Rupasinghe [18]. In the context of the COVID-19 pandemic, Yadav et al. [19] studied the inventory management of the blood supply chain. The results emphasize the importance of exploring the application of lean concepts in the healthcare supply chain. However, the applications should integrate tools of lean concepts with other methods that can solve the complexity and dynamic problems in the healthcare supply chain.
2.2 System dynamics in the healthcare sector
The application of SD simulation in the healthcare sector, from the most to the least popular, are healthcare operations, communicable diseases, non-communicable diseases, healthcare systems, healthcare processes and policies, and supply and demand in healthcare [20]. The blood supply chain falls under the supply and demand in healthcare. However, studies that involve simulation in the healthcare sector are still limited, specifically in terms of simulation comparison, hybrid modeling, and SD adoption. Among the few is the study conducted by Samuel et al. [21], which examines the implementation of the SD model in the healthcare supply chain in India. The proposed model could reduce capacity and service delays. Meanwhile, Abo-Hamad et al. [22] proposed a framework based on a simulation of lean decision support for healthcare applications. The framework stage consists of identifying, developing, and assessing the hospital ward as a case study.
In the context of the COVID-19 pandemic, Singh et al. [23] investigated the impact on the logistics systems in the food supply chain. They developed a simulation model with three scenarios to analyze the disruptions in the food supply chain. Meanwhile, Sy et al. [24] proposed an SD-based policy for a pandemic response based on the coronavirus mortality cases in Italy, Spain, Germany, France, and the Philippines. The result shows that the most effective strategies were avoiding coronavirus exposure and increasing healthcare capacities. Chatterjee et al. [25] developed a stochastic mathematical model for the analysis of the healthcare impact in India. The proposed scenarios were modeled using 1000 runs of Monte Carlo simulation on MATLAB software.
Miller et al. [26] investigated the burden on the US healthcare sector caused by the COVID-19 pandemic. Their findings highlight the importance of equitable and adequate medical care and public health resources distribution to urban and rural areas to reduce mortality rates. Ghaffarzadegan and Rahmandad [27] used the SD simulation approach to estimate the magnitude of the COVID-19 outbreak in Iran. They claimed that the methods are applicable to similar cases in other settings and could assist the government in estimating an outbreak’s magnitude in the initial stage. Penn et al. [28] developed a discrete-event simulation of a hospital general ward. The study generated a model to plan the hospital's capacity and assist healthcare planners in the UK. Currie et al. [29] proposed four main models, namely: the discrete-event simulation, agent-based modeling, SD simulation, and hybrid simulation. They identified eleven decisions to reduce the impact of COVID-19: (1) implementing quarantine strategies and case isolation, (2) implementing social distance measures, (3) managing lockdown termination, (4) delivery testing, (5) targeting vaccination, (6) measuring the capacity of hospital beds and critical care, (7) staffing, (8) managing resources, (9) investigating thresholds for admission, (10) minimizing the impact on other patients, and (11) maintaining health and well-being. Meanwhile, Griffiths et al. [30] considered the capacity of ICUs (Intensive Care Units). They proposed the discrete event simulation to simulate the bed-occupancy of the ICUs as well as monitoring any cancellations of Elective surgery.
2.3 Integration of lean service and system dynamics in the healthcare sector
Referring to prior research, the integration of concepts that are relevant to the current research includes the simulation modeling and lean management in the healthcare sector [31], the improvement of efficiency of the blood supply chain system using the Taguchi method, the SD simulation proposed by Zahraee et al. [32], the hybrid simulation model in operational research [33], and the hybrid models and simulation techniques in transdisciplinary researches [34-36]. However, considering the gap in the literature, the most relevant approach to minimize waste in the blood supply chain field is the integration between lean service and system dynamics.
2.4 Research gap and contributions
Previous blood supply chain studies have primarily focused on isolated improvements or general supply chain optimization without detailing the integration of VSM and system dynamics. While these studies have identified inefficiencies, they often need a comprehensive framework combining lean management principles with dynamic modelling techniques. Specifically, the literature needs to adequately explore how VSM can be used alongside system dynamics to address specific challenges such as blood bag waste, shortages and prolonged waiting times in the blood donation process. This gap indicates a need for a more detailed examination of how these methodologies can effectively streamline operations within blood banks and improve overall supply chain performance.
This research contributes to the field by applying VSM and system dynamics specifically to the blood supply chain at the Indonesian Red Cross. By integrating these methodologies, the study offers a novel approach to identifying and reducing inefficiencies within the blood donation process. VSM allows for the visualization and analysis of current processes to pinpoint waste. At the same time, system dynamics provides a modelling framework to simulate and predict the effects of changes within the system. This dual approach enhances the efficiency of blood supply chain operations and offers a replicable model that can be adapted for use in other regions or sectors facing similar challenges. The research provides a valuable framework for policymakers and practitioners to optimize blood donation systems and improve service delivery.
The VSM is a tool used to help visualize systems by mapping the flow of information and materials. The VSM aims to understand the flow of information and materials and the lead time of each process involved. A VSM is defined as a collection of activities, including value-added (VA) and non-value-added (NVA) activities, that are carried out to produce a product or service, or a combination of both, for the customer [22]. Data is obtained from interviews with relevant personnel and field observations.
In this study, the simulation technique used is the system dynamics approach. By using this method, the waste can be explicitly considered. In this method, different causes of waste processing can be modelled as feedback loops, and the number of blood bag stocks can be measured and their impact on blood donor services. The system dynamics approach can fully measure the different causes of waste by considering each waste's direct and indirect effects through feedback loop analysis. Developing a system dynamics simulation involves identifying and connecting the variables that affect blood donor services and then developing a Causal Loop Diagram (CLD) according to the existing conditions at the Indonesian Red Cross (PMI) in Sleman Regency. Furthermore, Root Cause Analysis (RCA) is used to comprehensively identify the root causes of waste within the blood service process at PMI Sleman Regency by thoroughly investigating potential failures. The causes of waste are further analyzed using a Fishbone Diagram, which considers five aspects: man, machine, method, material, and environment. Subsequently, the alternative improvement scenarios are based on the Fishbone Diagram and the 5 Whys, with the output being a Future VSM. Integrating system dynamics and VSM is used to assess the impact of the proposed scenarios from the fishbone diagrams, evaluating the output of blood bags produced and the waste score variables.
Data were collected from direct observation to obtain information about service activities, cycle time, number of employees, blood stocks, average donors per day, information flow in each department, and working hours. The four main stages of conducting this research are:
4.1 The existing healthcare services
4.1.1 The current VSM
This study uses VSM as a lean tool to identify waste, reduce process cycle times, and implement process improvement. Data were collected from direct observations and interviews with the relevant parties. After the data were confirmed to meet the adequacy test, the cycle time of the service processing was calculated from the average of the measurement results by multiple observations. The service cycle processing time is shown in Table 1.
Table 1. Process and cycle time of the existing system
|
No. |
Process |
Activity |
Time (Seconds) |
|
1 |
Registration |
1a. The arrival of the donor |
5.337 |
|
1b. Donors fill out the registration form |
63.232 |
||
|
1c. Donors fill out health questionnaires |
111.351 |
||
|
1d. Officers input data |
21.708 |
||
|
2 |
Preliminary examination |
2a. Donors to the checkpoint |
9.961 |
|
2b. Weight Measurement |
9.034 |
||
|
2c. Checking blood hemoglobin levels |
138.341 |
||
|
2d. Blood group check for beginners |
41.167 |
||
|
3 |
Medical examination by doctor |
3a. Donors are waiting to be examined by doctors |
92.613 |
|
3b. Anamnesis by doctor |
34.624 |
||
|
3c. Blood pressure check |
38.761 |
||
|
3d. Simple physical examination |
23.882 |
||
|
4 |
Donor blood collection |
4a. The patient goes to the donor room |
6.181 |
|
4b. Wash the donor arm |
27.741 |
||
|
4c. Blood draw |
405.889 |
||
|
4d. Blood sampling |
55.856 |
||
|
5 |
Taking donor card and vitamins |
5a. Donors are waiting for vitamins |
263.798 |
|
5b. Donors take cards and vitamins |
9.687 |
Determining the current VSM requires data from the previous stage and the classification of each activity. The data required include the service process cycle, the available time, and the VA and NVA activities. The classification of activities into value and non-value-added are presented in Table 2.
Table 2. Categories based on value added (VA), non-value added (NVA), and necessary non-value added (NNVA)
|
No. |
Process |
Activity |
VA |
NVA |
NNVA |
|
1 |
Registration |
1a |
|
|
√ |
|
1b |
√ |
|
|
||
|
1c |
√ |
|
|
||
|
1d |
√ |
|
|
||
|
2 |
Preliminary examination |
2a |
|
|
√ |
|
2b |
√ |
|
|
||
|
2c |
√ |
|
|
||
|
2d |
√ |
|
|
||
|
3 |
Medical examination by doctor |
3a |
|
√ |
|
|
3b |
√ |
|
|
||
|
3c |
√ |
|
|
||
|
3d |
√ |
|
|
||
|
4 |
Donor blood collection |
4a |
|
|
√ |
|
4b |
√ |
|
|
||
|
4c |
√ |
|
|
||
|
4d |
√ |
|
|
||
|
5 |
Taking donor card and vitamins |
5a |
|
√ |
|
|
5b |
√ |
|
|
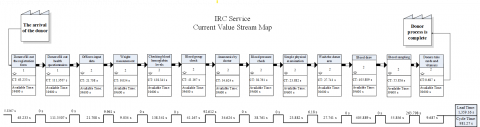
After grouping each activity and collecting the required data, the VSM of the current state of blood donor service at Sleman IRC was created, as shown in Figure 1.
From the current VSM, the percentage of processing time per activity was calculated as follows:
$\begin{aligned} & \% V A=\frac{981.27}{1359.16} \times 100=72.2 \% \\ & \% N V A=\frac{356.41}{1359.16} \times 100=26.2 \% \\ & \% N N V A=\frac{21.479}{1359.16} \times 100=1.6 \%\end{aligned}$
Next, the questionnaires were distributed to the employees to determine the critical waste in the blood donation service at Sleman IRC. Questionnaires were distributed to employees who knew more about the process. The questionnaire was distributed to seven respondents. The critical indicator is the frequency of waste in the blood donation process. The questionnaire used the Borda method. i.e., rating each type of waste and multiplying it by the appropriate weight. Rank 1 has the highest weight (n-1). The waste with the highest value means it occurred the most frequently in the blood donation process at the IRC.
Figure 1. Value stream mapping for current service of Sleman IRC
Table 3. The results of questionnaire (weight and rank)
|
Waste Type |
Rating |
Total |
Rank |
|||||||
|
1 |
2 |
3 |
4 |
5 |
6 |
7 |
8 |
|||
|
Defect |
1 |
0 |
0 |
1 |
4 |
0 |
1 |
0 |
24 |
0.12 |
|
Production |
0 |
1 |
0 |
2 |
1 |
0 |
2 |
1 |
19 |
0.09 |
|
Waiting |
2 |
3 |
0 |
1 |
1 |
0 |
0 |
0 |
39 |
0.19 |
|
Transport |
0 |
0 |
1 |
0 |
0 |
2 |
1 |
3 |
10 |
0.05 |
|
Inventory |
0 |
0 |
1 |
0 |
1 |
0 |
3 |
2 |
11 |
0.06 |
|
Motion |
0 |
0 |
1 |
3 |
0 |
2 |
0 |
1 |
21 |
0.11 |
|
Processing |
3 |
3 |
1 |
0 |
0 |
0 |
0 |
0 |
44 |
0.22 |
|
Human potential |
1 |
0 |
3 |
0 |
0 |
3 |
0 |
0 |
28 |
0.14 |
|
Weight |
7 |
6 |
5 |
4 |
3 |
2 |
1 |
0 |
196 |
|
The results of the questionnaire recapitulation are shown in Table 3. For example, the ranking calculation for the defect waste is shown in table. The weighting of the top order was assigned the value of m, which was the total number of choices minus 1. In this case, the value of m was 8 minus 1=7. The second position was assigned the value of m minus 1, and so on, until the last sequence was given a weight of 0. After obtaining the results of ranking calculations for each type of waste from the questionnaire, the next step was to multiply the numbers in the ranking column with their weight and then add the multiplication results for the same type. The calculation result was inputted in the total point column.
4.1.2 Root causes analysis
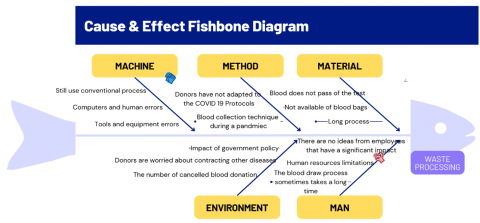
The identification results using the Borda method show that the most critical waste was from the processing. Since system improvement requires detailing its causes, the fishbone diagram was used to identify the causes of processing waste. The results are shown in Figure 2.
Figure 2. Fishbone diagram of waste processing
4.1.3 System dynamics simulation
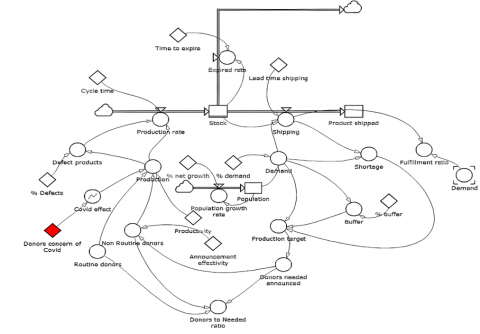
This study aims to formulate regulations to guarantee blood availability needed by the community. The regulations are targeted at internal improvement and the external factors related to the blood supply availability from donors. Using the SD approach, the first step was to build the conceptual model using a CLD. The use of VSM and Borda captured the real system. This result was strengthened with data from an in-depth interview with the blood supply management experts and the decision makers in Sleman IRC. Table 4 presents the variables identified from the interviews. The flow diagram is presented in Figure 3.
Figure 3. Flow diagram in blood existing system
The next step was to verify the flow diagram model that had been designed using Powersim Studio 9 software to ensure appropriateness and that it was free from error messages. The visual image was created to do this, as shown in Figure 3. Since the flow diagram model has no errors, it could be stated that the model has been properly verified.
Table 4. Variable identification in the blood supply chain
|
No. |
Variable Name |
Description |
Formulation |
|
1 |
Stock |
Define the number of blood inventory in PMI Sleman Regency. |
- |
|
2 |
Production rate |
Represents the production ability to produce ready to be transfused blood. |
(Production-'Defect products')/'Cycle time' |
|
3 |
Cycle time |
Time needed to do production process. |
- |
|
4 |
Production |
The number of blood bag which are ready to be produced. |
('Routine donors'+('COVID effect'*'Non Routine donors'))*Productivity |
|
5 |
COVID effect |
The magnitude of COVID-19 influence to the production rate. |
GRAPH ('Donors concern of COVID',0,1,{1,0.588,0.294,0.114,0.03,0//Min:0;Max:1//}<<1>>) |
|
6 |
Routine donors |
People who regularly do blood donor. |
|
|
7 |
Non routine donors |
People who donor their blood incidentally. |
'Donors needed announced'*'Announcement effectivity' |
|
8 |
Defect product |
The number of defect product. |
Production*'% Defects' |
|
9 |
Production target |
The planned blood production target. |
Buffer+Demand+Shortage |
|
10 |
Donor needed announced |
The number of donor which will be confirmed. |
'Production target'*1<<people/bag>> |
|
11 |
Donors to needed ratio |
Expected the number of donors ratio. |
('Routine donors'+'Non Routine donors')/'Donors needed announced' |
|
12 |
Shipping |
The number of blood shipment from PMI. |
IF(Demand>Stock,Stock,Demand)/'Lead time shipping' |
|
13 |
Demand |
The number of blood demand to PMI. |
Population*'% demand'*1<<bag/people>> |
|
14 |
Product shipped |
The number of blood shipped to PMI to fulfill demand. |
- |
|
15 |
Fulfillment ratio |
The demand fulfillment ratio. |
Shipping/Demand |
|
16 |
Shortage |
The number of unfulfilled demand. |
IF(Demand-Shipping>0<<bag>>,Demand-Shipping,0<<bag>>) |
|
17 |
Expired rate |
Rate of expired blood product. |
IF(Stock>0<<bag>>,Stock,0<<bag>>)/'Time to expire' |
|
18 |
Population |
The number of population that potentially affect the number of demand. |
- |
|
19 |
Population growth |
The population growth rate in Kabupaten Sleman area. |
Population*'% net growth' |
|
20 |
Buffer |
The inventory which aims to reduce shortage. |
Demand*'% buffer' |
Meanwhile, model validation ensures that the model created follows the real conditions or systems. Senge and Forrester [37] proposed 17 types of validity testing and classified them into three categories: (1) model structure testing, (2) model behavior testing, and (3) policy implications testing. In this research, the model structure testing was conducted using face validity from direct consultation with the experts, namely the heads of the IRC unit, quality control, quality assurance, blood service, and blood collection divisions. Meanwhile, the model behavior testing was conducted using a t-test: Two-Sample Assuming Equal Variances. The result is t-stat=0.0841, which is smaller than t-critical two-tail 2.048407. This means no difference between the real system and the model.
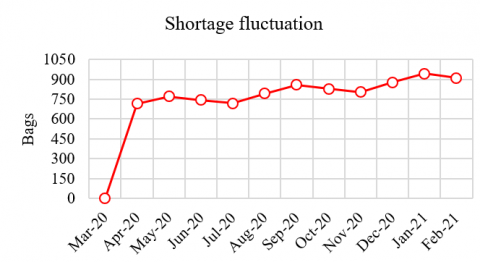
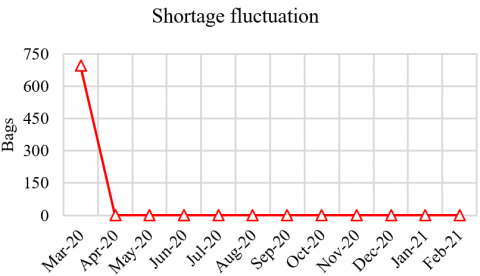
The simulation was conducted from 2020 to 2021. The results show that the shortages in blood bag availability was significant. The number of donors decreased, creating a gap in the donor and demand ratio. Figure 4 shows that Sleman IRC experienced more shortages between March 2020 and February 2021. It shows increasing trends and a sinusoid fluctuation. The low number of occasional donors caused the increasing trend of diseases and pandemic. Meanwhile, the sinusoid fluctuation was caused by the regular donors who donate every three months.
Figure 4. Shortage fluctuation of existing system
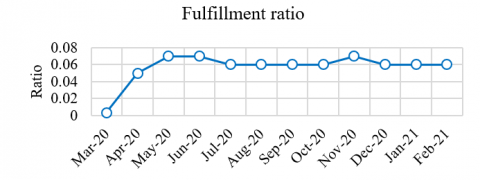
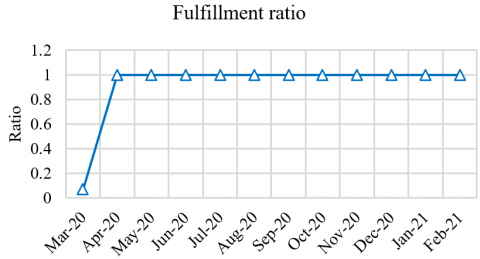
The declining number of donors dramatically affects the performance of the Sleman IRC in providing services to the community. The large order fulfillment ratio (FR) shows the ability to serve public demand. Figure 5 shows that the FR value is less than 1, indicating that the requests for blood bags were not fulfilled entirely. Policies in the blood supply chain system should be strengthened to avoid the negative impact of low supply. Since blood bags can save lives in emergencies, the low supply will lower public health services and increase mortality rates.
Figure 5. Fulfillment ratio of existing system
Data from the interviews with the experts, as shown in the fishbone diagram in Figure 2, indicate that the dominant factor affecting the amount of waste and low blood supply is the environmental factor. The results suggest that, in terms of the internal production process, the IRC in Sleman needs to reduce the blood donor processing time. This should be coupled with policies to deal with the impact of environmental factors that reduce the number of donors.
4.2 Proposed improvement
4.2.1 Future VSM
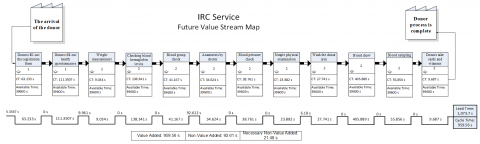
The future VSM is made based on the reduction of processing time by eliminating the non-value-added activities, as shown in Figure 6. The analysis shows that the waiting time was the activity that did not add value. Online registration by donors can eliminate the time for data input, so waiting time can be minimal. Improvement can also be made through blood donor scheduling as it can reduce crowds and streamline blood donation times. Tables 5 and 6 show the cycle time improvements, and total service time improvements, respectively.
Figure 6. Proposed value stream map of IRC service
Table 5. Process and cycle time of the proposed model
|
No. |
Process |
Activity |
Time (Seconds) |
|
1 |
Registration |
1a. The arrival of the donor |
5.337 |
|
1b. Donors filling out the registration form |
63.232 |
||
|
1c. Donors filling out health questionnaires |
111.351 |
||
|
2 |
Preliminary examination |
2a. The donor heads to the checkpoint |
9.961 |
|
2b. Weight Measurement |
9.034 |
||
|
2c. Checking blood hemoglobin levels |
138.341 |
||
|
2d. Blood group check for beginners |
41.167 |
||
|
3 |
Medical examination by doctor |
3a. Donors are waiting to be examined by doctors |
92.613 |
|
3b. Anamnesis by doctor |
34.624 |
||
|
3c. Blood pressure check |
38.761 |
||
|
3d. Simple physical examination |
23.882 |
||
|
4 |
Blood donor collection |
4a. The patient goes to the donor room |
6.181 |
|
4b. Wash the donor arm |
27.741 |
||
|
4c. Blood draw |
405.889 |
||
|
4d. Blood sampling |
55.856 |
||
|
5 |
Donor card and vitamins collection |
5a. The donor collecting a donor card and vitamins |
9.687 |
Table 6. Total time for service improvement
|
No. |
Description |
Time (Seconds) |
|
1 |
Lead time |
1,073.70 |
|
2 |
Cycle time |
959.56 |
4.2.2 Policy design
From the analysis of the existing system, the factor leading to the decline in the number of donors was the concern about disease infection. According to the expert opinion, the disease pandemic can be in at least three ways. The first is changing people’s behavior to comply with health protocols, such as wearing masks and maintaining social distancing and cleanliness. The second is increasing public education about the disease so they can still do their activities without excessive fear. The third is administering vaccines to the majority of the population to build herd immunity. If these three suggestions are applied will impact the donation activities, as shown in Table 7.
Table 7. Proposed policy improvement
|
Policy |
Health Protocol Implementation |
Improving Health Literation |
Vaccination |
Infectious Disease Concern (0-5) |
|
Initial |
|
|
|
4 |
|
Scenario 1 |
√ |
- |
- |
3 |
|
Scenario 2 |
√ |
√ |
- |
2 |
|
Scenario 3 |
√ |
- |
√ |
2 |
|
Scenario 4 |
- |
√ |
- |
4 |
|
Scenario 5 |
√ |
√ |
√ |
1 |
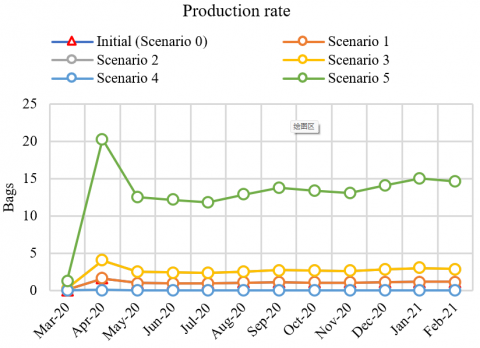
The results of simulations on the blood bag production are shown in Figure 7. The best scenario is Scenario 5, which proposes the application of strict health protocols, more intensive public education, and public vaccination simultaneously. Figures 8 and 9 show that with Scenario 5, the shortage can be reduced to 0, and the order fulfillment ratio can reach 1.
Figure 7. Production of future system based on simulation
Figure 8. Shortage of future system based on simulation
Figure 9. Fulfillment ratio of future system based on simulation
The waste identified by VSM was primarily generated by waiting times for anamnesis and donor card collection, accounting for 20% of total waste. Additionally, the critical waste identified by the Borda method was due to inadequate processing, with a percentage value of 22%. These inefficiencies were further analyzed using a fishbone diagram, highlighting five key aspects: man, method, machine, material, and environment. Among these, the environmental aspect emerged as a significant contributor to waste, mainly due to the impact of government policies. The decline in the number of donors was notably attributed to fears of virus transmission, leading to the cancellation of many donation events and deterring participants due to strict protocols and technical adjustments.
To address these issues, the proposed design for the Sleman IRC includes a future VSM that reduces non-value-added activities. This redesign reduced lead time from 1,359.16s to 1,073.70s, a 21% decrease. Moreover, the system dynamics simulation evaluated several proposed policies to mitigate blood stock shortages. The model highlighted donors' concerns about disease as the primary factor causing the shortage. Therefore, the recommended policies should focus on alleviating these concerns through enhanced safety measures and public awareness campaigns. Scenario 5, which combines lean service principles with strategic system dynamics modelling, demonstrated promising results by increasing production and eventually eliminating shortage problems. This confirms that an integrated approach using lean service and system dynamics effectively solves blood supply chain management challenges. These results show that suggestions for improvement in the future include conducting the registration process online by filling out the registration form and health questionnaire; this suggestion reduces waste caused by inappropriate processing caused by lengthy administrative procedures. One of the proposals from the scenario is the need for more implementation of 5S and inadequate waiting room, which necessitates a change in the layout of the waiting area.
One potential challenge of this research is the difficulty in accurately capturing and analyzing all variables influencing the blood donation supply chain, especially given the complex interactions between factors such as donor behaviour and policy changes. Additionally, implementing the proposed recommendations may face resistance due to organizational inertia or lack of resources, which could affect the practical application and sustainability of the suggested improvements.
Future work will benefit from extending the study by considering the availability of stocks for other emergency cases, such as bleeding in baby delivery and patients with road traffic injuries. This problem can be investigated further by using a discrete-event simulation. The proposed model can be optimized by using mathematical models, such as integer linear programming model [38].
[1] Nagurney, A., Masoumi, A.H., Yu, M. (2012). Supply chain network operations management of a blood banking system with cost and risk minimization. Computational Management Science, 9(2): 205-231. https://doi.org/10.1007/s10287-011-0133-z
[2] Osorio, A.F., Brailsford, S.C., Smith, H.K. (2015). A structured review of quantitative models in the blood supply chain: A taxonomic framework for decision-making. International Journal of Production Research, 53(24): 7191-7212. https://doi.org/10.1080/00207543.2015.1005766
[3] Mancosu, P., Nicolini, G., Goretti, G., De Rose, F., Franceschini, D., Ferrari, C., Reggiori, G., Tomatis, S., Scorsetti, M. (2018). Applying lean-six-sigma methodology in radiotherapy: Lessons learned by the breast daily repositioning case. Radiotherapy and Oncology, 127(2): 326-331. https://doi.org/10.1016/j.radonc.2018.02.019
[4] Fourie, C.J., Umeh, N.E. (2017). Application of lean tools in the supply chain of a maintenance environment. South African Journal of Industrial Engineering, 28(1): 176-189. http://doi.org/10.7166/28-1-1507
[5] Sayyida, G., Fahma, F., Iftadi, I. (2018). Process improvement in outpatient installation RSUD dr. Soediran Mangun Sumarso using lean hospital approach. IOP Conference Series: Materials Science and Engineering, 319(1): 12077. https://doi.org/10.1088/1757-899X/319/1/012077
[6] Suárez-Barraza, M.F., Smith, T., Dahlgaard-Park, S.M. (2012). Lean service: A literature analysis and classification. Total Quality Management & Business Excellence, 23(3-4): 359-380. https://doi.org/10.1080/14783363.2011.637777
[7] Womack, J.P., Jones, D.T. (2015). Lean Solutions: How Companies and Customers Can Create Value and Wealth Together. Simon and Schuster.
[8] Isaac-Renton, J.L., Chang, Y., Prystajecky, N., Petric, M., Mak, A., Abbott, B., Paris, B., Decker, K.C., Pittenger, L., Guercio, S., Stott, J., Miller, J.D. (2012). Use of lean response to improve pandemic influenza surge in public health laboratories. Emerging Infectious Diseases, 18(1): 57-62. https://doi.org/10.3201/eid1801.101485
[9] Gaur, K. (2019). Systematic and quantitative assessment and application of FMEA and lean six sigma for reducing non productive time in operation theatre of a Tertiary Care Hospital in a metropolis. Perioperative Care and Operating Room Management, 16: 100075. https://doi.org/10.1016/j.pcorm.2019.100075
[10] Adellia, Y., Setyanto, N.W., Mada Tantrika, C.F. (2014). Pendekatan lean healthcare untuk meminimasi waste di rumah sakit islam unisma Malang. Jurnal Rekayasa dan Manajemen Sistem Industri, 2(2): 292-301. https://jrmsi.studentjournal.ub.ac.id/index.php/jrmsi/article/view/83.
[11] Nancy, N., Marchaban, M., Wardani, P.E. (2014). Pendekatan lean hospital untuk perbaikan berkelanjutan proses pelayanan instalasi farmasi rumah sakit. Journal of Management and Pharmacy Practice, 4(2): 91-98. https://doi.org/10.22146/jmpf.272
[12] Ferdias, I., Budiawan, W., Susanto, N. (2017). Implementasi lean healthcare dan root cause analysis dalam mereduksi waktu pelayanan unit Rawat Jalan di rskb diponegoro dua satu klaten. Industrial Engineering Online Journal, 6(3). https://ejournal3.undip.ac.id/index.php/ieoj/article/view/16854.
[13] Nugroho, T., Fitriasari, N., Ekasari, P.A., Prasanti, I. (2019). Pengaruh waste dengan pendekatan lean hospital terhadap pengendalian biaya kualitas dan produksi. Jurnal Manajemen Kesehatan Yayasan RS. Dr. Soetomo, 5(1): 38-45. https://doi.org/10.29241/jmk.v5i1.128
[14] Tlapa, D., Zepeda-Lugo, C.A., Tortorella, G.L., Baez-Lopez, Y.A., Limon-Romero, J., Alvarado-Iniesta, A., Rodriguez-Borbon, M.I. (2020). Effects of lean healthcare on patient flow: A systematic review. Value in Health, 23(2): 260-273. https://doi.org/10.1016/j.jval.2019.11.002
[15] Terra, J.D.R., Berssaneti, F.T. (2018). Application of lean healthcare in hospital services: A review of the literature (2007 to 2017). Production, 28: e20180009. https://doi.org/10.1590/0103-6513.20180009
[16] Rosas-Hernandez, L., Tlapa, D., Baez-Lopez, Y., Limon-Romero, J., Perez-Sanchez, A. (2019). Use of lean healthcare and DMAIC to reduce waste in a public hospital. Preprints. https://www.preprints.org/manuscript/201912.0230/v2.
[17] Almutairi, A.M., Salonitis, K., Al-Ashaab, A. (2019). Assessing the leanness of a supply chain using multi-grade fuzzy logic: A health-care case study. International Journal of Lean Six Sigma, 10(1): 81-105. https://doi.org/10.1108/IJLSS-03-2018-0027
[18] Wijewardana, R.L., Rupasinghe, T. (2013). Applicability of lean healthcare in Sri Lankan healthcare supply chains. International Journal of Supply Chain Management, 2(4): 42-49. https://doi.org/10.59160/ijscm.v2i4.831
[19] Yadav, A.S., Kumar, N., Tomar, V., Pandey, T., Arunachalam, G., Swami, A. (2021). Modeling and solving an effect of COVID-19 pandemic on blood supply chain inventory management using ant colony optimization. Ilkogretim Online, 20(5). https://doi.org/10.17051/ilkonline.2021.05.148
[20] Davahli, M.R., Karwowski, W., Taiar, R. (2020). A system dynamics simulation applied to healthcare: A systematic review. International Journal of Environmental Research and Public Health, 17(16): 5741. https://doi.org/10.3390/ijerph17165741
[21] Samuel, C., Gonapa, K., Chaudhary, P.K., Mishra, A. (2010). Supply chain dynamics in healthcare services. International Journal of Health Care Quality Assurance, 23(7): 631-642. https://doi.org/10.1108/09526861011071562
[22] Abo-Hamad, W., Crowe, J., Arisha, A. (2012). Towards leaner healthcare facility: Application of simulation modelling and value stream mapping. In Proceedings of the International Workshop on Innovative Simulation for Healthcare (I-WISH), Vienna, Austria. https://doi.org/10.21427/D7G79C
[23] Singh, S., Kumar, R., Panchal, R., Tiwari, M.K. (2021). Impact of COVID-19 on logistics systems and disruptions in food supply chain. International Journal of Production Research, 59(7): 1993-2008. https://doi.org/10.1080/00207543.2020.1792000
[24] Sy, C., Bernardo, E., Miguel, A., San Juan, J.L., Mayol, A.P., Ching, P.M., Culaba, A., Ubando, A., Mutuc, J.E. (2020). Policy development for pandemic response using system dynamics: A case study on COVID-19. Process Integration and Optimization for Sustainability, 4(4): 497-501. https://doi.org/10.1007/s41660-020-00130-x
[25] Chatterjee, K., Chatterjee, K., Kumar, A., Shankar, S. (2020). Healthcare impact of COVID-19 epidemic in India: A stochastic mathematical model. Medical Journal Armed Forces India, 76(2): 147-155. https://doi.org/10.1016/j.mjafi.2020.03.022
[26] Miller, I.F., Becker, A.D., Grenfell, B.T., Metcalf, C.J.E. (2020). Disease and healthcare burden of COVID-19 in the United States. Nature Medicine, 26(8): 1212-1217. https://doi.org/10.1038/s41591-020-0952-y
[27] Ghaffarzadegan, N., Rahmandad, H. (2020). Simulation‐based estimation of the early spread of COVID‐19 in Iran: Actual versus confirmed cases. System Dynamics Review, 36(1): 101-129. https://doi.org/10.1002/sdr.1655
[28] Penn, M.L., Monks, T., Kazmierska, A.A., Alkoheji, M.R.A.R. (2020). Towards generic modelling of hospital wards: Reuse and redevelopment of simple models. Journal of Simulation, 14(2): 107-118. https://doi.org/10.1080/17477778.2019.1664264
[29] Currie, C.S., Fowler, J.W., Kotiadis, K., Monks, T., Onggo, B.S., Robertson, D.A., Tako, A.A. (2020). How simulation modelling can help reduce the impact of COVID-19. Journal of Simulation, 14(2): 83-97. https://doi.org/10.1080/17477778.2020.1751570
[30] Griffiths, J.D., Jones, M., Read, M.S., Williams, J.E. (2010). A simulation model of bed-occupancy in a critical care unit. Journal of Simulation, 4(1): 52-59. https://doi.org/10.1057/jos.2009.22
[31] Crema, M., Verbano, C. (2021). Simulation modelling and lean management in healthcare: First evidences and research agenda. Total Quality Management & Business Excellence, 32(3-4): 448-466. https://doi.org/10.1080/14783363.2019.1572504
[32] Zahraee, S.M., Rohani, J.M., Firouzi, A., Shahpanah, A. (2015). Efficiency improvement of blood supply chain system using Taguchi method and dynamic simulation. Procedia Manufacturing, 2: 1-5. https://doi.org/10.1016/j.promfg.2015.07.001
[33] Brailsford, S.C., Eldabi, T., Kunc, M., Mustafee, N., Osorio, A.F. (2019). Hybrid simulation modelling in operational research: A state-of-the-art review. European Journal of Operational Research, 278(3): 721-737. https://doi.org/10.1016/j.ejor.2018.10.025
[34] Tolk, A., Harper, A., Mustafee, N. (2021). Hybrid models as transdisciplinary research enablers. European Journal of Operational Research, 291(3): 1075-1090. https://doi.org/10.1016/j.ejor.2020.10.010
[35] Mansur, A., Vanany, I., Arvitrida, N.I. (2023). Horizontal collaboration in a decentralised system: Indonesian blood supply chain. Supply Chain Forum: An International Journal, 24(3): 334-350. https://doi.org/10.1080/16258312.2022.2161287
[36] Mansur, A., Vanany, I., Arvitrida, N.I. (2023). Improving blood bank performance in a decentralised blood supply chain using discrete event simulation. Operations and Supply Chain Management: An International Journal, 16(1): 77-96. http://doi.org/10.31387/oscm0520374
[37] Senge, P.M., Forrester, J.W. (1980). Tests for building confidence in system dynamics models. System Dynamics, TIMS Studies in Management Sciences, 14(14): 209-228. http://static.clexchange.org/ftp/documents/roadmaps/RM10/D-2926-7.pdf.
[38] Mansur, A., Handayani, D.I., Wangsa, I.D., Utama, D.M., Jauhari, W.A. (2023). A mixed-integer linear programming model for sustainable blood supply chain problems with shelf-life time and multiple blood types. Decision Analytics Journal, 8: 100279. https://doi.org/10.1016/j.dajour.2023.100279