Sukmaniar![]() | Wahyu Saputra*
| Wahyu Saputra*![]() | Monanisa
| Monanisa![]()
© 2024 The authors. This article is published by IIETA and is licensed under the CC BY 4.0 license (http://creativecommons.org/licenses/by/4.0/).
OPEN ACCESS
Digitalization in the informal sector, specifically through the use of startups, is an important phenomenon for improving sales and revenue. Palembang City has specifically experienced an increase in the development of digitalization in this sector. Therefore, this study aimed to investigate the dynamics of shifting digitalization patterns among informal sector startup users in Palembang City. A quantitative method was used with a survey as the main approach, while data were obtained through questionnaires and GPS. The sample comprised 384 respondents selected through proportional random area sampling in 18 districts of Palembang. Subsequently, data were analyzed using cross-tabulation and spatial analysis with Average Nearest Neighbor (ANN). This is a spatial analysis technique for measuring spatial proximity or geographic distribution patterns of a collection of points in an area and Getis Ord General Gi. The results showed an increase in income among users, with digitalization patterns that consistently increased over time. Moreover, startup users in the informal sector of Palembang City mostly dominated the sale of goods.
digitalization, startup users, informal sector
The population in developing countries has consistently increased over time, contributing to high unemployment rates in urban areas. This can lead to poverty and become a major challenge for economic growth [1, 2]. To address this challenge, it is crucial to provide new job opportunities, including businesses in the informal sector. However, starting a new business, specifically in a digital context, requires sufficient capital, which is often a major challenge [3, 4]. Digital technology has provided new opportunities, specifically allowing entrepreneurs to sell products and services through digital platforms at lower costs and with wider market reach. Digital entrepreneurs often exhibit compliant and collective behavior due to the use of regulated systems and applications [5]. Despite the many opportunities, entrepreneurs in the informal sector often struggle to access the capital and resources needed to leverage these technologies.
Indonesia is the 4th most populous developing country in the world and faces major challenges in providing jobs for the large workforce. The informal sector plays a crucial role in the economy, providing jobs for many who are unable to access the formal sector [6]. Palembang City, the capital of South Sumatra Province, is an example of a large city in Indonesia that has shown significant economic growth. In 2022, Palembang economy grew by 5.25%, with the accommodation and food and beverage sector experiencing the highest growth of 14.53% [7]. The food and beverage sector in Palembang, famous for its distinctive Indonesian flavors, is a major part of the city's informal sector. In addition, the clothing sector is an important part of the informal economy. The ease of marketing products using digital technology has fostered the growth of startups in the informal sector. This technology allows business actors to reach a wider market with relatively small capital, facilitating the sale of products and services online. Although digitalization has become an integral part of Palembang economy, there is still a knowledge gap regarding its pattern of development in the informal sector. Monanisa et al. [8] specifically analyzed the location of startup users in Palembang, but no study has intensively examined the dynamics of shifting digitalization patterns among informal sector startup users. It is crucial to address this gap, as understanding the dynamics can provide better insight into how the informal sector can be empowered through digital technology. The current study aimed to analyze the dynamics of shifting digitalization patterns among informal sector startup users in Palembang City. The analysis is expected to provide insight into the influencing factors and how this can be used to support economic growth in the informal sector.
Digital startups are currently an important part of the global business ecosystem, based on their fast-changing and dynamic nature [9]. Continuous innovation by business actors facilitates this change, making startups the main driver of the world economy, especially in developing countries like Indonesia [10]. Digital technology, as the foundation of the Industrial Revolution 4.0, has changed many aspects of life, specifically in the economic sector, by fostering the optimization of previously inefficient resources [11].
2.1 Digitalization and the informal sector
Previous studies have shown that digital technology can significantly increase efficiency and productivity, even in the informal sector which often lags in adopting the technology. For example, Leung and Cossu [12] stated that digitalization allows informal sector actors to access wider markets through digital platforms, typically increasing income and competitiveness. However, this study is still limited in explaining the dynamics of changes occurring in digital adoption patterns for the informal sector, specifically in large cities of developing countries. Indonesia, as one of the most populous countries in the world, has an economy dominated by the informal sector. Digital-based startups have become an important means for entrepreneurs in the informal sector to expand business with smaller capital [13]. However, Ghazy et al. [14] stated that the courage of entrepreneurs in taking risks significantly determines the success of startups. This is because the challenges faced in adopting digital technology in the sector are quite large, ranging from limited infrastructure to low digital literacy.
2.2 Spatial analysis in digitalization studies
Spatial analysis techniques, such as Average Nearest Neighbor (ANN) and Getis Ord General Gi, have been widely used in studies on the geographic distribution and distribution patterns of social and economic phenomena, including digitalization [8]. While the techniques provide important insights into the evolution of the patterns, no study has intensively examined the occurrence of these changes in a specific context, such as the informal sector in Palembang. For example, Cirolia et al. [15] showed the importance of spatial analysis to understand the dynamics of the distribution in the informal economy, while focusing less on the aspect of digitalization and the effect of technology on economic patterns.
2.3 Limitations of previous studies and contributions of this study
Previous studies have focused more on the general benefits of digitalization in the informal sector without identifying the dynamics of pattern shifts that occur over time, specifically in a spatial context. This limitation facilitates further studies that examine how digitalization changes the operational and distribution patterns of informal businesses in a specific geographic context. The current study contributed to the literature by providing an in-depth analysis of the dynamics of digitalization patterns shifts among informal sector startup users in Palembang City, utilizing spatial analysis techniques to identify the changes that occurred.
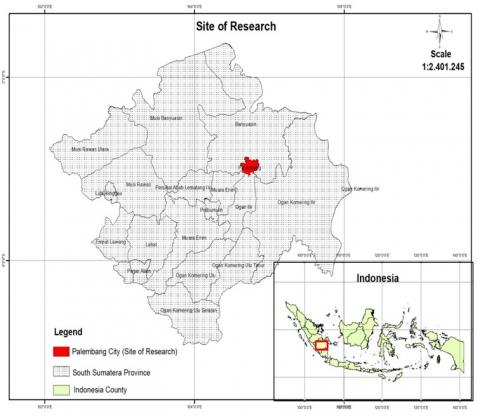
This study was conducted in Palembang City, located on the island of Sumatra, South Sumatra Province, Indonesia. Palembang is the capital city of South Sumatra Province and is one of the largest in Indonesia with a population of around 1.8 million people [7]. The city has a diverse economic structure, with the informal sector playing an important role in the daily lives of most of its residents. The informal sector in Palembang includes various types of businesses, namely food and beverage trade as well as clothing and service sales, many of which have been digitized through the use of startup technology.
Palembang City is also known as one of the economic and cultural centers in Sumatra, with quite rapid economic growth. According to BPS data, in 2022, the economy grew by 5.25%, with the accommodation and food and beverage provision sector as the main contributor, recording a growth of 14.53% [7]. The informal sector, specifically in the field of trading in typical foods such as pempek, curry martabak, and tekwan, plays an important role in the economic structure of this city.
The current study focused on the importance of the informal sector in Palembang, specifically the dynamics of digitalization that continues to grow. The increasing number of users in the informal sector shows a significant economic transformation, where digital technology is the main catalyst. Figure 1 presents a clearer picture for international readers regarding the geographical location of Palembang City.
Figure 1. Research location
This study used a quantitative method based on direct field surveys in Palembang City and was conducted for 3 months, covering 18 districts. The sample size of 384 respondents was determined based on the Krejcie and Morgan formula, designed to provide a representative estimate of a large population. With a target population of 329,392 users in the informal sector, this sample size provided a 95% confidence level with a margin of error of ±5%, hence it was considered representative of the population. Meanwhile, a proportional random area sampling technique was used, where the proportion of samples was determined based on the number of users in each district. This ensured each district was proportionally represented in the sample, and the results could be generalized to the entire city. The data were collected using 2 main tools:
1. Questionnaire: Collecting data related to the distribution of startup users, user income, and their level of digitalization.
2. GPS: Obtaining spatial data related to the location and dynamics of shifting patterns of startup users digitalization distribution.
Data were analyzed using:
1. Crosstab analysis: Evaluating the relationship between demographic variables and the level of startup users digitalization.
2. Spatial Analysis: Measuring and analyzing spatial patterns of collected data. The 2 main techniques used were Average Nearest Neighbor (ANN) and Getis Ord General Gi.
Explanation and interpretation of spatial analysis techniques:
- Average Nearest Neighbor (ANN): This technique was used to determine whether the spatial distribution of users was random, centralized, or dispersed. It also measured the average distance from each point (startup user) to the nearest point, using the following formula:
The Average Nearest Neighbor ratio is given as:
$A N N=\frac{\bar{D} O}{\bar{D} E}$ (1)
where, $\bar{D} o$ is the observed mean distance between each feature and its nearest neighbor:
$\bar{D} o=\frac{\sum_{i=0}^n d_i}{n}$ (2)
and $\bar{D} E$ is the expected mean distance for the features given in a random pattern:
$\bar{D} E=\frac{0.5}{\sqrt{n / A}}$ (3)
In the above equations, $d_i$ equals the distance between feature i and its nearest neighboring feature, n corresponds to the total number of features, and A is the area of a minimum enclosing rectangle around all features, or it’s a user-specified Area value.
The average nearest neighbor z-score for the statistic is calculated as:
$Z=\frac{\bar{D} o-\bar{D} E}{S E}$ (4)
where,
$S E=\frac{0.26136}{\sqrt{n^2 / A}}$ (5)
- Getis Ord General Gi: This technique identified areas with high (hot clusters) or low (cold clusters) levels of spatial association using the following formula:
The Getis Ord General Gi* formula is as follows:
The General G statistic of overall spatial association is given as:
$G=\frac{\sum_{i=1}^n \sum_{j=1}^n w_{i, j} x_i x_j}{\sum_{i=1}^n \sum_{j=1}^n x_i x_j}, \forall j \neq i$ (6)
where, xi and xj are attribute values for features i and j, and $w_{i,j}$ is the spatial weight between features i and j. n is the number of features in the dataset and $\forall j \neq i$ indicates that features i and j cannot be the same feature.
The zG –score for the statistic is computed as:
$Z_G=\frac{G-\mathrm{E}[G]}{\sqrt{\mathrm{V}[G]}}$ (7)
where,
$\mathrm{E}[G]=\frac{\sum_{i=1}^n \sum_{j=1}^n w_{i, j}}{n(n-1)}, \forall j \neq i$ (8)
$\mathrm{V}[G]=\mathrm{E}\left[G^2\right]-\mathrm{E}[G]^2$ (9)
- Interpretation in the context of the study: ANN was used to analyze whether the distribution pattern of users showed a tendency to form clusters or spread randomly. Meanwhile, Getis Ord General Gi was used to identify specific locations that showed high or low startup activity, crucial in understanding the spatial dynamics of digitalization in the informal sector.
5.1 Distribution of users
Palembang comprised 18 subdistricts, including Alang-Alang Lebar, Bukit Kecil, Gandus, West Ilir I, West Ilir II, East Ilir I, East Ilir II, East Ilir III, Jakabaring, Kalidoni, Kemuning, Kertapati, Plaju, Sako, Seberang Ulu I, Seberang Ulu II, Sematang Borang, and Sukarami. However, informal sector startup users were not evenly distributed across these areas, as some subdistricts tended to have a higher concentration of businesses. The distribution of users in Palembang is shown in Table 1 below:
Table 1. Distribution of users in Palembang City
|
No. |
Subdistricts |
Percentage of Business Types (%) |
Total |
|
|
Goods |
Services |
|||
|
1. |
Alang-Alang Lebar |
4.1 |
0.0 |
3.9 |
|
2. |
Bukit Kecil |
1.4% |
5.6% |
1.6% |
|
3. |
Gandus |
1.6% |
0.0% |
1.6% |
|
4. |
West Ilir I |
10.9% |
0.0% |
10.4% |
|
5. |
West Ilir II |
6.0% |
5.6% |
6.0% |
|
6. |
East Ilir I |
1.1% |
5.6% |
1.3% |
|
7. |
East Ilir II |
5.5% |
5.6% |
5.5% |
|
8. |
East Ilir III |
3.8% |
0.0% |
3.6% |
|
9. |
Jakabaring |
6.6% |
11.1% |
6.8% |
|
10. |
Kalidoni |
5.2% |
22.2% |
6.0% |
|
11. |
Kemuning |
5.2% |
22.2% |
6.0% |
|
12. |
Kertapati |
2.7% |
11.1% |
3.1% |
|
13. |
Plaju |
3.3% |
0.0% |
3.1% |
|
14. |
Sako |
9.8% |
0.0% |
9.4% |
|
15. |
Seberang Ulu I |
12.8% |
11.1% |
12.8% |
|
16. |
Seberang Ulu II |
10.9% |
22.2% |
11.5% |
|
17. |
Sematang Borang |
2.2% |
0.0% |
2.1% |
|
18. |
Sukarami |
4.4% |
0.0% |
4.2% |
|
|
Total |
100.0% |
100.0% |
100.0% |
The distribution of startup users in the informal sector in Palembang City showed an uneven pattern among the 18 districts. Seberang Ulu I, Seberang Ulu II, West Ilir I Districts, and Sako recorded a higher percentage of users, while other districts had a lower distribution. This uneven distribution could be attributed to several factors. For instance, Seberang Ulu I and Seberang Ulu II had relatively better access to infrastructure and transportation, facilitating informal entrepreneurs to access markets and resources [16]. In addition, the presence of large traditional markets in this area could increase more goods-based businesses than services [17]. West Ilir I and Sako, which also recorded a high percentage of users, were rapidly developing areas with growing populations, providing an attractive market for new businesses [18]. On the other hand, Kalidoni, Kemuning, and Kertapati, focusing more on services, showed a strong local demand for services rather than physical products. This could be attributed to the demographic characteristics of the area, where there was a high need for personal or communities services [19]. This result was in line with previous studies, where the distribution of informal businesses tended to be concentrated in areas with better infrastructure and easier market access [20]. However, differences in the types of businesses dominating across districts added a new dimension to the understanding of the dynamics of digitalization in the informal sector.
The current study provided more insights by analyzing key differences in business type preferences (goods vs. services) across regions [21, 22]. The results had important implications for sustainable development policies and practices. For instance, the concentration of users in certain districts suggested the need for more targeted policies to support a more equitable distribution of economic opportunities across the city. Local governments could consider improving infrastructure and access to technology in districts with low startup adoption rates while supporting startup ecosystems in high-growth districts to strengthen local economies [23]. In the context of sustainable development, it was important to ensure that the development of startups in the informal sector not only contributes to economic growth but also supports social and environmental inclusion. For example, fostering sustainable service businesses in Kalidoni and Kemuning could make a significant contribution to achieving sustainable development targets, specifically in terms of poverty reduction and job creation [24].
5.2 Income of users
Income data obtained from a 2023 field survey were analyzed using cross-tabulation with income scale categories ranging from the first level, Rp. 100,000 - Rp. 250,000/day, the second, Rp. 250,000 - Rp. 500,000/day, the third, Rp. 500,000 - Rp. 750,000/day, the fourth, Rp. 750,000 - Rp. 1,000,000/day, and the fifth, > Rp. 1,000,000/day. These categories were further classified based on the type of goods and services. The results of cross-tabulation analysis are presented in Table 2 below.
The results of a startup survey users income in the informal sector of Palembang City in 2023 showed that the majority of users were engaged in the goods business sector at 95.4%, while only 4.7% were engaged in the services sector. The highest average daily income ranged between IDR 250,000 and IDR 500,000, with a percentage of 32.3%, while the lowest ranged between IDR 500,000 and IDR 750,000 with a percentage of 7.8%. The highest average daily income showed that small businesses in the informal sector had succeeded in utilizing digital technology to expand market and increase operational efficiency [25, 26]. The majority of businesses generating the highest income were in the goods sector, due to the higher public need for physical products compared to services [8]. The increase in income was also supported by a previous study, where digitalization could be a major driver in improving the performance of small businesses through wider market access and lower marketing costs [27].
Table 2. Income of users by business type
|
No. |
Income of Users |
Business Type |
Total (%) |
|
|
Goods (%) |
Services (%) |
|||
|
1. |
Rp. 100.000 – Rp. 250.000 per day |
22.7 |
0.8 |
23.5 |
|
2. |
Rp. 250.000 – Rp. 500.000 per day |
30.2 |
2.1 |
32.3 |
|
3. |
Rp. 500.000 – Rp. 750.000 per day |
7.8 |
0 |
7.8 |
|
4. |
Rp. 750.000 – Rp. 1.000.000 per day |
14.7 |
0.7 |
15.4 |
|
5. |
> Rp. 1.000.000 |
20 |
1 |
21 |
|
|
Total (%) |
95.4 |
4.7 |
100 |
Based on analysis, the adoption of digital technology during the COVID-19 pandemic had a significant positive impact on the income of small and medium businesses, specifically in the informal sector [28, 29]. According to Krisdiyawati et al. [30], digitalization plays an important role in maintaining and increasing income in the informal sector during the economic crisis. The study also found that income from service businesses was relatively lower, due to the limited accessibility of services compared to physical products in the local market. The results provided a deeper insight into the differences in the impact of digitalization between different businesses, which have not been widely discussed [26, 31]. Furthermore, these results had important implications for economic and social policies, in the context of sustainable development. Higher incomes among users suggested that digital technology could be an effective tool for poverty reduction and economic inclusion in the informal sector [28]. However, more specific interventions were needed to support service businesses and effective usage of digital technologies through training and access to more inclusive digital platforms. The government also needed to consider policies that foster the use of environmentally friendly technologies in small business operations, ensuring increased incomes do not come at a high environmental cost [29]. Therefore, the adoption of technology in the informal sector not only contributes to economic growth, but also to sustainable development.
5.3 Forms of transactions and digital media used by informal sector startup users in Palembang City
The digitalization of users was analyzed based on field results, focusing on transaction forms and digital media used. Transactions in the sales activities of users were categorized into online and a combination of online and offline transactions. Digitalization forms are elaborated as following Table 3:
Table 3. Transaction forms of users
|
No. |
Transaction Forms |
Business Type |
Total (%) |
|
|
Goods (%) |
Services (%) |
|||
|
1. |
Online |
0 |
0 |
0 |
|
2. |
Online and Offline |
95,3 |
4,7 |
100 |
|
|
Total |
95,3 |
4,7 |
100 |
Field data showed that all users, both in the goods and services business conducted transactions through a combination of online and offline. This was evident in the sales presentation percentage of 95.3% for goods, while services accounted for 4.7%.
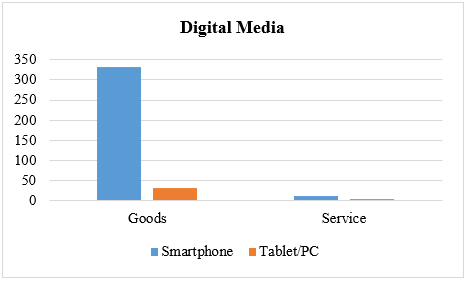
The significant changes largely influenced by the positive impact of the COVID-19 pandemic have been noted in the era of Society 5.0. It has compelled people to carry out activities online. This was supported by Hartono et al. [21], stating that people increasingly embraced online shopping, often referred to as e-grocery shopping or e-commerce [32]. The rapid growth of e-commerce in recent years has had a profound impact on the retail industry [33], with the usage becoming pervasive. Many activities have transitioned from old paradigms to new ones, spanning work, academics, and even shopping. The most convenient means of adapting to these online activities is through the use of mobile devices, particularly smartphones. Most people have become accustomed to fulfilling daily needs through online shopping, resulting in a greater number of users in the goods-selling sector compared to services. Based on field data, the most commonly used digital media for sales of users can be categorized into two, namely smartphone and tablet/PC usage (Figure 2). Digitalization forms are presented as follows:
Figure 2. Use of digital media by users based on business type
Technology plays a crucial role in meeting human needs [34], and eases interaction among individuals. In the era before technological innovations, individuals had to physically visit stores or supermarkets to procure daily needs. However, in the contemporary world, smartphone facilitates shopping from home and direct delivery of items. The most user-friendly digital medium for users to market businesses is a smartphone. This was significantly evident in field data, which showed a higher prevalence of smartphone usage compared to tablet/PC for both goods and services. According to Mograbi [35], people tend to behave more impulsively when using a smartphone compared to a tablet. Bian [36], Ong et al. [37], and Wiścicka-Fernando [38] described how the COVID-19 pandemic transformed behavior, leading to increased smartphone usage for daily activities, namely shopping on e-commerce platforms. Specifically, smartphone usage for businesses in the category of goods was at 86.7%, and service-based businesses were at 3.3%. Tablet/PC usage for goods-based businesses, on the other hand, was at 8.7%, and service-based businesses at 1.3%. In this context, the dominance of smartphones was due to the ease of use and affordability, particularly for users in Palembang. While some countries have witnessed fluctuations in e-commerce usage trends [39], there has been a global upsurge in smartphone usage since the onset of the COVID-19 pandemic in 2019 [40-44].
Smartphones have become an inseparable necessity for people. Nowadays, transactions are slowly moving towards digital transactions. There is almost no one who does not have a smartphone, ranging from cheap or affordable smartphones to expensive ones sold on the market. Palembang, as the capital of South Sumatra Province, is the economic center of South Sumatra; indeed, there will be many digital transactions carried out daily by people. Therefore, digital technology must inevitably be mastered by them because one-day transactions may be carried out digitally, especially for those who are used to mobile banking or e-money.
The rapid advancement of technology has consistently reshaped human thinking and lifestyles. Also, technological development has proven the significance of enhancing human resources to harness the most of technology. The same applies to users aiming to remain competitive in the ever-evolving economic market. Field analysis indicated a pressing need to train users, enhance knowledge, and meet market demands. These results had important implications for informal sector development policies in Palembang. Policies supporting the use of digital technology should include training to improve the digital capacity of small business actors [34]. In addition, efforts were required to reduce digital divide by providing wider access to affordable digital devices and platforms. These policies would not only increase the competitiveness of small businesses in the local market but also contribute to sustainable development by strengthening economic inclusion in the informal sector [44].
5.4 The existence of startup users in Palembang City
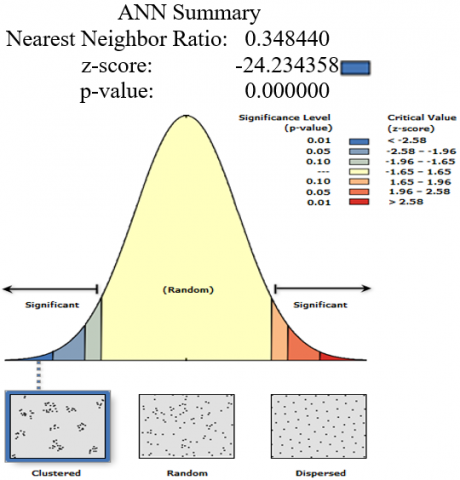
The presence of users in Palembang can be analyzed using the Average Nearest Neighbor (ANN) as a tool for determining whether spatial patterns are clustered, random, or dispersed. According to Pratamasari et al. [45], ANN can be used to calculate the distance between locations and the nearest neighbor to observe distribution patterns. This perspective was consistent with Nas et al. [46], who stated that analysis of the nearest neighbor could offer insights into the distribution pattern of location points by calculating distances between points, the total number of points, and the area. This is often referred to as the Nearest Neighbor Algorithm (NNA) in spatial analysis tools. The spatial analysis is presented in Figure 3.
Figure 3. ANN summary of users
Given the z-score of -24.2343584112, there is a less than 1% likelihood that clustered pattern could be the result of random chance.
|
Observed Mean Distance: |
135.7438 Meters |
|
Expected Mean Distance: |
389.5764 Meters |
|
Nearest Neighbor Ratio: |
0.348440 |
|
z-score: |
-24.234358 |
|
p-value: |
0.000000 |
|
Average Nearest Neighbor Summary |
|
|
Input Feature Class: |
Startup User |
|
Distance Method: |
EUCLIDEAN |
|
Study Area: |
229475933.587304 |
|
Selection Set: |
False |
|
Dataset Information |
|
The results of spatial analysis through ANN showed that the distribution pattern in 2023 significantly indicated a z-score value of -24.234358, which was less than -2.58, with a p-value of 0.01. This analysis led to the conclusion that distribution pattern, based on ANN analysis, exhibited a clustered pattern. This was because startup users market had started to shop both online and offline, making transactions easier. The ease of searching for goods and making payments online was inseparable from the Internet [47]. The internet is highly valuable, facilitating various economic activities, both trade and services. The communities started shopping online in the 21st century, feeling more comfortable and saving time, extending even to the younger generation. Currently, there are more choices for digital payments [48]. The communities' habitual patterns in online shopping showed positive values in Indonesia [49], with the majority shopping online due to convenience and revisiting for basic life needs. Another support provided by e-marketers in attracting the communities to shop online was by offering cheaper prices [50]. Communities accustomed to cheap prices, increasingly chose online shopping rather than offline to meet daily needs. These results had important implications for urban development policies, in the context of sustainable development.
Local governments could consider strengthening digital infrastructure in areas not being reached by promoting equitable development of startups throughout Palembang. This was in line with sustainable development strategies, facilitating economic inclusion and reducing the digital divide between urban and suburban areas [48]. Policies that support the expansion of digital infrastructure throughout the city and in suburban areas, could help expand the market and increase the competitiveness of local startups. In addition, the promotion of digital payments or transactions should be continued, given that consumers purchasing patterns increasingly moving toward e-commerce provide convenience and more competitive prices [50]. This could increase the accessibility of startup services to the wider communities, supporting more inclusive and sustainable economic growth.
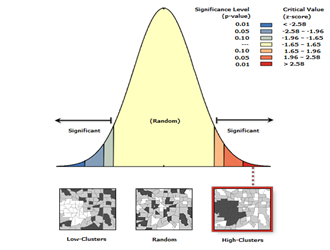
5.5 The shift dynamics in digitalization distribution pattern of users
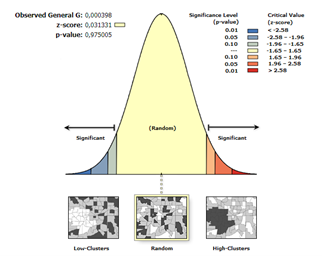
Spatial distribution patterns can be analyzed using the Getis Ord General Gi tool in a spatial information system application [51]. The dynamics in digitalization distribution pattern of users, as shown by the Getis Ord General Gi spatial analysis have experienced a shift compared to previous years. The results obtained from 2021 and 2022 showed a random pattern, while a 2023 field study showed a clustered pattern (Figure 4). This shift is detailed in the graph below:
(a) Study results in 2021-2022
(b) Study results in 2023
Figure 4. The dynamics in digitalization distribution pattern of users
The data above depict the shift dynamics in the digitalization distribution pattern of users. In 2021-2022, the pattern determined through the Getis Ord General Gi spatial analysis exhibited a random pattern with a z-score of 0.03 [8]. This was largely influenced by the impact of the COVID-19 pandemic, which consistently influenced behavior to sell and shop from diverse locations. This factor played a significant role in shaping the random distribution pattern, as buyers and sellers felt safer and more comfortable [52, 53] conducting online transactions without physical contact.
Meanwhile, the pattern in previous years differed from the current one. According to a study conducted in 2021 and 2022, distribution pattern remained random as people predominantly preferred online shopping and were comfortable staying at home. This was in line with Nurrachmi and Saripudin [22], stating that the COVID-19 pandemic influenced changes in shopping behavior by reducing direct physical contact [54]. The shift in behavior after the COVID-19 pandemic has led to a change in distribution pattern observed in the 2023 study. Consequently, people feel safe, comfortable, and eager to break the monotony of staying at home by engaging in outdoor shopping activities.
The field data results in 2023 showed that the distribution pattern in the digitalization of informal sector startup users in Palembang City formed high clusters, with a significant value of 9.14. It was also evident that some sellers and buyers had reverted to the habit of meeting face-to-face. Physical interaction is perceived as more cost-effective, quicker, and often results in faster sales. On the other hand, online sales are used to complement additional sales or for specific order quantities. Some people consistently find it convenient to use this method. In essence, current users incorporate both online and offline transactions to cater to all market segments. This shift had a significant impact on the income, which continued to increase significantly and form high clusters in specific website-based shopping centers.
The change in distribution pattern had important implications for policy-making in Palembang City. For instance, with the formation of digitalization clusters in several areas, the government should consider the distribution of digital and physical infrastructure evenly to prevent economic disparities between the city center and the outskirts. Policies that support infrastructure development in underdeveloped areas, as well as training in the use of digital technology for startup entrepreneurs in the informal sector, could help create equality and support sustainable development goals. The Palembang City Government should consider policies that foster the development of new digital economy centers in suburban areas to reduce pressure on rapidly developing areas. In addition, investment in digital and physical infrastructure, as well as digitalization training programs for small businesses in the informal sector, could ensure the sustainability of digital economic growth in Palembang. This might also help support the competitiveness of startups in various regions and create a more inclusive ecosystem for economic growth in the city.
In conclusion, this study showed an increase in income among informal sector startup users in Palembang City, facilitated by the digitalization process that consistently grew over time. The use of digital media such as smartphones that were cheap, easily accessible, and simple to use, also facilitated the adoption of technology among informal business actors. However, the main characteristics of the users were still dominated by the sale of goods, with service businesses not showing significant growth. Changes in communities behavior after the COVID-19 pandemic in Palembang had a substantial impact on the distribution pattern of digitalization. Spatial analysis using the Average Nearest Neighbor (ANN) method identified a clustered pattern in the distribution of users. For instance, the shift in the pattern from a random distribution in 2021 to a highly clustered distribution in 2023 showed the communities' adaptation to new normal situation, where some chose to return to offline shopping, while others remained comfortable with online shopping.
Based on these results, policymakers should consider developing a more equitable digital infrastructure, specifically to support service businesses in the informal sector. In addition, efforts to empower and educate digital service business actors should be improved, facilitating competitiveness in the digital ecosystem. This study had few limitations, namely the data used were collected during the period 2021 to 2023 and focused on the Palembang City area. It also focused more on the spread of digitalization without exploring other factors such as macroeconomic conditions and government policies that could affect the results. Therefore, future studies were recommended to expand the geographical scope and analysis period to understand broader trends. An in-depth study of external factors such as government policies, economic trends, and technological innovations influencing the adoption of digitalization in the informal sector was also needed to provide a more comprehensive insight.
The research team would like to thank Kementerian Pendidikan, Kebudayaan Riset dan Teknologi Republik Indonesia for providing financial assistance for the research results publication and dissemination with the 2023 Regular Fundamental Research scheme.
[1] Lismana, A.I., Sumarsono, H. (2022). Analysis of the effect of population growth, human development index and unemployment rate on poverty in West Java Province 2017-2020. Jurnal Ekonomi Pembangunan, 20(01): 88-97. https://doi.org/10.22219/jep.v20i01.20286
[2] Muhyiddin, M., Nugroho, H. (2021). A year of COVID-19: A long road to recovery and acceleration of Indonesia’s development. Jurnal Perencanaan Pembangunan: The Indonesian Journal of Development Planning, 5(1): 1-19. https://doi.org/10.36574/jpp.v5i1.181
[3] Andersson, K., Dickin, S., Rosemarin, A. (2016). Towards “sustainable” sanitation: Challenges and opportunities in urban areas. Sustainability, 8(12): 1289. https://doi.org/10.3390/su8121289
[4] Cavallo, A., Ghezzi, A., Dell’Era, C., Pellizzoni, E. (2019). Fostering digital entrepreneurship from startup to scaleup: The role of venture capital funds and angel groups. Technological Forecasting and Social Change, 145: 24-35. https://doi.org/10.1016/j.techfore.2019.04.022
[5] Prasetyo, E.H. (2022). Legitimacy building of digital platforms in the informal economy: Evidence from Indonesia. Journal of Entrepreneurship in Emerging Economies, 14(6): 1168-1187. https://doi.org/10.1108/JEEE-02-2021-0073
[6] Zubaidi, N., Pratamab, R.G., Al-Fatih, S. (2020). Legal perspective on effectiveness of pre-work cards for Indonesian people. Bestuur, 8(1): 9-18. https://doi.org/10.20961/bestuur.v8i1.42722
[7] BPS. (2022). Statistik Daerah Kota Palembang 2022. In Badan Pusat Stastik Kota Palembang.
[8] Monanisa, M., Aryaningrum, K., Kurniawan, A., Pitoyo, A.J., Sukmaniar, S., Saputra, W. (2022). Spatial analysis of startup user locations and its accuracy values using spatial data modeling, Palembang City, Indonesia. Indonesian Journal of Geography, 54(3): 359-364. https://doi.org/10.22146/ijg.70537
[9] Tajpour, M., Hosseini, E., Mohiuddin, M. (2023). Effects of innovative climate, knowledge sharing, and communication on sustainability of digital start-ups: Does social media matter? Journal of Open Innovation: Technology, Market, and Complexity, 9(100053): 1-13. https://doi.org/10.1016/j.joitmc.2023.100053
[10] Kemell, K.K., Nguyen-Duc, A., Suoranta, M., Abrahamsson, P. (2023). StartCards — A method for early-stage software startups. Information and Software Technology, 160(107224): 1-16. https://doi.org/10.1016/j.infsof.2023.107224
[11] Trevisan, A.H., Lobo, A., Guzzo, D., de Vasconcelos Gomes, L.A., Mascarenhas, J. (2023). Barriers to employing digital technologies for a circular economy: A multi-level perspective. Journal of Environmental Management, 332: 117437. https://doi.org/10.1016/j.jenvman.2023.117437
[12] Leung, W.F., Cossu, A. (2019). Digital entrepreneurship in Taiwan and Thailand: Embracing precarity as a personal response to political and economic change. International Journal of Cultural Studies, 22(2): 2 64-280. https://doi.org/10.1177/1367877918821234
[13] Saad, J., Martinelli, S., Machado, L.S., de Souza, C.R.B., Alvaro, A., Zaina, L. (2021). UX work in software startups: A thematic analysis of the literature. Information and Software Technology, 140(106688): 1-17. https://doi.org/10.1016/j.infsof.2021.106688
[14] Ghazy, N., Ghoneim, H., Lang, G. (2022). Entrepreneurship, productivity and digitalization: Evidence from the EU. Technology in Society, 70(102052): 1-15. https://doi.org/10.1016/j.techsoc.2022.102052
[15] Cirolia, L.R., Sitas, R., Pollio, A., Sebarenzi, A.G., Guma, P.K. (2023). Silicon Savannahs and motorcycle taxis: A Southern perspective on the frontiers of platform urbanism. Environment and Planning A, 55(8): 1-20. https://doi.org/10.1177/0308518X231170193
[16] Kézai, P.K., Skala, A. (2024). Remarks on the location theories of startups: A case study on the Visegrad countries. Regional Science Policy and Practice, 16(9): 100063. https://doi.org/10.1016/j.rspp.2024.100063
[17] Putra, A.A.G.S.W. (2019). Tantangan dan peluang sektor informal dalam penataan ruang kawasan perkotaan. Prosiding Seminar Nasional Desain Dan Arsitektur (SENADA), 2: 598-606.
[18] Moazed, A., Johnson, N.L. (2018). Modern Monopolies: What it Takes to Dominate the 21st Century Economy. Polytechnic & Design.
[19] Rini, H.S. (2012). Dilema keberadaan sektor informal. Komunitas, 4(2): 200-209. https://journal.unnes.ac.id/nju/index.php/komunitas/article/view/2415/2468.
[20] Lim, Y.J., Osman, A., Salahuddin, S.N., Romle, A.R., Abdullah, S. (2016). Factors influencing online shopping behavior: The mediating role of purchase intention. Procedia Economics and Finance, 35: 401-410. https://doi.org/10.1016/s2212-5671(16)00050-2
[21] Hartono, A., Ishak, A., Abdurrahman, A., Astuti, B., Marsasi, E.G., Ridanasti, E., Roostika, R., Muhammad, S. (2021). COVID-19 pandemic and adaptive shopping patterns: An insight from Indonesian consumers. Global Business Review. https://doi.org/10.1177/09721509211013512
[22] Nurrachmi, I., Saripudin, U. (2021). Consumer behavior and patterns during the COVID-19 pandemic in Indonesia. In Proceedings of the First International Conference on Science, Technology, Engineering and Industrial Revolution (ICSTEIR 2020), pp. 23-27. https://doi.org/10.2991/assehr.k.210312.004
[23] Ashton, W., Kelly, W. (2019). Innovation, broadband, and community resilience. In The Routledge Handbook of Comparative Rural Policy, pp. 391-408. https://doi.org/10.4324/9780429489075
[24] Tripathi, N., Oivo, M., Liukkunen, K., Markkula, J. (2019). Startup ecosystem effect on minimum viable product development in software startups. Information and Software Technology, 114: 77-91. https://doi.org/10.1016/j.infsof.2019.06.008
[25] Saputra, W., Rum Giyarsih, S., Joko Pitoyo, A. (2020). Online transportation workers in Palembang city: Context and characteristics. IOP Conference Series: Earth and Environmental Science, 451(012100): 1-8. https://doi.org/10.1088/1755-1315/451/1/012100
[26] Tumuwe, R., Damis, M., Mulianti, T. (2018). Pengguna Ojek Online di Kalangan Mahasiswa Universitas Sam Ratulangi Manado. Holistik, XI(21): 1-19.
[27] Jonek-Kowalska, I., Wolniak, R. (2021). The influence of local economic conditions on start-ups and local open innovation system. Journal of Open Innovation: Technology, Market, and Complexity, 7(110): 1-19. https://doi.org/10.3390/joitmc7020110
[28] Hantono, D., Prayitno, B., Pramitasari, D. (2021). Hybridity of economic and social activities on informal market in Jakarta. IOP Conference Series: Earth and Environmental Science, 878(012009): 1-6. https://doi.org/10.1088/1755-1315/878/1/012009
[29] Zhu, M., Wang, Y., Wei, M., Cai, Z. (2023). How does digital finance affect consumer online shopping: A comprehensive analysis based on econometric model. Finance Research Letters, 54(103734): 1-8. https://doi.org/10.1016/j.frl.2023.103734
[30] Krisdiyawati, K., Kartika, D., Maulida, A. (2023). Implementation of E-commerce during pandemic and its influence in increasing revenue of small medium enterprises in Tegal City. In Proceedings of the Tegal International Conference on Applied Social Science & Humanities (TICASSH 2022), pp. 467-474. https://doi.org/10.2991/978-2-494069-09-1
[31] Pitoyo, A.J., Kurniawan, A., Monanisa, Aryaningrum, K., Sukmaniar, S., Saputra, W. (2023). Impacts of disruptive innovation with the emergence of startups and startup users in the informal sector of Palembang City, Indonesia. E3S Web of Conferences, 468: 06011. https://doi.org/10.1051/e3sconf/202346806011
[32] Dianda, A., Pandin, M.G.R. (2021). E-commerce in strengthening the economy during the COVID-19 pandemic: A historical review. Jurnal Ekonomi & Bisnis Jagaditha, 8(2): 179-186. https://doi.org/10.22225/jj.8.2.2021.179-186
[33] Ratchford, B., Soysal, G., Zentner, A. (2023). Multichannel customer purchase behavior and long tail effects in the fashion goods market. Journal of Retailing, 99: 46-65. https://doi.org/10.1016/j.jretai.2022.06.007
[34] Assyne, N., Adjei, J. (2017). Startup trust model: The role of trust in successful software startup. In 2017 43rd Euromicro Conference on Software Engineering and Advanced Applications (SEAA), Vienna, Austria, pp. 145-148. https://doi.org/10.1109/SEAA.2017.46
[35] Mograbi, E. (2022). Decision-makers are more impulsive on smartphones than on computers. Journal of Behavioral and Experimental Economics, 100(101916): 1-9. https://doi.org/10.1016/j.socec.2022.101916
[36] Bian, S. (2022). The impact of COVID-19 pandemic on problematic smartphone using among adolescents. In 2021 4th International Conference on Humanities Education and Social Sciences (ICHESS 2021), 615: 353-358. https://doi.org/10.2991/assehr.k.211220.061
[37] Ong, A.K.S., Dejucos, M.J.R., Rivera, M.A.F., Muñoz, J.V.D.J., Obed, M.S., Robas, K.P.E. (2022). Utilizing SEM-RFC to predict factors affecting online shopping cart abandonment during the COVID-19 pandemic. Heliyon, 8: e11293. https://doi.org/10.1016/j.heliyon.2022.e11293
[38] Wiścicka-Fernando, M. (2021). The use of mobile technologies in online shopping during the COVID-19 pandemic – An empirical study. Procedia Computer Science, 192: 3413-3422. https://doi.org/10.1016/j.procs.2021.09.114
[39] Kim, Y., Briley, D.A., Ocepek, M.G. (2015). Differential innovation of smartphone and application use by sociodemographics and personality. Computers in Human Behavior, 44: 141-147. https://doi.org/10.1016/j.chb.2014.11.059
[40] Chmielarz, W., Zborowski, M., Xuetao, J., Atasever, M., Szpakowska, J. (2022). COVID-19 pandemic as sustainability determinant of e-commerce in the creation of information society. Procedia Computer Science, 207: 4378-4389. https://doi.org/10.1016/j.procs.2022.09.501
[41] Chopdar, P.K., Paul, J., Prodanova, J. (2022). Mobile shoppers’ response to COVID-19 phobia, pessimism and smartphone addiction: Does social influence matter? Technological Forecasting and Social Change, 174(121249): 1-13. https://doi.org/10.1016/j.techfore.2021.121249
[42] Ciriaco, T.G.M., Pitombo, C.S., Assirati, L. (2023). Travel behavior and activity resilience regarding the COVID-19 pandemic in Brazil: An approach based on smartphone panel data. Case Studies on Transport Policy, 12(100998): 1-17. https://doi.org/10.1016/j.cstp.2023.100998
[43] Katsumata, S., Nishimoto, A., Kannan, P.K. (2023). Brand competitiveness and resilience to exogenous shock: Usage of smartphone apps during the COVID-19 pandemic. Journal of Retailing and Consumer Services, 75(103453): 1-15. https://doi.org/10.1016/j.jretconser.2023.103453
[44] Paulson, G. (2023). Assessing data phishing risks associated with unencrypted apps on smartphones with non-parametric test and random forest model: Insights from Kuwait phishing scam calls. Journal of Engineering Research. https://doi.org/10.1016/j.jer.2023.09.017
[45] Pratamasari, A., Permatasari, N.K.F., Pramudiyasari, T., Manessa, M.D.M., Supriatna, S. (2020). Spatial distribution patterns analysis of hotspot in central kalimantan using fimrs modis data. Jurnal Geografi Lingkungan Tropik, 4(1): 24-34. https://doi.org/10.7454/jglitrop.v4i1.74
[46] Nas, C., Putra, N., Syafrinal, I. (2021). Analysis of distribution patterns in mapping Cirebon internet service facilities using NNA algorithm based on geographic information systems. Jurnal Teknologi Dan Open Source, 4(2): 155-165. https://doi.org/10.36378/jtos.v4i2.1692
[47] Havidz, H.B.H., Hudaya, A., Ali, H. (2020). Model of consumer trust on travel agent online: analysis of perceived usefulness and security on re-purchase interests (Case study Tiket.com). Dinasti International Journal of Economics, Finance & Accounting, 1(1): 110-124. https://doi.org/10.38035/DIJEFA
[48] Roggeveen, A.L., Sethuraman, R. (2020). Customer-interfacing retail technologies in 2020 & beyond: An integrative framework and research directions. Journal of Retailing, 96(3): 299-309. https://doi.org/10.1016/j.jretai.2020.08.001
[49] Rita, P., Oliveira, T., Farisa, A. (2019). The impact of e-service quality and customer satisfaction on customer behavior in online shopping. Heliyon, 5(e02690): 1-14. https://doi.org/10.1016/j.heliyon.2019.e02690
[50] Delafrooz, N., Paim, L.H., Khatibi, A. (2010). Students’ online shopping behavior: An empirical study. Journal of American Science, 6(1): 137-147.
[51] Sukmaniar, Kurniawan, A., Pitoyo, A.J. (2020). Population characteristics and distribution patterns of slum areas in Palembang City: Getis ord gi∗ analysis. E3S Web of Conferences, 200(04005): 1-6. https://doi.org/10.1051/e3sconf/202020004005
[52] Duarte, P., Costa e Silva, S., Ferreira, M.B. (2018). How convenient is it? Delivering online shopping convenience to enhance customer satisfaction and encourage e-WOM. Journal of Retailing and Consumer Services, 44: 161-169. https://doi.org/10.1016/j.jretconser.2018.06.007
[53] Jiang, A. (2023). The impact of digital finance on online shopping. Finance Research Letters, 56(104089): 1-6. https://doi.org/10.1016/j.frl.2023.104089
[54] Kim, D.Y., Kim, S.Y. (2023). Investigating the effect of customer-generated content on performance in online platform-based experience goods market. Journal of Retailing and Consumer Services, 74: 1-13. https://doi.org/10.1016/j.jretconser.2023.103409