Ida Nurhaida | Samsul Bakri* | Nurhasanah Nurhasanah | Andi Windah | Emi Artika
© 2024 The authors. This article is published by IIETA and is licensed under the CC BY 4.0 license (http://creativecommons.org/licenses/by/4.0/).
OPEN ACCESS
Purpose – Ecotourism redevelopment must be planned to overcome the carry-over effect of COVID-19 as a prerequisite for achieving its sustainability, especially for the highly dependent on ecotourism income regions such as South Lampung Regency. Responses from repeat visitors, therefore, are very important data for determining priorities for the planning, both for reconstructing the physical facilities of tourist attractions and for rebuilding the performance of service providers. This research was aimed at determining various variables that will stimulate revisit intention. Methodology/Design/Approach – This research started from May to June 2022 to interview 100 visitors at 20 tourist destinations in South Lampung Regency. The ordinal log regression model is employed at 90 and 95% confidence levels. The response variables were 0, 1, or 3 for whom the first, second, and third or more visited respectively. Predictor variables include (a) visitor background, (b) infrastructure performance, and (c) service provider friendliness. Findings – Repeated visit intention: (a) can be increased significantly by information sources from social media, the condition of mosque facilities, and the friendliness of restaurant waiters, but (c) is decreased significantly by low visitor friendliness and ticket waiter as well as shelter attendant.
ecotourism sustainability, hospitality, ordinal logistic model, post-pandemic tourism recovery planning, redeveloping
The COVID-19 pandemic has had a significant global impact, with the tourism sector being the hardest hit sector [1, 2] such as the Indonesian tourism sector whose GDP fell by USD 20.7 trillion in 2021. This impact has begun to decrease recently, as shown by UNWTO [3] there has been an increase in global tourist visits of around 130%, almost double compared to one month at the beginning of 2021 which reached around 18 million. Even so, the recovery of this sector is still facing new uncertainty [3], and has still not reached its position of pre-pandemic performance as the carry-over effect of the pandemic is still ongoing today [4]. The recovery of this sector is still limited by the low quality of infrastructure to tourist destinations, poor physical facilities at tourist attraction locations, and the low skills of tourism service providers.
During the pandemic, many infrastructure and physical facilities were not maintained, damaged, or even destroyed because all ecotourism activities were closed [5-7], so it is now reducing the attractiveness of ecotourism destinations [8]. Worse than the decline in infrastructure or physical facilities, it now also has an impact on the decline in the skills of service providers due to long job layoffs [9] particularly their behavior of friendliness and hospitality to support visitor satisfaction. This situation certainly raises questions about the fate of the sustainability of this sector which is excellent in driving the entire economy including in South Lampung Regency.
The two types of decline in ecotourism assets must be immediately restored and redeveloped so that the volume of tourist visits should continue to increase [7], which is a prerequisite for enhancing the sustainability of this sector [10]. For the sake of solving this issue, Hoang et al. [11] stated that increasing the volume of visits may be reached through massive promotions to stimulate new visitors or else by retaining old visitors to become repeat visitors or both means. The reason for saving or cost promotion efficiency, broadcasting some print media or electronic media are the prominent means, particularly social media including YouTube, Instagram, and TikTok [12, 13]. Besides, social media may be a driving force in tourists’ destination decisions [14].
Regarding the level of promotional effectiveness, Ding et al. [15] proved that positive testimonials from visitors can often have a big impact on stimulating potential visitors. Only visitors who are satisfied with their previous visit experience have a great opportunity to repeat their visit to a tourist destination or even make recommendations to their relatives or friends [16]. Additionally, repeat visitors can often serve as testimonials for potential future visitors. This kind of free promotion is often called word-of-mouth promotion. In general, its impact can be much more effective in attracting new visitors compared to promotions using print, electronic, and IT media. This advantage can be achieved because word-of-mouth promotion is more interactive, more genuine, or natural [17] and, therefore can build higher trustworthiness than promotion through the media [18]. The kinds of promotion imply that the interest in repeat visits in the context of sustainable development planning in ecotourism will be more reliable as a basis for targeting an increase in the volume of visitors to a tourist destination.
Apart from promotional means, planning to increase the volume of ecotourism visitors should also take into account the visitor characteristic variables, including demographic background, gender, age, marital status, employment, and motivation to visit [19]. Therefore, measuring the impact of the contribution of these variables is a very important stage in any planning. This stage is necessary so that investments in rebuilding the physical and human resources of ecotourism service providers can reliably guarantee in increased monetary profits [20] through repeated visitor enhancement.
Furthermore, interest in repeat visits is also greatly affected by visitors' perceptions of the quality of physical facilities [21] that accompany the hospitality behavior of ecotourism service providers. The role of visitor background variables and their perceptions of the physical quality and friendliness of ecotourism service providers after the COVID-19 pandemic is very limited. Perceptions of health risks, for example, can suppress interest in repeat visits to an ecotourism destination [22] where this issue is still relatively tense in the post-COVID-19 pandemic. It can be imagined that by elucidating the contribution of the effect of each factor determining interest in repeat visits, a prediction model can be built, both for variables based on physical facility assets and human resource assets, especially those related to service satisfaction, namely hospitality.
Rebuilding all the factors that determine tourist visits for these two types of assets, however, does not necessarily guarantee the volume of repeated visitors increase significantly. By understanding tourists' behavior, the stakeholders will be better informed about the destination elements that need to be refined and enhanced to satisfy this loyal market segment [23]. In other words, it is necessary to identify some factors that can significantly increase interest in repeat visits. The sensitivity of the parameters of each factor to interest in repeat visits can be used as a basis for planning the redevelopment of ecotourism assets under cost-efficient investment [24, 25]. Without determining the sensitivity of these parameters, redevelopment planning will be rather speculative and seem unlikely to guarantee improvements in ecotourism sustainability indicators. It implies that the assessment of revisited intention holds significant value in anticipating the long-term viability of the tourism industry's sustainability in any region [12].
Based on all ramifications factors that affect revisit intention explained above, it will be useful to employ a linear model that can greatly contribute to this endeavor [24, 25]. particularly within the context of emerging eco-tourism regions that face uncertainty in its sustainability in line with the carry-over effect of the COVID-19 pandemic like South Lampung Regency. The objective of this research was to elucidate the influence of a tourist's background, performance of physical facilities, and hospitality provided by service providers on the intention of tourists to revisit destinations.
2.1 Research time and location
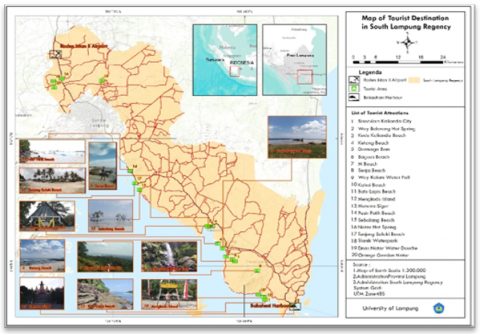
This research was carried out from April – June 2022 by interviewing 100 visitors at the 20 tourism objects in South Lampung Regency namely, Teropong Kalianda, Way Belalang Hot spring, Kedu Beach, Kentang Beach, Dermaga Water Boom, Bagoes Beach, Marina Beach, Way Kalam Waterfall, Kahai Beach, Batu Lapis, Mengkudu Island, Siger Tower, Sebalang Beach, Natar Water Spring, Selaki Beach, Slanik Water Park, Natar Pancuran Emas, and Natar Picking Orange. These research locations are presented in Figure 1.
Figure 1. Research location
2.2 Model postulate employed
The model postulate employed is a linear model, especially ordinal logistic regression (OLR Model). The OLR model applied is an implication of determining response variables that use an ordinal data scale, namely 0, 1, and 2 respectively to represent the first visitor, the second return visit, and the third or fourth return visit, and so on. We define a repeated visitor as someone who wants to visit a tourist attraction more than once. The number of repeat visits is assumed a reflection of satisfaction with previous visits. This visit frequency correlates with their socio-demographic, motivation, and their behavioral response to the physical qualities as well as the hospitality of service providers. This background, therefore, can be applied as the predictor variables of the OLR model. Just for convenience's sake, the predictor variables are grouped into 3 namely [a] visitor background group, [b] visitor perceptions of physical facilities, and [c] visitor perceptions of the hospitality behavior of service providers. Next, it is decomposed into 26 independent variables (Table 1). The model is presented in Eq. (1). The working hypotheses are as follows:
$H_0: \beta_I=\beta_2=\beta_3=\ldots=\beta_{26}=0 \rightarrow$ None of the 26 variable affect significantly intension repeat visit.
$H_l: \beta_l \neq \beta_2 \neq \beta_3 \neq \ldots \neq \beta_{26}=0 \rightarrow$ At least of the 26 variable affect significantly intension repeat visit.
The Eq. (1) is as following:
$$
\begin{aligned}
& \ln \left[\frac{P(\text { repeat }=1)}{1-P(\text { repeat })=1}\right] \\
& =\beta_{01}+\beta_{02}+\beta_1[\text { SOCMED }]_{\mathrm{I}}+\beta_2\left[\mathrm{D}_1 \_ \text {OTDISC }\right]_{\mathrm{I}}+\beta_3\left[\mathrm{D}_{1 \_} \mathrm{OTPROV}]_{\mathrm{I}}\right. \\
& +\beta_4[\text { DUTIES }]_{\mathrm{i}}+{ }_5[\mathrm{AGE}]_{\mathrm{I}}+\beta_6[\mathrm{GEND}]_{\mathrm{i}}+\beta_7[\mathrm{MAR}]_{\mathrm{i}} \\
& +\beta_8\left[\mathrm{D}_2 \_ \text{STDEN}]_{\mathrm{i}}+\beta_9\left[\mathrm{D}_2 \_ \text{PROFF}]_{\mathrm{i}}+\beta_{10}\left[\mathrm{D}_2 \_ \text{ENTRE}]_{\mathrm{i}}\right.\right.\right. \\
& +\beta_{11}[\text { PARK }]_i+\beta_{12}[\text { SANTR }]_{\mathrm{i}}+\beta_{13}[\text { LAVT }]_{\mathrm{i}}+\beta_{14}[\text { PROOM }]_{\mathrm{i}} \\
& +\beta_{15}[\text { SHELTR }]_{\mathrm{i}}+\beta_{16}[\mathrm{ROAD}]_{\mathrm{i}}+\beta_{17}[\text { PWSPL }]_{\mathrm{i}}+\beta_{18}[\mathrm{SIGN}]_{\mathrm{i}} \\
& +\beta_{19}[\mathrm{HPARK}]_{\mathrm{i}}+\beta_{20}[\mathrm{HPORTR}]_{\mathrm{i}}+\beta_{21}\left[\mathrm{HWAIT}]_{\mathrm{i}}+\beta_{22}[\mathrm{HLAVT}]_{\mathrm{i}}\right. \\
& +\beta_{23}[\mathrm{HTICK}]{ }_{\mathrm{i}}+\beta_{24}[\mathrm{HSANTR}]{ }_{\mathrm{i}}+€_i
\end{aligned}
$$ (1)
where, Ln: Logarithm operator; P(repeat=1)i: The probability of the ith visitor becomes true as a repeated visit; P(repeat=1)i: The probability the ith visitor will fail as a repeated visit; β1, β2, β3,… β26: Parameter; ξ: Error parameter; i: Respondent number; Other symbol: Enlisted in Table 1.
2.3 Data acquisition
This work is intended to collect data through a survey carried out by two enumerators at 20 tourist destination locations in South Lampung Regency (Figure 2). The respondents were those who came to visit the 20 ecotourism locations with 5 respondents at each location. Because all the tourists who came were groups consisting of 2 or more people, the respondents interviewed were those aged 14 years or more. Interviews were conducted using a semi-structured questionnaire. The data collected includes all items detailed in Table 1, Column 1.
Table 1. Predictor variables, symbol, measurement scale, and data scoring
|
Predictor Variables |
Symbol in Model |
Measurement Scale |
Data Scoring |
|
(1) |
(2) |
(3) |
(4) |
|
[a] Visitor’s Background |
|
|
|
|
Information source (0=word-mouth) |
[SOCMED]i |
binary |
=1 from social media, =0 if other |
|
Tourist’s origin (=0 if from the inner regency) |
|
|
|
|
Outer Regency South Lampung |
[D1_OTDISC]i |
dummy |
=1 from outer S. Lampung, 0=if other |
|
Outer Lampung Province |
[D1_OTPROV]i |
dummy |
=1 from outer Lampung Province, =0 if other |
|
Visitor motivation (0=if for recreation) |
[DUTIES]i |
binary |
=1 if for duty, 0= if other |
|
Visitor demography |
|
|
|
|
Age (years) |
[AGE]i |
ratio |
raw data |
|
Gender |
[GEND]i |
binary |
=1 if male, = 0 if other |
|
Marital Status |
[MAR]i |
binary |
=1 if married, =0 if single |
|
Visitor occupation (0=housewife) |
|
|
|
|
Student |
[D2_STDEN]i |
dummy |
=1 if student, =0 if others |
|
Professional Worker |
[D2_PR0F]i |
dummy |
=1 if professional, =0 if others |
|
Entrepreneur |
[D2_ENTR]i |
dummy |
=1 if entrepreneur, =0 if others |
|
[b] Visitor’s perception on the physical facilities condition |
|
=0 if poor =1 if fair =2 if good |
|
|
Parking Area |
[PARK]i |
ordinal |
|
|
Waste Treatment |
[SANTR]i |
ordinal |
|
|
Lavatory |
[LAVT]i |
ordinal |
|
|
Moslem Praying Room |
[PROOM]i |
ordinal |
|
|
Shelter |
[SHELTER]i |
ordinal |
|
|
Road |
[ROAD]i |
ordinal |
|
|
Power Supply |
[PWSPL]i |
ordinal |
|
|
HP Signal |
[SIGN]i |
ordinal |
|
|
[c] Visitor’s perception on the hospitality service provider |
|
=0 if poor =1 if fair =2 if good |
|
|
Parking Attendant |
[HPARK]i |
ordinal |
|
|
Porter |
[HPORTR]i |
ordinal |
|
|
Restaurant Waitress |
[HWAIT]i |
ordinal |
|
|
Lavatory Attendant |
[HLAVT]i |
ordinal |
|
|
Ticketing Person |
[HTICK]i |
ordinal |
|
|
Sanitarian Worker |
[HSANTR]i |
ordinal |
|
|
Food Street Vendor |
[HFDSTR]i |
ordinal |
|
|
Shelter Servicer |
[HSHLT]i |
ordinal |
|
2.4 Hypotheses testing
The underlying assumptions of the OLR Model include: (a) there is no real correlation between predictor variables, (b) there is a real correlation between response variables and predictor variables, (c) all data have homogeneous variance, and (d) all data are normally distributed. Assumption (d) is very important, generally if this assumption is satisfied then the other 3 assumptions will be met as well. To ensure the fulfillment of assumption (d), it can be done by using a large sample size, which according to Sang and Hae [26] and Wulandari et al. [27], is more than 30 sample units. Therefore, this study used 100 sample respondents. Optimization of model parameters in this study used Minitab 16. Fortunately, this software is equipped with facilities to detect the fulfillment of the four assumptions. With this facility, when the input data does not meet the four assumptions, it will not provide OLR results.
The output of the LOR model parameter optimization process is briefly presented in Table 2 which consists of (a) regression coefficients for 26 predictor variables, namely parameters β1 to β26 accompanied by intercept β01 and β02 as fitting model parameters, (b) standard error for each parameter, (c) P-value of each parameter, (d) Odds Ratio and (e) range of Odds Ratio within 95% range. Apart from that, the out is also equipped with a Gald statistic value accompanied by the P-value which is presented at the bottom of Table 2. The magnitude of the Gald statistical parameter resulting from OLR modeling is an indicator that reflects the goodness-fits of the model postulates applied [28] as employed in this research.
Table 2. The optimized model parameters and indicators of good fit of model achieved
|
Predictor |
Symbol |
Coeff. |
St.Error Coeff. |
Z |
P |
Odds Ratio |
95% Confident Level Interval |
||
|
Lower |
Upper |
||||||||
|
(1) |
(2) |
(3) |
(4) |
(5) |
(6) |
(7) |
(8) |
(9) |
|
|
Constant (1) |
|
-1.9028 |
1.5100 |
-1.26 |
0.208 |
|
|
|
|
|
Constant (2) |
|
-0.8247 |
1.5009 |
-0.55 |
0.583 |
|
|
|
|
|
Information Source (0=word-mouth) |
[SOCMED]i |
1.9252 |
0.5583 |
3.45 |
0.001 |
6.86 |
2.30 |
20.48 |
|
|
Tourist’s Origin (0=Inner Regency) |
|
|
|
|
|
|
|
||
|
Outer Regency |
[D1_OTDISC] i |
-1.4225 |
0.7154 |
-1.99 |
0.047 |
0.24 |
0.06 |
0.98 |
|
|
Outer Province |
[D1_OTPROV] i |
-0.1700 |
1.5398 |
-0.11 |
0.912 |
0.84 |
0.04 |
17.25 |
|
|
Visit Motivation (0=Leisure) |
[MOTIV]i |
-1,5715 |
0.8767 |
-1.79 |
0.073 |
0.21 |
0.04 |
1.16 |
|
|
Tourist’s Demographic |
|
|
|
|
|
|
|
|
|
|
Age (years) |
[AGE]i |
0.0507 |
0.0270 |
1.87 |
0.061 |
1.05 |
1.00 |
1.11 |
|
|
Gender (0=female) |
[GEND]i |
-0.8959 |
0.5966 |
-1.50 |
0.133 |
0.41 |
0.13 |
1.31 |
|
|
Marital (0=unmarried) |
[MAR]i |
-0.2734 |
0.5843 |
-0.47 |
0.640 |
0.76 |
0.24 |
2.39 |
|
|
Tourist’s Occupation (0=housewife) |
|
|
|
|
|
|
|
||
|
Student |
[D2_STDEN] i |
1.3702 |
1.0480 |
1.31 |
0.191 |
3.94 |
0.50 |
30.70 |
|
|
Professional Worker |
[D2_PR0FF] i |
0.4549 |
0.8893 |
0.51 |
0.609 |
1.58 |
0.28 |
9.01 |
|
|
Entrepreneur |
[D2_ENTR] i |
0.6512 |
1.0905 |
0.60 |
0.550 |
1.92 |
0.23 |
16.26 |
|
|
Physical Facility Performance (0=Poor, 1=fair, 2=good) |
|
|
|
|
|||||
|
Parking Area |
[PARK]i |
0.5034 |
0.4743 |
1.06 |
0.288 |
1.65 |
0.65 |
4.19 |
|
|
Waste Treatment |
[SANT]i |
-0.6086 |
0.4796 |
-1.27 |
0.204 |
0.54 |
0.21 |
1.39 |
|
|
Lavatory |
[LVTORY]i |
0.1480 |
0.4622 |
0.32 |
0.749 |
1.16 |
0.47 |
2.87 |
|
|
Moslem Praying Room |
[PROOM]i |
1.1728 |
0.5522 |
2.12 |
0.034 |
3.23 |
1.09 |
9.54 |
|
|
Shelter |
[SHELTR]i |
0.1091 |
0.5312 |
0.21 |
0.837 |
1.12 |
0.39 |
3.16 |
|
|
Road |
[ROAD]i |
-0.1141 |
0.4564 |
-0.25 |
0.803 |
0.89 |
0.36 |
2.18 |
|
|
Power Supply |
[PWSPL]i |
-0.6043 |
0.6440 |
-0.94 |
0.348 |
0.55 |
0.15 |
1.93 |
|
|
HP Signal |
[SGN]i |
0.6683 |
0.5210 |
1.28 |
0.200 |
1.95 |
0.70 |
5.43 |
|
|
Service Provider’s Hospitality (0=Poor, 1=fair, 2=good) |
|
|
|
|
|
|
|||
|
Parking Attendant |
[HPARK]i |
0.5095 |
0.7972 |
0.64 |
0.523 |
1.66 |
0.35 |
7.94 |
|
|
Porter |
[HPORTR]i |
1.0259 |
0.7378 |
1.39 |
0.164 |
2.79 |
0.66 |
11.85 |
|
|
Restaurant Waitress |
[HWAIT]i |
1.7399 |
0.9434 |
1.84 |
0.065 |
5.70 |
0.90 |
36.20 |
|
|
Lavatory Attendant |
[HLAVT]i |
0.2379 |
0.6485 |
0.37 |
0.714 |
1.27 |
0.36 |
4.52 |
|
|
Ticketing Person |
[HTICKT]i |
-2.1653 |
0.8410 |
-2.57 |
0.010 |
0.11 |
0.02 |
0.60 |
|
|
Sanitarian Worker |
[HSANTR]i |
0.0659 |
0.9493 |
0.07 |
0.945 |
1.07 |
0.17 |
6.86 |
|
|
Food Street Vendor |
[HFDSTR]i |
0.3802 |
0.9414 |
0.40 |
0.686 |
1.46 |
0.23 |
9.26 |
|
|
Shelter Service |
[HSHLT]i |
-1.7258 |
0.7968 |
-2.17 |
0.030 |
0.18 |
0.04 |
0.85 |
|
|
The indicators of model goodness fit |
|
|
|
|
|
|
|||
|
1. |
Log-Likelihood = -85.398 |
||||||||
|
2. |
Test that all slopes are zero: G = 38.726; DF =26; P-Value= 0.052 |
||||||||
It should be emphasized that the parameter values for the 26 predictor variables are constants that describe the sensitivity or magnitude of the impact of changes in each unit of a predictor variable on the response variable, which in this study is the interest in repeat visits. In the ordinary linear regression (OLS) model, planners utilize positive parameters so that planners can calculate the magnitude of the increase in the number of repeat visits with a very high probability (>90%). But in OLR by utilizing the Odds Ratio obtained (Table 2, Column 7) as will be discussed in the following section.
Before discussing the results of the hypothesis test, reviewing the descriptive statistics of the sample data is considered very valuable, especially to describe a general sense of the behavior of the data obtained, including the value of data distribution, measures of central tendency, and their standard deviation.
3.1 Descriptive statistic
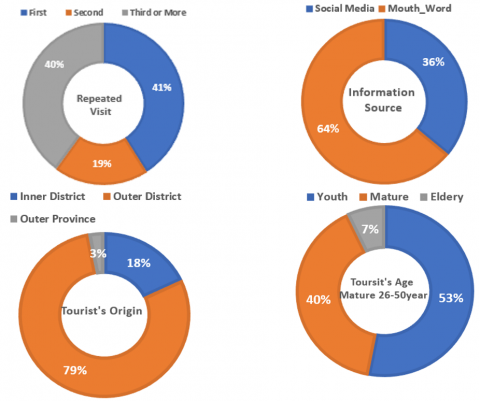
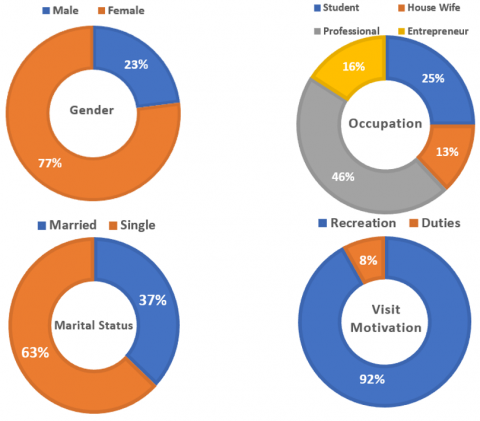
To ascertain the fundamental attributes of acquired data, it is imperative to conduct a descriptive statistical analysis. This analysis holds significant importance as a foundational component for scrutinizing the outcomes of the inferential statistical analysis in the subsequent section. Figure 2 illustrates the distribution of repeated visits and the corresponding characteristics of the respondents.
The provided figures, specifically Figure 2, containing descriptive statistical data, serve to indicate the revisited intention. Generally, it can be inferred that the 20 tourist attractions within the studied area possess adequate potential to serve as a foundation for the development of tourist interest. This assertion is substantiated by the prevalence of repeat visitors, with 60% accounting for first-time revisits, 19% representing second-time visitors, and 41% constituting third-time recurrent visitors.
About gender, the study found that a majority of respondents (77%) identified as women, while the remaining (23%) visitors were men. This data reflects gender bias in favor of women. As for the source of information, this study found that 64% of respondents acquired information regarding tourism attractions through social media platforms, while the remaining portion relied on word-of-mouth or oral communication from their family members or acquaintances [16, 17]. The amount of the latest source was a very important consideration in developing media promotion [29].
The distribution of tourists is observed to originate primarily from the inner regency (18%), followed by the outer regency (79%), and lastly the outer province (3%). The study participants encompassed various occupational categories, with professional workers comprising 46% of the total sample. Students constituted 26% of the respondents, while entrepreneurs represented 16% and housewives accounted for 13%. The age demographics indicated that the elderly constituted 3% of the sample, while the youth and mature age groups accounted for 53% and 40% respectively, with the latter representing individuals aged 26 to 50. Regarding the motivations of tourists, it is apparent that a significant majority, namely 92%, engage in tourism for recreational purposes.
Figure 2. The proportion of repeating visitor and respondent background
Table 3. Tourist’s perception on the existing facilities
|
No |
Variable |
Poor |
Fair |
Good |
|
% (n=100) |
||||
|
1 |
Road to Tourism’s Object |
26 |
49 |
25 |
|
2 |
Power Supply at Site |
24 |
60 |
16 |
|
3 |
Parking Lot Area |
7 |
51 |
42 |
|
4 |
Waste Treatment Facility |
39 |
49 |
12 |
|
5 |
Lavatory Condition |
36 |
17 |
47 |
|
6 |
Shelter Condition |
18 |
59 |
23 |
|
7 |
Moslem Praying Room |
24 |
51 |
25 |
|
|
Maximum |
39 |
60 |
47 |
|
|
Minimum |
7 |
17 |
12 |
|
|
Average |
24.9 |
48.8 |
27.1 |
|
|
SD |
10.7 |
14.4 |
12.9 |
Conversely, the remaining minority utilizes their leisure time in between the confines of their occupational duties. It is imperative to highlight that it is not possible to determine the impact of these seven variables on the distribution of repeated visitor counts. Consequently, it is imperative to scrutinize the outcomes of hypothesis testing in the subsequent section.
The additional explanatory factors that may potentially elicit repeated visits include the state of facilities (as indicated in Table 3) and the perceived level of hospitality demonstrated by service providers (as depicted in Table 4), as suggested by respondents. To ascertain the extent of impact exerted by the aforementioned groups of variables, it becomes imperative to evaluate the hypothesis through the following testing procedure discussed below.
According to the findings presented in Table 4, it is noteworthy that while a mere 27.1% of participants perceived the physical facilities as good, by and large (48.0%) regarded them as adequately satisfactory. The aforementioned findings ought to be employed in formulating strategies for the reconstruction of tourism service providers' performance, as well as the South Lampung Regency Public Service Agency. Enhancing the standards of tourist attraction facilities holds significant importance, particularly for novice tourists. It is anticipated that the level of satisfaction experienced during an initial visit will serve as a motivating factor for individuals to revisit a particular destination. This, in turn, may serve as an indicator of the long-term viability and stability of the tourism industry within each respective region. This expectation can potentially be achieved, as indicated by the rate of satisfaction among respondents who perceive a satisfactory level of friendliness or hospitality from the service provider, which stands at a notable 68.8% (Table 4) It is postulated that enhancing the caliber of physical amenities and hospitality competence will entail enhanced repeated rates, thereby serving as a crucial gauge for promoting the long-term viability of the tourism industry.
Table 4. The service provider's hospitality is experienced by the tourist
|
Variable |
Poor |
Fair |
Good |
|
% (n=100) |
|||
|
Parking Lot Attendant |
6 |
67 |
27 |
|
Porter |
5 |
71 |
24 |
|
Waitress |
5 |
71 |
24 |
|
Lavatory Attendant |
11 |
60 |
29 |
|
Ticketing Attendant |
5 |
65 |
30 |
|
Food Street Provider |
1 |
74 |
25 |
|
Shelter Attendant |
5 |
72 |
23 |
|
Maximum |
11 |
74 |
30 |
|
Minimum |
1 |
60 |
23 |
|
Average |
5.4 |
68.8 |
26.0 |
|
SD |
2.9 |
4.9 |
2.7 |
3.2 Information source
The variable of the information source, specifically through social media (SOCMED), holds significant sway in shaping the decision of a tourist to either become a repeated visitor or not. The variable denominated as [SOCMED] yielded an odds ratio (OR) value of 6.86. This implies that, if all other predictor variables remain constant, tourists who receive information about tourist attractions through social media platforms have a 6.84 times higher probability of becoming repeat visitors compared to those who obtain information through informal verbal communication from relatives and acquaintances. The observed disparity yielded a statistically significant outcome, denoted by a P-value of 0.001 The present study examined the repertoire of social media platforms employed by the subjects, which encompassed popular platforms such as WhatsApp (WA), Twitter, Facebook, Google, Instagram, and Telegram. The discovered insights offer significant recommendations for managers and local administrations in their current endeavors of formulating tourism development strategies, particularly regarding the utilization of social media platforms for promotional purposes [30]. This approach has the potential to be highly efficacious in serving as a promotional tool for rejuvenating tourism performance in response to the persistent impacts of the Covid-19 Pandemic. Additionally, it can contribute to safeguarding the well-being of the natural environment and local communities in proximity to tourist attractions. An empirical investigation undertaken [7] in Poland exemplifies the implementation of this strategy of and some significant advancements and developments have transpired. The concurrent progress made in various fields deserves scholarly attention. The enduring consequences of the prevalent engagement with social media persist to this day, serving as an ongoing favorable outcome resulting from the pandemic. This symptom affords valuable insights to marketing planners at large and holds particular significance for tourist attractions.
Table 2 describes the model fit achieved as well as the significance of the 26 predictor variables. As shown at the bottom of Table 2, the resulting model fit test is quite robust. This model's robustness is indicated by the P value = 0.052. This value means that if the model is used to predict 1,000 tourists who will become repeat visitors, then only 52 people will not come, that is, those who were predicted to be repeat visitors are not repeat visitors or vice versa. Therefore, based on this evidence, we have no reason to accept Ho. On the other hand, we must accept H1, namely that the model can be used reliably to predict the probability that someone will become a repeated visitor or not. As for which ones among the 26 predictor variables have a significant effect on the probability as repeating visitors, we must examine their optimized parameters as shown in the upper part of Table 2, particularly in Column 6. 8 predictor variables have a significant effect on the probability of a tourist whether he/she will become a repeated visitor or not. In detail, the eight variables are discussed in the following section.
3.3 Tourist’s origin
The identification of the tourists' origin holds significant importance in the formulation of development plans for tourism destinations. The detrimental consequences attributed to the persistence of the COVID-19 pandemic are elucidated through the examination of the tourist origin variable in this research. Unfortunately, the findings of this study indicate that the primary source of demand for tourism remains confined to local tourists. This assertion provides evidence to support the notion that non-local visitors from outside of the South Lampung Regency, denoted as [D1_OUTD], exhibit a significantly lower presence (P=0.047) compared to visitors originating within the regency. This is substantiated by an Odd Ratio of only 0.24. This finding holds significant importance for the formulation of strategies aimed at fostering tourist attraction and engagement. Fortunately, the present study demonstrates that the proportion of repeat visitors originating from locations outside Lampung Province (D1_OUTP) is not statistically different (P=0. 912) from that of domestic tourists, approximately 0.84.
This finding necessitates an increase in visitors from not only within the South Lampung Regency [D1_OUTD], but also from outside the Lampung Province [D1_OUTP]. The underlying rationale behind tourism pursuits, particularly ecotourism, primarily stems from recreational objectives. The extent of one's enjoyment of diverse events, phenomena, or panoramic views is contingent upon the distance traversed from their residence to reach a tourist destination. This concept concurs with the research discovery [31], it was observed that tourists who embarked on extensive journeys from their original locations were more likely to extend their stays at the destinations they reached. Additionally, those tourists who were visiting these destinations for the first time also showed a higher inclination towards elongating their visits posit that as the duration of a tourist's stay increases, there is a corresponding increase in their spending [32]. This phenomenon will concomitantly result in a rise in revenue for providers of goods and services during the duration of tourists' travel and their sojourn at their destination. The multiplier effect resulting from each transaction activity holds significant importance as it contributes to the overall increase in income for service providers, food, and souvenir product providers, and also generates additional revenue for the local authority through tax revenues in the region where the final tourist destination is situated. The upward trend in tourist arrivals from external regions implies a consequential enhancement in both local and national economic growth.
3.4 Visiting motivation
Determining the nature of motivation driving tourist visits holds significant importance in the realm of tourist object planning [33]. This crucial variable aids in enhancing the number of recurring visitors, thereby playing a pivotal role in the development of tourist attractions. The type of motivation holds significant ramifications for the requisite expansion of infrastructure, physical facilities, and services in the development process. This study has provided empirical evidence indicating that tourists who exhibit wholehearted motivation towards engaging in recreational activities have a probability of 1/0.21 (=476) of becoming repeated visitors, in contrast to individuals solely motivated to occupy their leisure time between office duties near tourist attractions. Based on the findings, it can be comprehended that motivation is substantially impacted by emotional states. Tourists demonstrating a propensity towards fulfilling their obligations exhibit a higher level of commitment towards the given task, as opposed to a mere inclination towards leisure.
This category of tourist refers to an individual who utilizes tourist amenities primarily for work-related endeavors, including engaging in outbound events, participating in seminars, attending meetings, and so forth. Tourism activities of this nature are commonly conducted in Indonesia, typically as a means of absorbing public funds. However, such practices are deemed unethical as government officials possess access to facilities within their office establishments. Therefore, it can be inferred that there exists a range of emotions that are less positively inclined towards the participant's aspiration to become a regular attendee of the gathering. This discovery aligns with the investigation conducted [34]. It has been observed that the presence of positive emotions towards tourist attractions significantly impacts individuals' intentions to engage in repeat visits. The outcomes of this study have the potential to contribute valuable insights to local tourism authorities, tourism practitioners, and tourism management when formulating strategies for the restoration and revitalization of tourist attractions against the carry-over of the COVID-19 Pandemic risk [35].
3.5 Tourist’s demographic
Based on the demographic variables examined in this investigation, it appears that solely the age variable, designated as [AGE], possesses a noteworthy influence (p=0.061) on the anticipated propensity to become repeated visitors, wherein individuals who are one year older exhibit a modestly elevated likelihood of becoming repeated visitors, estimated at approximately 1.05 times that of younger individuals. The respondents' average age is 28 years old, with a standard deviation of 10.1. The youngest age reported by participants was 14 years old. A qualitative study utilizing the focus group technique was conducted to examine the beliefs of youth respondents regarding ecotourism.
According to Cini and Passafaro [36] the findings of a prior investigation encompassing both adult and young cohorts, which had revealed a prevailing deficiency in understanding concerning the fundamental aspects of ecotourism, including its essence, objectives, and salient traits. Additionally, participants displayed limited cognizance regarding certain advantageous outcomes associated with ecotourism practice, such as its capacity to enhance the welfare of indigenous populations. Moreover, novel perspectives have been contributed to the current body of literature addressing the traits and visual representation of this tourism phenomenon, which appears to be subject to the influence of biases and preconceived notions.
The variables of sex, denoted as [GEND], and marital status, denoted as [MRRY], did not exhibit a significant influence on the probability of being a repeated visitor. The present study diverges from the findings reported [37] with regards to the role of gender. The factors influencing the loyalty of tourists towards revisiting their chosen destination in the year 2022. The significance of this discovery holds implications for strategizing the growth of tourist destinations, thereby considerably elevating the likelihood of repeated visitors, with particular emphasis on age-related segments. To accomplish this objective, it becomes imperative to assess the impact of augmenting the number of returning visitors, confining it exclusively to individuals within the age range of 14-68 years (refer to Table 4). The authors must establish a connection between the segmentation of their professional cohorts, as elucidated in the subsequent section.
3.6 Tourist’s occupation
The occupation of individuals has the potential to significantly influence the performance of tourism visits through the mediation of two key variables. The initial aspect pertains to the capacity of individuals to allocate funds for recreational activities after satisfying necessities. The availability of an income surplus can be attributed to expenditures on fulfilling individuals' psychological needs, which encompass activities such as leisure and tourism [38]. Moreover, apart from the aforementioned prerequisite of generating surplus income, another essential requirement necessitates the possession of available leisure or unoccupied intervals. An individual may possess an ample excess of financial resources, albeit due to their professional engagements, they are unable to avail leisurely pursuits [39].
This study demonstrated that there was no statistically significant variation in the likelihood of being a repeated visitor among a cohort encompassing housewives, students, professional workers, and entrepreneurs. The finding suggests that it is unnecessary to differentiate in strategic planning for the three distinct market segments. Based on the findings, it is imperative to prioritize attention on the age cohort comprising individuals aged between 26 and 50 years, regardless of their occupation category, owing to the largest representation observed among visitors (see Figure 2). Moreover, managers need to implement this guideline to improve the amenities of tourist attractions under their supervision, thereby enhancing their overall appeal.
3.7 Tourist’s perception on the physical facility condition
The study conducted by Culic et al. [40] found that the presence and condition of tourism destination objects and physical infrastructure have a direct influence on the intention of tourists to revisit. Additionally, this influence is also mediated by the level of satisfaction experienced by tourists with the hospitality services provided. In our study examining the impact of eight physical infrastructure variables on repeat visitation likelihood, which include road performance, parking area availability, lavatory quality, waste management efficiency, electric power supply adequacy, and cell phone signal strength, our findings reveal that only the performance of prayer rooms, referred to as [PROOM], exhibits a significant positive association with an individual's likelihood of becoming a repeat visitor. In this scenario, it is posited that tourism destinations featuring improved mosque facilities are more likely to attract repeat visitors.
The prevalence of the Muslim populace within this nation is conceivably ingrained within this phenomenon. According to a study conducted [41] recommended that managers of non-Muslim tourist destinations incorporate Muslim facilities and attributes to enhance the likelihood of repeat visitations. This proposition is formulated based on the empirical investigation conducted [42] on Muslim individuals who engaged in travel to non-Muslim countries. This proposition bears significance for all service providers operating within the realm of tourism services. Hence, post the Covid-19 pandemic, redevelopment initiatives do not necessitate significant investments in most physical infrastructures, with the exception being facilities catering specifically to the Muslim community. Efforts should prioritize augmenting the human resource capacity of tourism service providers, with particular emphasis on enhancing their hospitality behaviors.
3.8 Tourist’s perception on the hospitality of service providers
The pivotal significance of service providers' hospitality in shaping service quality, leading to repeated customer visits, was uncovered [41]. Coherently, Culic et al. [40] also observed this phenomenon. Their empirical findings have demonstrated a significant relationship between the quality of hospitality encountered by tourists and their inclination to engage in repeated visits. However, the findings of our research indicate that three out of the eight hospitality variables, namely restaurant waitressing (HWAIT), ticket clerking (HTICKT), and shelter waiter (HSHLT), have a significant impact on the likelihood of repeat visits (RVSIT). The preceding two references significantly impact the response variable [RVIST] adversely.
The enhancement of performance in the three developmental aspects is confined within a private domain, specifically to individual restaurateurs or concessionaires responsible for the management of tourist establishments. Enhancing the service performance of waitresses and clerks employed at tourist establishments is deemed a personal responsibility, entailing the provision of training programs aimed at refining table manners and guest service etiquette.
Private entities derive direct benefits from each transaction involving the sale of goods or services. Nevertheless, it is noteworthy to highlight that local authorities augment their overall revenue through the collection of tax levies on every transaction and via corporate taxes [42]. Hence, in consideration of the revenue derived from both tax types, local authorities must assume responsibility for enhancing the efficacy of public service providers. The allocation of public funds necessitates immediate attention, given that the findings of this study substantiate the adverse impact of [HTICKET] and [HSHLT] on the likelihood of a tourist becoming a recurrent visitor. The substantial rise in the number of recurring visitors contributes significantly to the efficiency of visits to individual tourist attractions in comparison to the acquisition of new visitors, although the latter approach remains equally significant.
The results of the study indicate that there are significant factors that influence revisiting probabilities. These factors include: (a) the sources of information, with individuals who received information through social media being 6.86 times more likely to revisit compared to those who received information through word-of-mouth communication; (b) the origin of the tourist, where individuals from outer regencies were 0.24 times less likely to revisit compared to those from inner regencies; (c) age, with each additional year of age increasing the likelihood of revisiting by 1.05 times; (d) visiting motivation, with individuals intending for recreation being 4.76 times more likely to revisit compared to those intending to simply fill leisure time; (e) perception of physical facilities, where a better prayer room stimulated a 3.23 times increase in the likelihood of repeat visits; (f) hospitality performance of service providers, specifically the impact of restaurant waiters on revisiting probabilities, which improved by 5.70 times when their performance was enhanced by one category (e. g, from bad to fair or from fair to good). However, the hospitality perception of ticket attendants and shelter attendants hurt revisiting, with an increase in perception by one category resulting in a decrease of 0.11 and 0.18 in revisiting probabilities, respectively. It is strongly advised to utilize these findings as a framework for devising strategies for the revival of tourism, with a focus on ensuring the long-term viability of ecotourism endeavors in light of the ongoing repercussions of the COVID-19 global health crisis.
This study proposes that there is a significant impact on revisit intention based on various factors. Firstly, the intention to revisit is influenced by the tourist's background intention, particularly in terms of obtaining destination information. The research findings show that tourists who acquire information from social media platforms have a 6.86 times higher likelihood of revisiting compared to those who rely on word of mouth. Furthermore, the motivation for relaxation has a 4.76 times greater effect on revisit intention compared to motivations related to obligations or duties. Additionally, the tourist's origin also plays a role, with tourists from outside the region having just a quarter of the likelihood to revisit compared to those from within the region. Furthermore, the physical facility performance also impacts revisit intention. Places of worship have the potential to substantially enhance interest in repeat visits, unlike other physical facilities. In terms of fostering positive hospitality performance, it has been determined that restaurant waiters have a favorable influence, whereas ticketing men and shelter guards demonstrate a negative impact.
The findings of the study indicate that the tourists' inclination to revisit a destination is primarily influenced by their usage of social media as a source of information, specifically 6.86 times more compared to word of mouth. Additionally, the tourists' motivation for visiting the destination greatly relates to their desire to relax, which is 4.76 times stronger than those who visit out of responsibilities or obligations. Furthermore, there is a significant difference between tourists from outside the area and those from the inner region, with the former being only 0.25 times the latter in number. In terms of physical facility performance, it is noteworthy that only places of worship have a substantial ability to increase the tourists' interest in returning to the destination, while other physical facilities do not exhibit such influence. Moreover, the study reveals that in terms of hospitality performance, restaurant waiters display a positive impact on the tourists' inclination to revisit, whereas ticketing men and shelter guards have a negative influence in this regard.
This research was funded by the 2022 Research and Community Service (LPPM) of the University of Lampung, which we convey special thanks.
[1] Kismartini, K., Purnaweni, H., Djumiarti, T., Khotimah, N. (2021). A change in tourism management: A new normal era in Riau Islands Province. In Proceedings of the 5th International Conference on Indonesian Social and Political Enquiries, ICISPE 2020, Semarang, Indonesia. https://doi.org/10.4108/eai.9-10-2020.2304726
[2] Žibert, M., Prevolšek, B. (2021). The phenomenon of (sustainable) tourism activities on farms in Slovenia during the COVID-19 pandemic. Studia Eclogiae et Bioethicae, 19(4): 69-83. http://doi.org/10.21697/seb.2021.19.4.06 /term/347
[3] UNWTO. (2022). Tourism enjoys a strong start to 2022 while facing new uncertainties. https://www.unwto.org/taxonomy, accessed on Oct. 24, 2022.
[4] Baloch, Q.B., Maher, S., Shah, S.N., Sheeraz, M., Iqbal, N., Raza, H. (2022). Revitalization of tourism and hospitality sector: Preempting pandemics through lessons learned. Environmental Science and Pollution Research, 29(55): 83099-83111. https://doi.org/10.1007/s11356-022-21392-7
[5] Cherkaoui, S., Boukherouk, M., Lakhal, T., Aghzar, A., Youssfi, L.E. (2020). Conservation amid COVID-19 pandemic: Ecotourism collapse threatens communities and wildlife in Morocco. E3S Web of Conferences, 183: 01003. https://doi.org/10.1051/e3sconf/202018301003
[6] Al-Fatih, S. (2023). Workers layoffs caused from the COVID-19 pandemic in Indonesia and the European Union. Jurnal Kajian Pembaruan Hukum, 3(1): 1-26. https://doi.org/10.19184/jkph.v3i1.33378
[7] Hussin, R., Latip, N.A., Shah, J.M., Pingking, A., Samsul, S.S., Nordin, D.S.N.D. (2022). Ecotourism activities, homestay recovery plan and strategy indicators in post-COVID-19 Kundasang, Sabah, Malaysia. Planning Malaysia: Journal of the Malaysian Institute of Planners, 20(4): 101-114. http://doi.org/10.21837/pm.v20i23.1154
[8] Rahimian, M., Rad, M.M., Zreei, H. (2022). The effect of the COVID-19 pandemic on ecotourism: A study from West Iran. Frontier Public Health, 10: 983025. https://doi.org/10.3389/fpubh.2022.983025
[9] Sánchez-Sánchez, F.J., Sánchez-Sánchez, A.M. (2023). Ecotourism and COVID-19: Impact on the efficiency of the Spanish hospitality industry. Journal of Outdoor Recreation and Tourism, 43: 100680. https://doi.org/10.1016/j.jort.2023.100680
[10] Eba, M.B.A., Enamhe, D.C. (2023). Ecotourism: A mechanism for sustainable tourism development. Jurnal Ilmu Sosiologi Dialektika Kontemporer, 11(3): 40-59.
[11] Hoang, S.D., Pham, T.P., Tučková, Z. (2022). Tourist motivation as an antecedent of destination and ecotourism loyalty. Emerging Science Journal, 5(6): 1114-1133. http://doi.org/10.28991/ESJ-2022-06-05-014
[12] Bakri, S., Apriliani, A.P., Ashaf, A.F., Despa, D., Sitorus, S.H., Utami, M.P., Nurhasanah, N., Hartuti Purnaweni, H., Danisari, C. (2022). Satisfaction as the basis for enhancing intension repeated visitor through empowering the hospitality of service provider: Study at 3 ecotourism objects at Pringsewu Regency_Lampung Province. International Journal of Advance and Innovative Research, 9(3): 24-31.
[13] Krisdanu, C.A., Sumantri, K.A. (2023). Tik Tok sebagai media pemasaran digital di Indonesia. Jurnal Lensa Mutiara Komunikasi, 7(2): 24-36. https://doi.org/10.51544/jlmk.v7i2.4173
[14] Keelsona, S.A., Bruceb, E., Egalab, S.B, Amoahd, J., Jibril, A.B. (2024). Driving forces of social media and its impact on tourists destination decisions: A uses and gratification theory. Tourism & Hospitality, 10(1): 1-23. https://doi.org/10.1080/23311886.2024.2318878
[15] Ding, K., Gong, X.Y., Huang, T., Chong, W.C. (2024). Recommend or not: A comparative analysis of customer reviews to uncover factors influencing explicit online recommendation behavior in peer-to-peer accommodation. European Research on Management and Business Economics, 30(1): 100236. https://doi.org/10.1016/j.iedeen.2023.100236
[16] Ukus, F.W., Sihombing, I.H.H., Utama, I.P., Arrey, M.E.V. (2024). Influence of service quality on word of mouth mediated by tourist satisfaction at the budo tourism village homestay. Jurnal Ilmu Sosial Mamangan, 13(1): 155-171. https://doi.org/10.22202/mamangan.v13i1.8201
[17] Syahbudiman, R., Hendrayati, H., Kusumah, A.H.G., Marimon, F., Marhadi. (2024). Memorable tourist experience and its impact on tourist engagement. Image: Jurnal Riset Manajemen, 12(1): 105-118. https://doi.org/10.17509/image.2024.009
[18] Sirojuddin, N.M., Sudarmiatin, S., Dhewi, T.S. (2024). Influence social media marketing and electronic word-of-mouth to purchase intention on products Erigo official shop on Shopee mediated by brand trust to students active in Malang City. Asian Journal of Management Analytics (AJMA), 3(2): 389-404. https://doi.org/10.55927/ajma.v3i2.8677
[19] Mihai, V.C., Dumitras, D.E., Oroian, C., Chiciudean, G.O., Arion, F.H., Muresan, I.C. (2023). Exploring the factors involved in tourists’ decision-making and determinants of length of stay. Administrative Sciences, 13: 215. https://doi.org/10.3390/admsci13100215
[20] Xu, L., Ao, C., Liu, B., Cai, Z. (2023). Ecotourism and sustainable development: A scientometric review of global research trends. Environment, Development and Sustainability, 25: 2977-3003 https://doi.org/10.1007/s10668-022-02190-0
[21] Yuliarni, N., Ratih Hurriyati, R., Disman, D., Hendrayat, H., Warlina, L. (2023). Marketing strategy of ecotourism in Uzbekistan and Indonesia. Journal of Eastern European and Central Asian Research, 10(4): 638-649. http://doi.org/10.15549/jeecar.v10i4.1359
[22] Yong, H.N.A., Kalhoro, M., Dahari, K.B.M., Shaikh, F.B. (2023). Factors affecting domestic tourists’ repeat purchase intention towards accommodation in Malaysia. Frontiers in Psychology, 13: 1056098. http://doi.org/10.3389/fpsyg.2022.1056098
[23] Moreno-Manzo, J., Coromina, L., Gassiot-Melian, A. (2024). Examining the structural relationships between perceived value, satisfaction, and loyalty among disabled tourists in two World Heritage sites. Consumer Behavior in Tourism and Hospitality, 19(1): 37-54. http://doi.org/10.1108/CBTH-02-2023-0011
[24] Nestor, S., Muzychenko-Kozlovska, O., Gvozd, M., Sroka, W. (2021). Simulation of the influence of external factors on the level of use of the regional tourism potential: A practical aspect. Administrative Sciences, 11: 85. https://doi.org/ 10.3390/admsci11030085
[25] Fitri, F., Islamiyati, A., Kalondeng, A. (2024). Estimasi parameter model regresi logistik biner dengan conditional maximum likelihood estimation pada data panel. ESTIMASI: Journal of Statistics and Its Application, 5(2): 141-148. https://doi.org/10.20956/ejsa.v5i2.13998
[26] Sang, G.K., Hae, H.K. (2017). Central limit theorem: The cornerstone of modern statistics. Korean Journal of Anesthesiology, 70(2): 144-156. https://doi.org/10.4097/kjae.2017.70.2.144
[27] Wulandari, C., Bakri, S., Riniarti, M., Supriadi, S. (2021). Fostering the sustainability of community forestry program: Case study in Lampung-Sumatra. Forestry Ideas, 27(1): 210-232.
[28] Utama, I.G.B.R., Trimurti, C.P., Krismawintari, N.P.D., Junaedi, I.W.R. (2021). Revisit intention regression model of agritourism destinations of Pelaga and Buyan-Tamblingan, Bali, Indonesia. Turkish Journal of Computer and Mathematics Education, 12(6): 2504-2512. https://doi.org/10.17762/turcomat.v12i6.5695
[29] Windah, A., Yulianto, Y., Wardhani, A.C., Nurhaida, I., Ariyanti, N.Y. (2023). Calling for multiculturalism-based communication campaign in early prevention of youth diabetes. International Journal of Humanities Education and Social Science, 2(1): 2128-2140. https://doi.org/10.55227/ijhess.v2i6.536
[30] Hamid, A.A.H., Mohamad, M.R., Suki, N.M. (2020). Tourists’ revisit intention to UNESCO world heritage sites in a developing nation: Investigating the mediating role of place dependence. Journal of Vacation Marketing, 20(10): 1-14. https://doi.org/10.1177/1356766720969739
[31] Nicolau, J.L., Zach, J., Tussyadiah, I.P. (2016). Effects of distance and first-time visitation on tourists’ length of stay. Journal of Hospitality and Tourism Research, 10(20): 1-16. https://doi.org/10.1177/1096348016654972
[32] Massidda, C., Piras, R., Seetaram, N. (2022). Analyzing the drivers of itemized tourism expenditure from the UK using survey data. Annals of Tourism Research Empirical Insights, 3(1): 100037. https://doi.org/10.1016/j.annale.2022.100037
[33] Thiumsak, T.T., Ruangkanjanases, A. (2016). Factors influencing international visitors to revisit Bangkok. Journal of Economics, Businees, and Management, 4(3): 220-230. https://doi.org/10.7763/JOEBM.2016.V4.394
[34] Quynh, N.H., Hoai, N.T., Loi, N.V. (2021). The role of emotional experience and destination image on ecotourism satisfaction. Spanish Journal of Marketing, 25(2): 308-328. https://doi.org/10.1108/SJME-04-2020-0055
[35] Sukaatmadja, I.P.G., Yasa, N.N.K., Telagawathi, N.L.W.S., Witarsana, I.G.A.G., Rahmayanti, P.L.D. (2022). Motivation versus risk: Study of domestic tourists’ revisits intention to Bali on pandemic COVID-19. Linguistics and Culture Review, 6(S1): 65-77. https://doi.org/10.21744/lingcurev6nS1.1910
[36] Cini, F., Passafaro, P. (2019). Youth and ecotourism: A qualitative exploration. Tourism and Hospitality Research, 19(1): 126-131. https://doi.org.10.1177/1467358417704887
[37] Papadopoulou, N.M., Ribeiro, M.A., Prayag, G. (2022). Psychological determinants of tourist satisfaction and destination loyalty: The influence of perceived overcrowding and overtourism. Journal of Travel Research, 62(3): 644-662. https://doi.org/10.1177/00472875221089049
[38] Sreen, N., Tandon, A., Jabeen, F., Srivastava, S., Dhir, A. (2023). The interplay of personality traits and motivation in leisure travel decision-making during the pandemic. Tourism Management Perspectives, 46(101095): 1-16. https://doi.org/10.1016/j.tmp.2023.101095
[39] Istriyani, R. (2021). Consuming leisure time: How the tourism trend has changed the village. Journal of Contemporary Sociological Issues, 1(1): 17-34. https://doi.org/10.19184/csi.v1i1.19803
[40] Culic, M., Vujicic, M.D., Kalinic, C., Dunjic, M., Stankov, U., Kovacic, S., Vasiljevic, D.A., Andelkovic, Z. (2021). Rookie tourism destinations—The effects of attractiveness factors on destination image and revisit intention with the satisfaction mediation effect. Sustainability, 13(11): 5780-5796. https://doi.org/10.3390/su13115780
[41] Hanafiah, M.H., Maek, A.B.A.A., Zahari, M.S.M. (2021). Muslim tourist behaviour and intention to revisit non-Muslim countries: The role of Muslim-friendly tourism (MFT) attributes. International Journal of Religious Tourism and Pilgrimage, 9(1): 165-177. https://doi.org/10.21427/ps19-n143
[42] Purba, M.G., Suhud, U., Aditya, S. (2021). Faktor-faktor yang mempengaruhi customer satisfaction dan revisit intention pada turis Danau Toba. Jurnal Bisnis, Manajemen, dan Keuangan, 2(3): 891-905.