Faisal Rahutomo*![]() | Theodore Aditya Putranto
| Theodore Aditya Putranto![]()
© 2025 The authors. This article is published by IIETA and is licensed under the CC BY 4.0 license (http://creativecommons.org/licenses/by/4.0/).
OPEN ACCESS
Diabetes is a common disease and is a significant issue in developing and developed countries. Machine learning, a branch of artificial intelligence, provides various algorithms that can efficiently process and analyze medical data to make accurate predictions. This study investigates several machine learning classification approaches for diabetes prediction from medical data sets. This study uses the Pima Indians Diabetes Database for evaluation purposes. These research uses algorithms include Logistic Regression (LR), Decision Tree (DT), Random Forest (RF), Support Vector Machine (SVM), Naive Bayes (NB), Artificial Neural Networks (ANN), K-Nearest Neighbor (KNN), XGBoost (XGB), Linear Discriminant Analysis (LDA), and Quadratic Discriminant Analysis (QDA). This research has, as the ultimate goal, a comparison and assessment of the performance of these algorithms on diabetes prediction. Among all the above-mentioned algorithms, LR is the best-performing model for precision (72.9%) as well as for accuracy (77.73%) and F1-score (65.04%). The KNN model was best illustrated by recall (63.42%). The LDA model produced the maximum Area Under the Curve (AUC) value as 83.9%.
diabetes, early detection, machine learning, classification
Diabetes is an epidemic disorder that poses a severe challenge to health, both in the developed and developing world [1]. The pancreas plays an important role in secreting insulin, a hormone that regulates the release of glucose into the bloodstream from foods. Insulin deficiency occurs when the pancreas does not work properly, resulting in diabetes. The disease can cause damage as serious as coma, kidney and retina failure, destruction of pancreatic beta-cells, cardiovascular and cerebrovascular dysfunction, peripheral vascular disease, sexual impairment, joint destruction, weight loss, ulcers, and immunosuppression [2]. Research on diabetic individuals shows that the global prevalence of diabetes among adults (aged 18 and older) rose from 4.7% in 1980 to 8.5% in 2014, with a particularly sharp increase in developing nations [3]. Statistical findings in 2017 indicated 451 million people suffering from diabetes across the globe, and the projection is that it could go up to 693 million by 2045 [4]. Another study [5] emphasizes the seriousness of diabetes, revealing that nearly 500 million people are affected, with anticipated increases of 25% by 2030 and 51% by 2045. While diabetes currently has no definitive cure, early detection using precise prediction models can help manage, regulate, and even prevent the disease effectively.
Anticipating diabetes remains a challenging assignment due to the non-linearly distinct nature of its quality dispersion. Early detection and diagnosis are crucial in minimizing complications and improving patients' quality of life. Over the past decades, information and computing technology advancements have introduced various data analysis techniques that aid in disease prediction. Machine learning, a subset of artificial intelligence, offers diverse algorithms capable of efficiently processing and analyzing medical data for accurate predictions.
Recently, numerous researchers have explored machine learning approaches for diabetes prediction, some researchers [6] evaluate three classification algorithms, finding that Naïve Bayes achieves the highest accuracy at 76.30%. The authors [7] apply seven machine learning algorithms, identifying Logistic Regression (LR) and Support Vector Machine (SVM) as the most effective models. They also develop a neural network and discover that a two-layer hidden architecture attains the highest accuracy of 88.6%. Some researchers [8] analyze seven machine learning algorithms alongside an ontology-based classification approach, concluding that ontology-based classifiers and SVM yield the best accuracy. In this study [9], two datasets are analyzed, with LR achieving the highest accuracy of 96% on the newer dataset.
In this study, some researchers [10] explore four diabetes datasets using eight machine learning techniques. The study identifies the most robust models. Random Forest (RF) experimental results show 86% and 98.48% accuracy for dataset 1 and dataset 2, respectively. Meanwhile, DT and XGBoost (XGB) outperform other models with an accuracy of 99. 27% on dataset 3 and 100% on dataset 4. In this study [11], researchers implement seven machine learning algorithms and suggest an ensemble model with an AUC score of 95%. In this study, some researchers [12] also contrast Quadratic Discriminant Analysis (QDA), Linear Discriminant Analysis (LDA), and Naive Bayes (NB) with Gaussian Process Classification with three kernels, and it transpires that the Gaussian Process model with an RBF kernel achieves the highest accuracy of 81.97%.
Researchers [13] utilize seven machine learning algorithms using R software, and multivariate adaptive regression splines and LR emerge as the most suitable models for predicting emergency department visits. In the work [14], an RF classifier is employed for developing a diabetes prediction model with an accuracy of 95.15%. There is a comparison between six algorithms where the findings indicate that the optimal model is RF with an accuracy of 98.07% [15]. The authors [16] used three different algorithms and feature selection. The DT demonstrates accomplishes the leading execution, with an accuracy of 91%, precision of 96%, recall of 92%, and an F1-score of 94%. Finally, they tested eight different algorithms to predict and determine diabetes, in which the binary Decision Tree (DT) achieved the highest classification accuracy of 92.58% [17].
This study explores using ten machine learning classification algorithms to predict diabetes in medical datasets. This paper investigates the implementation of machine learning in various real-world cases, such as the previous research [18-21]. It also contributes to the ongoing study of how information technology can be implemented in the health sector [22, 23]. The algorithms include LR, SVM, NB, RF, DT, QDA, K-Nearest Neighbor (KNN), XGBoost, Artificial Neural Networks (ANN), and LDA. All these algorithms process data differently and have varying strengths and limitations when classifying. The essential objective of this investigation is to compare and differentiate their execution in anticipating diabetes utilizing the given datasets. Through comparative research, the study seeks to establish the most effective and efficient algorithms for use in real-world medical practice.
This paper is organized as follows: Section 2 discusses the research method, while Section 3 presents the results and discussion. Finally, Section 4 provides the conclusions and suggestions. Some abbreviations are included in the text, as they are used frequently, and a full list of these terms can be found in the nomenclature section following the references.
Figure 1 illustrates the suggested workflow diagram. The process starts with a raw dataset, which is processed to clean and format the data so that it is ready for analysis. After the preprocessing steps, the data is split into two parts: the training and test sets. This is a crucial step for model performance testing. All the models undergo an evaluation phase, testing their performance against various performance metrics. This final step is most important in choosing the optimal model for the current problem.
Figure 1. The flow diagram diabetes prediction
This section provides further details about the dataset used and the preprocessing steps taken before it was input into the algorithm. Key preprocessing steps included filling in missing values and normalizing the data. Additionally, we will explain how the training and testing processes, which began with k-fold cross-validation, were conducted. Finally, an overview of several machine learning algorithms will be provided, concluding with a discussion of the performance measurement metrics utilized.
2.1 Dataset
This study utilizes the Pima Indians Diabetes Database, provided by the National Institute of Diabetes and Digestive and Kidney Diseases. The dataset consists of 768 rows and 9 columns, with all patients being female, at least 21 years old, and of Pima Indian heritage. The nine attributes used in this study are presented in Table 1.
Table 1. Attribute description
|
Attribute |
Description |
|
Pregnancies |
Overall count of pregnant |
|
Glucose |
Blood sugar level measured |
|
Blood Pressure |
Diastolic blood pressure (in mm hg) |
|
Skin Thickness |
The measurement of the skinfold thickness at the triceps |
|
Insulin |
Serum insulin concentration measured two hours post-challenge (µU/ml) |
|
BMI |
Body mass index |
|
Diabetes Pedigree Function |
Diabetes based on family history function |
|
Age |
Length of time a person has lived |
|
Outcome |
Class label (0 or 1) |
2.2 Dataset preprocessing
Preprocessing is a very important stage. The main goal of preprocessing is to improve data quality and ensure the model can use it well, not to affecting the expected results. The first step in this stage is to copy the original data into a new variable to facilitate processing without changing the original dataset. Then, check how many missing values there are and make sure there are no duplicates in the dataset. After that, we filled out the missing values and normalized the data.
2.2.1 Filling missing values
Lost values within the Glucose, Blood Weight, Skin Thickness, Affront, and BMI are filled utilizing the KNN imputation. This technique replaces missing values with predicted values based on conversion with other samples in the dataset. This work is done by finding the closest data based on other available feature values. This approach helps preserve the overall data pattern while minimizing bias.
2.2.2 Data normalization
The scaling process needs to be done because there are very different ranges of values. For example, pregnancies are between 0-15, while Glucose is between 50-200. This difference in value can later affect the accuracy value of the model because it causes the model to lean more towards features with a larger scale. The scaling process will be carried out using the standard scaler function from scikit-learn. Standard scaler is a scaler that standardizes features by reducing the mean and dividing by the standard deviation so that the data will have a fair distribution with a mean (µ) = 0 and a standard deviation (σ) = 1.
2.3 Training and testing the data
The training phase involves constructing a machine learning framework using data that has undergone preprocessing. The dataset in this process is split into train data and test data. In this research, the dataset is partitioned through the Stratified K-Fold Cross-Validation technique to maintain an even distribution of positive and negative categories in each fold. This step is necessary due to the imbalance in class distribution between diabetic and non-diabetic patients. Through stratification, each fold retains an equal category ratio, minimizing the risk of bias during model learning.
All classification models are trained on a single fold's training data, with the remaining folds as validation data. This is repeated a few times so that each fold serves as validation data at least once. This method provides a more effective analysis of the model performance since the model is tested using different data every time. This method also provides a better approximation than the older hold-out method, where the model is evaluated only once against a single test dataset.
2.4 Machine learning algorithm
This research uses several classification methods for the Pima Indians Diabetes Database. The methods used here are RF, QDA, NB, ANN, DT, SVM, LDA, KNN, XGBoost, and LR. LR using LBFGS solver (Limited-memory Broyden–Fletcher–Goldfarb–Shanno). The DT is done with the DT Classifier with Gini impurity as the criterion for splitting nodes. RF is performed under an RF Classifier with 100 trees. SVM using Support Vector Classification with Radial Basis Function kernel. KNN is performed using 5 neighbors with Euclidean Distance and uniform voting. ANN is performed using the MLP Classifier with 1 hidden layer of 100 neurons, using Adam solver and ReLU activation function. LDA is performed under the SVD solver.
2.5 Performance metrics
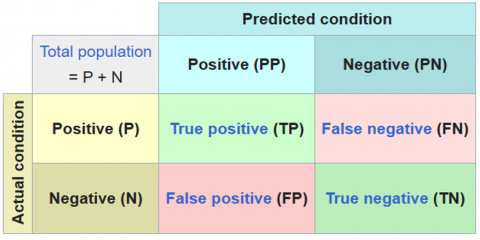
A confusion matrix summarizes the classification results, showing how accurately the model predictions match true labels. A matrix row corresponds to a valid category, and a column corresponds to a predicted category. The precision of a machine learning demonstration, also known as the classification rate, is calculated employing a specific formula that considers four key measurements: True Positives (TP), which signify the accurately classified positive occurrences; False Negatives (FN). This demonstrates cases where positives are wrongly categorized as negatives; True Negatives (TN), which speak to precisely recognized negative occasions; and False Positives (FP), which depict negative cases misclassified as positive. The following equations are used to evaluate the effectiveness of each model (Figure 2).
Figure 2. Confusion matrix
2.5.1 Accuracy
Accuracy is the extent to which a show accurately categorizes information. Accuracy is computed as a ratio of correctly predicted events to the total number of tests. In other words, accuracy indicates how well the predicted values approximate the actual values. To calculate accuracy, we use Eq. (1).
$Accuracy =\frac{T P+T N}{T P+T N+F P+F N}$ (1)
2.5.2 Precision
Precision measures how accurate the model is in predicting the positive class. That is, out of all the positive predictions, how many are actually positive. To determine precision, we use Eq. (2).
$Precision =\frac{T P}{T P+F P}$ (2)
2.5.3 Recall
Recall measures how well the model detects the positive class. That is, out of all the actual positive classes, how many were correctly predicted. To determine recall we use Eq. (3).
$Recall =\frac{T P}{T P+F N}$ (3)
2.5.4 F1-score
This metric is the harmonic mean of recall and precision, promoting an adjustment between the two measures when there is a trade-off between them. To compute the F1-score, we utilize Eq. (4).
$F 1- score =\frac{2 \times { Precision } \times { Recall }}{ { Precision }+ { Recall }}$ (4)
2.5.5 ROC-AUC
Receiver Operating Characteristic (ROC) is a graph illustrating the performance of a classification model at various prediction thresholds. The graph shows the relationship between two metrics, True Positive Rate or recall (TPR) and False Positive Rate (FPR). AUC refers to the Area Under the Curve (AUC), reflecting the model's ability to correctly classify data as positive or negative. TPR measures how effectively the model identifies the positive class. At the same time, FPR shows the proportion of the negative class incorrectly classified as positive.
$T P R=\frac{T P}{T P+F N}$ (5)
$F P R=\frac{F P}{F P+T N}$ (6)
This section outlines the results and discussion. The first part presents the outcomes of data preprocessing, while the subsequent section describes the performance of each machine learning algorithm along with the established metrics.
3.1 Preprocessing
Figure 3 (a) shows the plot before filling in the missing values to see the distribution of values from each column in the dataset. One thing that can be noticed is the histogram for this column shows a bar at position 0, indicating many 0 values in the initial data. The value of 0 in Glucose, blood pressure, skin thickness, Insulin, and BMI in general is not possible, so it will be filled later. At the same time, for the pregnancies, Diabetes Pedigree Function, Age, and Outcome columns, there are no significant 0 values, and their distribution looks more natural. The distribution of pregnancies shows that most participants have a low number of pregnancies. Age shows that most participants are in the younger to middle age (20-50 years). The outcome is binary data (0 and 1), which indicates whether someone has diabetes or not.
Figure 3. Data distribution
Filling missing values using KNN imputer. The approach is a missing value filling method that replaces missing values with the average of several nearest neighbors based on other features in the dataset. Using k=10, this method determines the ten samples that are most similar to those with missing values based on Euclidean Distance calculations.
If there are missing values in the BMI column, KNN will look for ten samples with complete BMI values and the closest distance based on other features, such as Glucose and Blood Pressure. Once the ten nearest neighbors are found, the missing values are filled in with the average BMI of the ten samples. This handle is rehashed for each lost value within the dataset until there are no more blank values. This method's power is capturing relations between the features so that it performs better than mean or median imputation for missing values. Upon imputing missing values, another plot with the data distribution is presented again in Figure 3 (b). The diagram reveals no 0 values in the Glucose, Blood Pressure, Skin Thickness, Insulin, and BMI columns, and the data distribution appears more balanced.
Next, a heatmap is presented before the missing values are filled, which helps visualize the relationships between variables, as shown in Figure 4 (a). The heatmap values range from -1 to +1, where 1 indicates a strong correlation between variables, meaning an increase in one variable leads to a similar increase. Figure 4 (b) shows that after filling in the missing values, the correlation between attributes and the target outcome has improved. Specifically, Blood Pressure, Skin Thickness, and Insulin correlations have significantly increased. For instance, the correlation between Blood Pressure and the outcome, which was initially 0.065, has risen to 0.17. Similarly, the correlation between Skin Thickness and the outcome has increased from 0.072 to 0.28, and the correlation between Insulin and the outcome has increased from 0.13 to 0.34. The correlation between Glucose and the outcome has improved from 0.45 to 0.5, and the correlation between BMI and the outcome has increased from 0.29 to 0.31. These changes in the heatmap values demonstrate that filling in the missing values effectively and positively impacted the resulting outcomes.
Figure 4. Heatmap correlation diagram
3.2 Machine learning model
The accuracy graph of the ten models is displayed to compare the accuracy value of each model. As seen in Figure 5, LR has the highest accuracy at 77.73%, followed by SVM and LDA with accuracy values of 76.95%, respectively. The model with the lowest accuracy is DT, which has an accuracy of 71.73%.
Figure 5. Accuracy score
The precision graph for the ten models is presented to compare the precision values of each model. Precision evaluates the accuracy of a model in predicting the positive class, specifically the percentage of diabetes predictions that correctly identify diabetic patients. As seen in Figure 6, LR achieves the highest precision at 72.9%, followed closely by SVM and LDA, with 72.27% and 72.24%, respectively. The model with the lowest precision is DT, with a precision of 59.33%.
Figure 6. Precision score
The recall graph for the ten models compares the recall values. Recall measures how well a model detects the positive class. That is, how many were correctly predicted from all the positive classes. Figure 7 shows that KNN achieves the highest recall at 63.42%, followed by Naïve Bayes at 62.68%. The model with the lowest recall is QDA, with a recall of 53.72%.
Figure 7. Recall score
The F1-score graph of ten models is shown to compare the F1-score value of each model. It provides a balance between the two metrics. Figure 8 shows that LR has the highest F1-score at 65.04%. NB and XGBoost score 63.56% and 63.53%, respectively. The model with the lowest F1-score F1-score is QDA, with a value of 57.72%.
Figure 8. F1-score
The ROC graph is shown in Figure 9 to see the TPR and FPR values and the AUC. The ROC-AUC curve assesses the performance of a classification model across different thresholds. The ROC curve shows the probability distribution, while AUC measures how well the model differentiates between classes. A higher AUC indicates better classification accuracy between the two classes, with a higher value signifying a more reliable model, particularly in distinguishing between individuals with and without a disease in medical diagnoses. We can see the result for ROC-AUC in Figure 9. LDA has the highest AUC value at 83.9%, followed by LR and RF with AUC values of 83.86% and 82.83%, respectively. The model with the lowest AUC is DT, which has an AUC of 74.95%.
Figure 9. ROC-AUC score
Table 2 shows the experimental results. LR and LDA have quite good performance, as can be seen from the AUC values of 83.86% and 83.9% each, with accuracy of 77.73% and 76.95% with precision of 72.9% and 72.24% shows that both are effective for straight-line based classification. Tree-based methods, such as DT XGBoost and RF, perform differently. RF has an AUC value of 82.83%, higher than XGBoost's 81.82% and DT's 74.95%; from the accuracy, XGBoost gives higher results, which is 75.25%, compared to RF, which is only 73.57%, and DT which is only 71.73% indicating that the RF ensemble approach is stronger than individual models. KNN and SVM have good results with AUC of 79.36% and 82,41%, respectively, but SVM is superior in precision, 72.27%, and F1-score, 63.04%, making it a better choice for classification in this dataset. NB has an AUC of 81.98% but has lower precision and recall than other methods. QDA performs less than other methods, especially in recall 53.72% and F1-score 57.72%, which shows its limitations in handling this dataset. ANN produces quite good performance with an accuracy of 75.26%, precision of 66.1%, recall of 60.85%, and F1-score of 63.18%. The LR model with the highest F1-score shows that it is good at detecting diabetes patients, minimizing classification errors, and solving trade-off problems between precision and recall. The LDA model with the highest AUC score shows that the model is good at differentiating diabetes and non-diabetes patients suitable for initial screening or medical decision support systems; however, LDA has lower recall that, is bad in case diabetes detection where FN are dangerous. LDA can be used as an alternative method after LR and SVM. Generally, LR is the leading method based on precision, accuracy, and F1-score. LR is the best choice if a balance between accuracy and precision is paramount. On the other hand, if the main priority is to detect more positive cases of diabetes, then KNN is the best choice, as it has the highest recall value while other algorithms can be selected according to needs, such as interpretability or efficiency.
Table 2. The performance metrics for all classification methods.
|
|
LR |
DT |
RF |
KNN |
SVM |
NB |
ANN |
LDA |
QDA |
XGB |
|
Accuracy |
77.73 |
71.73 |
73.57 |
74.35 |
76.95 |
74.60 |
75.26 |
76.95 |
72.66 |
75.25 |
|
Precision |
72.90 |
59.33 |
63.86 |
63.55 |
72.27 |
65.12 |
66.10 |
72.24 |
62.71 |
65.04 |
|
Recall |
59.34 |
57.40 |
57.81 |
63.42 |
56.35 |
62.68 |
60.85 |
57.11 |
53.72 |
62.26 |
|
F1-score |
65.04 |
57.76 |
60.37 |
63.38 |
63.04 |
63.56 |
63.18 |
63.39 |
57.72 |
63.53 |
|
AUC |
83.86 |
74.95 |
82.83 |
79.36 |
82.41 |
81.98 |
82.26 |
83.90 |
79.81 |
81.82 |
This study assessed and compared the performance of ten machine learning algorithms for early diabetes prediction using the Pima Indians Diabetes Dataset. LR achieved the highest accuracy, 77.73%, precision, 72.9%, and strong F1-score, 65.04%, along with a notable AUC of 83.86%. DT had the lowest performance across most metrics, including a low F1-score F1-score of 57.76%. RF performs better than DT with F1-score of 60.37%. XGBoost outperformed DT and RF, with a higher F1-score of 63.53%. KNN showed average performance, with precision at 63.55% but high recall at 63.42%. SVM also performed well, with precision at 72.27% and an F1-score of 63.04%, though the recall was relatively low at 56.35%. NB had decent results, with precision at 65.12% and recall at 62.68%. LDA performed similarly to LR, with precision at 72.24% and AUC of 83.9%. QDA had a lower precision of 62.71% compared to LDA and the lowest recall of 53.72%, with an F1-score of 57.72%.
For future research, it is possible to address the limitations of this study and explore additional techniques to enhance the performance and applicability of the machine learning models for this case. One key area for improvement is optimizing hyperparameter tuning, as fine-tuning model parameters can lead to better generalization and performance across different datasets. Additionally, feature selection techniques should be further investigated to identify the most relevant predictors and reduce the complexity of models while maintaining high accuracy. Another crucial direction is expanding the dataset size and diversity by incorporating more comprehensive and balanced datasets. This can help improve model robustness and reduce potential biases. Moreover, integrating deep learning algorithms potentially leads to higher predictive accuracy. By focusing on these improvements, future research can contribute to developing more reliable, interpretable, and effective machine learning models for early diabetes detection, ultimately benefiting healthcare applications and decision-making.
The authors would like to thank Sebelas Maret University and its research and community service institution (LPPM) for their support through multi-year research funding, as outlined in agreement letters No.: 254/UN27.22/PT.01.03/2022 and 228/UN27.22/PT.01.03/2023.
|
LR |
Logistic Regression |
|
DT |
Decision Tree |
|
RF |
Random Forest |
|
SVM |
Support Vector Machine |
|
NB |
Naive Bayes |
|
ANN |
Artificial Neural Networks |
|
KNN |
K-Nearest Neighbor |
|
LDA |
Linear Discriminant Analysis |
|
QDA |
Quadratic Discriminant Analysis |
|
XGB |
XGBoost |
|
ROC |
Receiver Operating Characteristic |
|
AUC |
Under the Curve |
|
TPR |
True Positive Rate or Recall |
|
FPR |
False Positive Rate |
[1] Misra, A., Gopalan, H., Jayawardena, R., Hills, A.P., Soares, M., Reza‐Albarrán, A.A., Ramaiya, K.L. (2019). Diabetes in developing countries. Journal of Diabetes, 11(7): 522-539. https://doi.org/10.1111/1753-0407.12913
[2] Vaishali, R., Sasikala, R., Ramasubbareddy, S., Remya, S., Nalluri, S. (2017). Genetic algorithm based feature selection and MOE Fuzzy classification algorithm on Pima Indians Diabetes dataset. In 2017 International Conference on Computing Networking and Informatics (ICCNI), Lagos, Nigeriam, pp. 1-5. https://doi.org/10.1109/ICCNI.2017.8123815
[3] Emerging Risk Factors Collaboration. (2010). Diabetes mellitus, fasting blood glucose concentration, and risk of vascular disease: A collaborative meta-analysis of 102 prospective studies. The Lancet, 375(9733): 2215-2222. https://doi.org/10.1016/S0140-6736(10)60484-9
[4] Cho, N.H., Shaw, J.E., Karuranga, S., Huang, Y., da Rocha Fernandes, J.D., Ohlrogge, A.W., Malanda, B.I.D.F. (2018). IDF diabetes Atlas: Global estimates of diabetes prevalence for 2017 and projections for 2045. Diabetes Research and Clinical Practice, 138: 271-281. https://doi.org/10.1016/j.diabres.2018.02.023
[5] Saeedi, P., Petersohn, I., Salpea, P., Malanda, B., Karuranga, S., Unwin, N., et al. (2019). Global and regional diabetes prevalence estimates for 2019 and projections for 2030 and 2045: Results from the International Diabetes Federation Diabetes Atlas. Diabetes Research and Clinical Practice, 157: 107843. https://doi.org/10.1016/j.diabres.2019.107843
[6] Sisodia, D., Sisodia, D.S. (2018). Prediction of diabetes using classification algorithms. Procedia Computer Science, 132: 1578-1585. https://doi.org/10.1016/j.procs.2018.05.122
[7] Khanam, J.J., Foo, S.Y. (2021). A comparison of machine learning algorithms for diabetes prediction. ICT Express, 7(4): 432-439. https://doi.org/10.1016/j.icte.2021.02.004
[8] El Massari, H., Sabouri, Z., Mhammedi, S., Gherabi, N. (2022). Diabetes prediction using machine learning algorithms and ontology. Journal of ICT Standardization, 10(2): 319-337. https://doi.org/10.13052/jicts2245-800X.10212
[9] Mujumdar, A., Vaidehi, V. (2019). Diabetes prediction using machine learning algorithms. Procedia Computer Science, 165: 292-299. https://doi.org/10.1016/j.procs.2020.01.047
[10] Talukder, M.A., Islam, M.M., Uddin, M.A., Kazi, M., Khalid, M., Akhter, A., Ali Moni, M. (2024). Toward reliable diabetes prediction: Innovations in data engineering and machine learning applications. Digital Health, 10: 20552076241271867. https://doi.org/10.1177/20552076241271867
[11] Hasan, M.K., Alam, M.A., Das, D., Hossain, E., Hasan, M. (2020). Diabetes prediction using ensembling of different machine learning classifiers. IEEE Access, 8: 76516-76531. https://doi.org/10.1109/ACCESS.2020.2989857
[12] Maniruzzaman, M., Kumar, N., Abedin, M.M., Islam, M.S., Suri, H.S., El-Baz, A.S., Suri, J.S. (2017). Comparative approaches for classification of diabetes mellitus data: Machine learning paradigm. Computer Methods and Programs in Biomedicine, 152: 23-34. https://doi.org/10.1016/j.cmpb.2017.09.004
[13] Tan, J.K., Quan, L., Salim, N.N.M., Tan, J.H., Goh, S.Y., Thumboo, J., Bee, Y.M. (2024). Machine learning-based prediction for high health care utilizers by using a multi-institutional diabetes registry: Model training and evaluation. JMIR AI, 3(1): e58463. https://doi.org/10.2196/58463
[14] Jiang, L., Xia, Z., Zhu, R. Gong, H., Wang, J., Li, J., Wang, L. (2023). Diabetes risk prediction model based on community follow-up data using machine learning. Preventive Medicine Reports, 35: 102358. https://doi.org/10.1016/j.pmedr.2023.102358
[15] Nissar, I., Mir, W.A., Shaikh, T.A., Areen, T., Kashif, M., Khiani, S., Hussain, A. (2024). An Intelligent healthcare system for automated diabetes diagnosis and prediction using machine learning. Procedia Computer Science, 235: 2476-2485. https://doi.org/10.1016/j.procs.2024.04.233
[16] Bhat, S.S., Banu, M., Ansari, G.A., Selvam, V. (2023). A risk assessment and prediction framework for diabetes mellitus using machine learning algorithms. Healthcare Analytics, 4: 100273. https://doi.org/10.1016/j.health.2023.100273
[17] Alkalifah, B., Shaheen, M.T., Alotibi, J., Alsubait, T., Alhakami, H. (2024). Evaluation of machine learning-based regression techniques for prediction of diabetes levels fluctuations. Heliyon, 11(1): e41199. https://doi.org/10.1016/j.heliyon.2024.e41199
[18] Asmara, R.A., Rahutomo, F., Hasanah, Q., Rahmad, C. (2017). Chicken meat freshness identification using the histogram color feature. In 2017 International Conference on Sustainable Information Engineering and Technology (SIET), Malang, Indonesia, pp. 57-61. https://doi.org/10.1109/SIET.2017.8304109
[19] Pratiwi, I.Y.R., Asmara, R.A., Rahutomo, F. (2017). Study of hoax news detection using naïve bayes classifier in Indonesian language. In 2017 11th International Conference on Information & Communication Technology and System (ICTS), Surabaya, Indonesia, pp. 73-78. https://doi.org/10.1109/ICTS.2017.8265649
[20] Rahutomo, F., Huda, M.M., Asmara, R.A., Setiawan, A., Septarina, A.A. (2019). The experiment of text–Number combination forecasting. Journal of Physics: Conference Series, 1402(6): 066037. https://doi.org/10.1088/1742-6596/1402/6/066037
[21] Musthafa, M.B., Ngatmari, N., Rahmad, C., Asmara, R. A., Rahutomo, F. (2020). Evaluation of university accreditation prediction system. IOP Conference Series: Materials Science and Engineering, 732(1): 012041. https://doi.org/10.1088/1757-899x/732/1/012041
[22] Romadhon, F., Rahutomo, F., Hariyono, J., Sutrisno, S., Sulistyo, M.E., Ibrahim, M.H., Pramono, S. (2023). Food image detection system and calorie content estimation using yolo to control calorie intake in the body. E3S Web of Conferences, 465: 02057. https://doi.org/10.1051/e3sconf/202346502057
[23] Sulistyo, M.E., Sutrisno, S., Widyaningrum, S., Rahutomo, F., Ramelan, A., Ibrahim, M.H., et al. (2023). Web-based health service management information system development with the linear sequential model method. E3S Web of Conferences, 465: 02066. https://doi.org/10.1051/e3sconf/202346502066