Ibrahim Mahmood Ibrahim*![]() | Amira Bibo Sallow
| Amira Bibo Sallow![]()
© 2024 The authors. This article is published by IIETA and is licensed under the CC BY 4.0 license (http://creativecommons.org/licenses/by/4.0/).
OPEN ACCESS
Smartphones based on the Android operating system are increasingly popular due to their multifunctional capabilities in various fields. However, these functions have also encouraged intruders to develop applications that perform malicious actions, including stealing sensitive data, encrypting files for ransom, and sending unauthorized SMS messages without user consent. In this study, we proposed a new and comprehensive dataset containing 32,170 samples distributed equally between malicious and benign applications developed on different API levels. The dataset includes two categories of features: permissions and intents. We also proposed a new feature selection method called Discriminative Feature Ranking-Mutual Information (DFR-MI) which selects optimal features from the more frequent features in the dataset and this helped the predictive model to achieve high performance. Nine machine-learning algorithms were tested, and the results show that our dataset outperforms the Drebin dataset by at least 2.22% in combining permissions with intents for detecting malicious apps. Additionally, the DFR-MI algorithm obtained better results in selecting features and took less time than the mutual information algorithm. Among all tested machine-learning algorithms, the random forest algorithm achieved high scores in terms of accuracy, precision, recall, and F1 score, which were 98.52%, 98.62%, 98.41%, and 98.52%, respectively. Our proposed method enhances mobile security by scrutinizing an app's declared permissions and communication patterns between its components. This approach allows for a more comprehensive understanding of an app's behavior, enabling early detection of potential threats generated from Android applications.
malicious Apps, feature selection, static features, permissions, intents, API levels, machine learning, random forest algorithm
Smartphone usage has become increasingly common in our daily lives and can perform various tasks such as sending SMS, online shopping, entertainment, and financial transactions. The popularity of Android systems has made it easier for developers to build apps and offer services, but it has also made it easier for intruders to build apps that can cause harm [1]. Malicious apps include viruses, worms, backdoors, spyware, Trojan horses, and rootkits. These apps can misuse device resources and steal data, damage file systems, cause SMS fraud, and lead to premium dialers [2]. Recently, the number of malicious apps has increased significantly, with the AV-TEST security institute reporting that Kaspersky detected 5.7 million malware Android packages in 2020 [3].
To prevent attacks, many security vendors provide tools to protect mobile devices and user data, such as antivirus software and firewalls. However, these tools work based on signatures and can only detect known malware. These tools require frequent database updates to detect new malware apps; this process can be resource-intensive, potentially impacting the overall system performance [4]. To build a model that can identify recent attacks, researchers have proposed using intelligent methods to detect malware using machine-learning algorithms [5].
Android apps include several features, such as permissions, intent, API calls, hardware features, system calls, and network traffic. Based on these features, the app can be identified as malicious [6]. In general, three main techniques can be used for analyzing the behavior of an Android app and extracting essential features: static, dynamic, and hybrid analysis. Features such as permissions, intent, and API calls can be extracted without executing an application. However, dynamic analysis requires running an application on a virtual machine to extract features like system calls and network traffic [5-7]. The hybrid analysis combines the features of both static and dynamic analysis [8].
Earlier research has shown that feature selection is crucial in building machine-learning models. Researchers use feature selection to remove duplicate or irrelevant features and refine essential features to enhance model performance [9]. However, hackers upgrade their applications along with the Android API levels. Many researchers still analyze applications written on older API levels. There is a difference in the features available at different API levels. For example, API level 28 includes 325 permissions, while API level 15 contains only 166 permissions. Additionally, several distributors create custom permissions to access data, hardware resources, and Web APIs. An increasing number of permissions opens up more opportunities for abuse. Several studies are based on the MalGenome and Drebin datasets for malware analysis, which are based on samples collected between 2010 and 2012 and fall between API levels 9 and 18 [10].
In this research, we introduce an innovative feature selection technique designed to enhance the capability of machine-learning algorithms in effectively distinguishing between malicious and benign Android applications. Furthermore, our developed dataset collected samples from diverse sources, ensuring comprehensive coverage of both older and newer specimens across a wide range of API levels. The main contributions of this work can be summarized as follows:
1. Feature Selection Method: The study introduces a novel feature selection method named Discriminative Feature Ranking-Mutual Information (DFR-MI), which effectively selects features and aids in constructing a model capable of distinguishing between malicious and benign Android applications. This method improves upon the mutual information algorithm in terms of both time and accuracy. The DFR-MI selects the informative features from the most frequent features in the dataset instead of selecting the informative features regardless of their frequency in the dataset as happens with the mutual information algorithm.
2. Comprehensive Dataset: The study develops a large and well-balanced dataset consisting of 32,170 samples and 209 features. The dataset includes permissions (both native and custom) along with intents, providing a comprehensive representation of Android applications.
3. Improved Detection Accuracy: The proposed approach, combining permissions and intents with machine learning techniques, achieves high accuracy in detecting malicious Android apps. The results surpass those obtained using the Drebin dataset, demonstrating the effectiveness of the proposed methodology.
4. Random Forest Algorithm: The study evaluates nine machine learning algorithms and identifies the random forest algorithm as a highly performant choice. It achieves high scores in accuracy, precision, recall, and the f1 score when combined with the proposed feature selection method.
5. Lightweight Models: The study highlights the importance of using lightweight models for mobile devices. The proposed models offer faster training and inference times, addressing battery life concerns and time constraints associated with mobile devices.
The remainder of the paper is structured as follows: Section 2 includes the related work on Android malware detection and the techniques used. Section 3 describes the methodology of the proposed system. Section 4 presents the experiments performed in this study. Section 5 provides conclusion.
The surge in mobile device usage and its applications has brought about a parallel increase in the presence of malicious apps. The malicious apps pose many threats such as stealing sensitive user data, misusing applications, and sending short messages to premium numbers. Therefore, researchers developed many models for defense and mitigate the risk of malicious apps. Generally, analyzing the behavior of apps can be categorized into static, dynamic, and hybrid analyses. Static methods can extract static features from an app without executing the app, such as permissions [11, 12], intent [13], API calls [14, 15], and opcodes [16, 17]. Dynamic methods detect an app's behavior by monitoring system calls [18, 19], memory utilization, CPU utilization [20], and network traffic [21]. Hybrid methods combine static and dynamic features [22]. Those features are used to distinguish malicious apps from benign ones.
The authors in the study [23] developed a hybrid malware detection system named NTPDroid that extracts network traffic features and permissions from applications. The proposed model employed the FP-Growth technique to generate frequent patterns existing in malicious datasets and benign datasets. The results showed that combining network traffic features with permissions improved detection rates compared to either network traffic features or permissions used alone. The authors in the study [24] presented an intrusion detection system that detects and classifies malicious applications based on analyzing permissions. The proposed method works in three steps: i) extracting features from Android apps, ii) using machine learning for training on the extracted features, and iii) assessing the model's performance using a testing dataset like Drebin and AndroTracker datasets. Various ML algorithms have been evaluated for detecting and classifying malicious applications. For the detection of malware applications, kernel logistic regression achieved the highest 98.2% accuracy. In the study [25], the authors developed a method named Deep-Intent, an online Intrusion Detection System (IDS) that uses an E2E DL implementation for supervised learning and unsupervised feature engineering and only uses implicit intent as a feature. The experiment findings reveal that the presented intent-based IDS could detect malware application software with an AUC of 81% and an accuracy of 77.2%. In the research [20], the authors developed a new Android host-based IDPS (HIDROID) that runs entirely on a mobile device. The HIDROID periodically gathers feature samples at run time from many resources that reflect the utilization of mobile resources like CPU, battery, memory, and other features. The detection engine uses machine learning and statistical methods to develop a model based on data to support benign behaviors. Any observation that fails to meet this model raises an alert, and the prevention agent takes adequate countermeasures to reduce the risk. Experimental test findings reveal that HIDROID can learn from regular activity and distinguish it from abnormal with a highly promising precision of up to 91%. The researchers in the study [26] proposed a lightweight intrusion detection system that detects zero-day attacks efficiently named DroidLight. DroidLight is based on the author's probability distribution and one-class classification. The classification models learn their regular CPU use and network traffic for every mobile application. If there is a significant deviation from the normal pattern, the model raises an intrusion alarm. A real user who interacted with it using three self-developed apps evaluated DroidLight on a real device. DroidLight could identify mobile malware with an accuracy spanning 93.3% to 100%. The study [13] proposed a new static method for detecting Android malware based on intents and permissions. Initially, the presented model used Information Gain to rank both permissions and intents and then combined permissions and intents to find the best set that could provide better accuracy using various machine learning algorithms. The results of the experiments showed that the proposed methods of combining permissions and intents improved detection accuracy over permissions and intents separately. The study [27] proposed a classification mechanism for Android applications that combines dynamic packet analysis with static permissions. First, through static analysis, the proposed system collects static information from Android applications and classifies them as benign or malicious using machine learning. Furthermore, excessive dynamic data-gathering time is avoided by filtering out safe apps. The malware's network traffic is then employed in the dynamic analysis phase to extract many information features, and then machine learning is used to classify the malware family. The model's objective is to limit the number of apps requiring dynamic data collection, which minimizes analysis time overall. After experiments, the results show that the model can achieve high accuracy and reach 96%. The authors [28] proposed the DATDroid method for Android malware detection. DATDroid collects dynamic features such as CPU usage, memory usage, network traffic, system call errors, and system call time. The DATDroid approach achieved an accuracy of 91.7%. The study [29] presented a new approach based on Recurrent Neural Networks (RNN) for identifying malware in Android applications. The suggested method extracts two sets of features, API calls, and permissions from the Android application. According to the experimental results, the RNN achieved a high accuracy of 98.2% on the CICAndMal2017 database. The researchers [30] proposed a new model based on permissions extracted from APK files. The proposed model detects malicious apps based on suspicious permissions. The system extracts essential features such as permissions, permission rates, and small file sizes from the 10000 applications collected from virus share and Google Play. With SVM, the model achieved 89.2% accuracy. The study [31] developed a novel technique for identifying malware in Android apps utilizing the frequent pattern (FP) growth algorithm. This algorithm is used to find more frequent patterns of feature coexistence at different levels. The authors also made several datasets of co-existing features. These included a permissions-coexisting dataset, an API-coexisting dataset, and permission with an API-coexisting dataset. Several machine-learning algorithms were used for testing, and the results show that the random forest, support vector machine, and decision tree got high accuracy and reached 98% using the permission-API co-existence dataset in the CIC_MALDROID2020.
Despite the progress made by the prior researchers in employing diverse methods and achieving promised results, certain limitations persist in their studies. Common limitations include reliance on outdated, imbalanced, and non-comprehensive datasets. Furthermore, the methods employed for selecting informative features often entail high processing demands and are time-consuming. To overcome these challenges, the authors intend to develop a balanced and comprehensive dataset, encompassing samples from various API levels for both malicious and benign applications. Additionally, a feature selection method will be devised to maximize accuracy while minimizing the time required for feature selection.
The primary objective of this study is to construct a robust and efficient machine-learning model that uses permissions and intents to detect malware on Android devices. Figure 1 illustrates the general proposed methodology of the study.
Figure 1. Schematic diagram of the proposed methodology
Figure 2. Main steps for preparing a dataset
Table 1. Details of collected samples
|
Database |
Type of Samples |
Sample Classification |
No. of Samples |
Date |
|
Androzoo |
Malware |
Trojan, Riskware, Adware, SMS |
3372 |
2017-2020 |
|
Drebin |
Malware |
79 different family |
3000 |
2010-2012 |
|
Android Botnet dataset |
Malware |
14 Botnet families |
1800 |
2010-2014 |
|
CIC-InvesAndMal2109 |
Malware |
Ransomware (10 Families), Scareware (11 families) |
213 |
2019 |
|
CICMalDroid 2020 |
Malware |
Adware, Banking, SMS, Riskware |
7500 |
2017-2018 |
|
Malware Bazaar |
Malware |
Spyware, Trojan, Banker |
200 |
2020-2022 |
|
Androzoo |
Benign |
Not mentioned |
11269 |
2011-2020 |
|
Google Play |
Benign |
Art and design, Beauty, Book, Business, Education, Financial Communication, Entertainment, Health, Medical, Music and Audio, News, hoping, Social. |
4816 |
2019-2022 |
|
Total |
|
|
32170 |
|
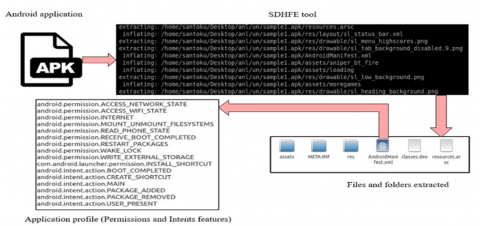
Figure 3. Process of sample analysis and feature extraction
3.1 Preparing dataset
A dataset represents a structured collection of data samples specifically assembled and prepared for training and testing machine learning models to classify Android applications as either benign or malicious. Figure 2 illustrates the main steps for creating a dataset.
3.1.1 Collecting Android app samples
This study collected samples from various databases, including Drebin (https://www.sec.tu-bs.de/~danarp/drebin/), Android Botnet dataset (https://www.unb.ca/cic/datasets/android-botnet.html), CIC-InvesAndMal2109 (https://www.unb.ca/cic/datasets/invesandmal2019.html), CICMalDroid 2020 (https://www.unb.ca/cic/datasets/maldroid-2020.html), Malware Bazaar (https://bazaar.abuse.ch/browse/tag/apk/), Google Play (https://play.google.com/store/apps), and AndroZoo databases (https://androzoo.uni.lu/). The malware sample size ranged from a minimum of about 10 kilobytes to a maximum of 50 megabytes, while the benign app size ranged from a minimum of 11 kilobytes to a maximum of 236 megabytes. Table 1 provides more information about the malware and benign samples.
3.1.2 Sample analysis
After collecting samples of both malware and benign apps, the researchers utilized the Static Dynamic Hybrid Feature Extraction (SDHFE) tool to reverse engineer and decompile them into their source files. The SDHFE tool is a lightweight and automated tool developed by the authors to analyze Android applications and extract features from them. It operates on the Linux operating system. The SDHFE tool is easy to use, allowing researchers to effortlessly generate profiles from the analyzed applications based on selected features. It can extract permissions and intents from manifest files, APIs and opcodes from source code, and system calls from the application's behavior during execution. Notably, it possesses the capability to efficiently analyze and generate profiles for a bulk of applications without requiring human intervention. Furthermore, researchers can leverage this tool to generate profiles that include features from many sources at the same time, such as generating profiles based on permissions and APIs together. For this study, we utilize this tool to extract static features such as permissions and intents.
3.1.3 Feature extraction
The feature extraction process begins promptly after decompiling each sample. The SDHFE tool extracts features primarily from the AndroidManifest.xml file, serving as the main source, which generates a profile for each analyzed sample. Our analysis predominantly focuses on two sets of static features: FS1, representing permissions (both native and custom), and FS2, representing intents. Throughout our study, we extracted over 500,000 features associated with both benign and malware samples. The process of analyzing and extracting features from a single sample using the SDHFE tool is depicted in Figure 3.
Algorithm 1. Preparing dataset for permissions and intents
|
Input: Malware and Benign samples Output: Malware and Benign Dataset Start: Parameter Initialization: ProfileList =[], Featurelist =[], FilterList =[], Fvlist =[], Index=0, rowindex =0, DSCSV = []. For each sample $\in$ Malware, Benign do: Decompile sample using the SDHFE tool ProfileList. Append (profile for sample based on features extracted from the AndroidManifest.xml) End For For each profile $\in$ ProfileList do: For each feature $\in$ profile do: Featurelist[index] =feature Increment index by one End For End For Remove duplicated features from Featurelist and filter the feature that rarely appears in samples For each feature $\in$ Featurelist do: FilterList. Append (feature) if feature Not in FilterList And counting (feature) >=th Where th is a threshold representing the number of times the feature appears in all samples End For DSCSV [rowindex]. Append (FilterList ) Generate a Feature vector and append it to a dataset For each profile $\in$ ProfileList do: Fvlist. Clear for each profile, indexfv=0, increment rowindex by one For each feature $\in$ FilterList do: If feature $\in$ profile Fvlist [indexfv] =1 Increment indexfv by one Else Fvlist [indexfv] =0 Increment indexfv by one End If End For If profile $\in$ malware sample Fvlist [indexfv +1] =1 Else Fvlist [indexfv +1] =0 End If DSCSV [rowindex]. Append (Fvlist) End For End |
3.1.4 Preprocessing
The researcher has performed two functions on the extracted data. The first function scans all profiles generated in the feature extraction phase to collect features and keeps them in a single list called Featurelist. The second function reads the Featurelist and eliminates redundant features from it. The redundant features are either duplicated more than once in the Featurelist or rarely appear in Android samples. The remaining features were saved into a new list called FilterList and appended to the dataset as a header of columns.
3.1.5 Feature vector
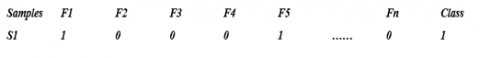
After combining the two feature sets FS1 $\cup $ FS2, a binary feature vector Fv = (f1, f2, …,fn) will be generated for each sample according to Eq. (1).
$f_i=\left\{\begin{array}{l}1, \quad \text { if the } i^{\text {th }} \text { feature is presence } \\ 0, \quad \text { if the } i^{\text {th }} \text { feature is absent }\end{array}\right.$ (1)
The features (permission and intent) are encoded with 1 to signify their presence in an Android application, and 0 if absent. For classification, a class label is added to each feature vector 1 denotes the "malware" class, while 0 denotes the "benign" class. These binary feature vectors are stored in a CSV file for efficient data organization and processing. Figure 4 provides an example of such a feature vector, displaying binary representations of features along with their respective class labels. The dataset preparation process, encompassing feature extraction and feature vector creation, is detailed in Algorithms 1.
Figure 4. Feature vector
3.2 Feature selection
Feature selection is one of the significant steps in machine learning models. Selecting relevant features and removing irrelevant or redundant features improves the accuracy of the predicted model, reduces training time, and decreases the overfitting problem. This study proposes a novel approach called Discriminative Feature Ranking-Mutual Information (DFR-MI), which combines the mutual information algorithm with the discriminative feature ranking method to further improve the accuracy of the model. The proposed approach utilizes two levels and focuses on selecting the most significant features that effectively differentiate between malicious and benign applications. To provide a comprehensive understanding, the study introduced key definitions that will be used throughout each level. Let S be a set of malware and benign samples in the dataset and denoted by:
$\mathrm{S}=\left\{\mathrm{s}_1, \mathrm{~s}_2, \ldots, \mathrm{s}_{\mathrm{r}}, \ldots, \mathrm{s}_{|\mathrm{S}|}\right\}$ (2)
where, sr represents the rth sample in S and |S| represents the total samples in the dataset.
Let F be a set of features used by malware and benign samples in the dataset and denoted by:
$\mathrm{F}=\left\{\mathrm{f}_1, \mathrm{f}_2, \ldots, \mathrm{f}_{\mathrm{r}}, \ldots, \mathrm{f}_{|\mathrm{F}|}\right\}$ (3)
where, fr represents the rth feature and |F| represents the total features in the dataset.
Let C be a set of the class labels in the dataset and denoted by:
C= {c1, c2}, here we have only two class labels: malware and benign.
Let CF represent candidate features selected from level one and pass to level two.
Definition 1: (Feature Frequency: FF) Calculate the frequency of each feature in malware and benign samples in the dataset. Because the presence of each feature in a specific class is set to 1, and the absence is set to 0. We can find the frequency of each feature as follows:
$F F_{r \in M}=\sum_{s=1}^{|S|} f_r$. value ${ }_s, r=1,2,3, \ldots,|F|$ for malware samples (4)
$F F_{r \in B}=\sum_{s=1}^{|S|} f_r$. value $_s, r=1,2,3, \ldots,|F|$ for benign samples (5)
Definition 2: To know the feature that appears more in malware or benign samples, calculate the difference for each feature according to the following equation:
$D F_r=F F_{r \in M}-F F_{r \in B}$ (6)
where, Dfr means the frequency difference feature at the r index, the Dfr result will be a positive, negative, or zero value.
Positive value: mean the feature is more presence in the malware samples.
Negative value: mean the feature is more presence in the benign samples.
Zero value: indicate the presence of feature are equal in malware and benign samples.
3.2.1 Level one: Discriminative Feature Ranking (DFR)
At this level, the proposed algorithm uses a statistical method to identify whether a specific feature is utilized more frequently in benign or malware apps in two steps. In the first step, use Eqs. (4) and (5) to count the frequency of each feature in malware and benign apps separately. Although this step provides valuable insights into which features are used in each category of apps, it may not help us to distinguish malicious apps from benign ones. For example, Table 2 shows the top 10 features that mostly appeared in malicious and benign samples in our dataset. The 'android.permission.INTERNET' feature appeared 15594 times in malicious samples, which is nearly 97% of malicious samples, and 15536 times in benign samples, which is nearly 97% of benign samples. The same applies to the 'android.permission.ACCESS_WIFI_STATE' feature, the percentage of this feature is very close in both categories. These features may not be at the top level for distinguishing malicious from benign apps. Therefore, the features need more analysis.
In the second step, using Eq. (6) to select more important features by subtracting the frequencies of each feature that appears in malicious apps from the frequencies of the same feature that appear in benign apps and store the result with the feature name inside a new dataframe called Discriminative Feature (DF) dataframe. This procedure is robust at identifying whether a particular feature is more frequently found in benign or malicious applications. The rank of features changes in this step and is different from step 1, as shown in Table 3.
Generally, level one provides insight into the features that are more utilized by malicious and benign apps. However, it is not necessary for all frequent features to be more informative in the prediction model because feature counting only considers the frequency of individual features across a dataset, it doesn't take into account the relationships or dependencies between features. This can lead to the inclusion of irrelevant or redundant features in the model. Therefore, we consider level one to works as a filter based on the specific thresholds to narrow down the features to the most common ones in both categories. This helps to reduce the search space and computational complexity at the next level.
Table 2. Top 10 features in malware and benign samples after the first step of DFR
|
# |
Top 10 Malware Feature |
Freq. |
Top 10 Benign Feature |
Freq. |
|
1 |
android.permission.INTERNET |
15594 |
android.permission.INTERNET |
15536 |
|
2 |
android.intent.category.LAUNCHER |
15398 |
android.permission.ACCESS_NETWORK_STATE |
14952 |
|
3 |
android.permission.READ_PHONE_STATE |
14688 |
android.permission.WAKE_LOCK |
10990 |
|
4 |
android.permission.WRITE_EXTERNAL_STORAGE |
12016 |
android.intent.category.LAUNCHER |
10850 |
|
5 |
android.permission.ACCESS_NETWORK_STATE |
11272 |
android.permission.WRITE_EXTERNAL_STORAGE |
10476 |
|
6 |
android.intent.action.BOOT_COMPLETED |
10478 |
android.intent.action.BOOT_COMPLETED |
7778 |
|
7 |
android.permission.SEND_SMS |
9090 |
android.intent.action.VIEW |
7752 |
|
8 |
android.permission.RECEIVE_BOOT_COMPLETED |
8038 |
android.permission.RECEIVE_BOOT_COMPLETED |
7706 |
|
9 |
android.permission.RECEIVE_SMS |
7622 |
android.permission.ACCESS_WIFI_STATE |
7202 |
|
10 |
android.permission.ACCESS_WIFI_STATE |
7276 |
android.permission.VIBRATE |
7072 |
Table 3. Top 10 features in malware and benign samples after the second step of DFR
|
# |
Top 10 Malware Feature |
Diff. |
Top 10 Benign Feature |
Diff. |
|
1 |
android.permission.READ_PHONE_STATE |
9796 |
android.intent.action.VIEW |
-6630 |
|
2 |
android.permission.SEND_SMS |
8626 |
com.google.android.c2dm.permission.RECEIVE |
-5244 |
|
3 |
android.permission.RECEIVE_SMS |
7076 |
com.android.vending.BILLING |
-5158 |
|
4 |
android.permission.READ_SMS |
6336 |
android.permission.READ_EXTERNAL_STORAGE |
-4678 |
|
5 |
android.intent.category.LAUNCHER |
4548 |
android.permission.WAKE_LOCK |
-4078 |
|
6 |
android.intent.category.HOME |
3898 |
android.intent.action.ACTION_POWER_DISCONNECTED |
-3870 |
|
7 |
android.permission.WRITE_SMS |
3630 |
android.intent.action.TIME_SET |
-3838 |
|
8 |
android.permission.READ_CONTACTS |
3108 |
android.permission.ACCESS_NETWORK_STATE |
-3680 |
|
9 |
com.android.launcher.permission.INSTALL_SHORTCUT |
3076 |
android.intent.action.DEVICE_STORAGE_OK |
-3578 |
|
10 |
android.intent.action.BOOT_COMPLETED |
2700 |
android.intent.action.BATTERY_LOW |
-3518 |
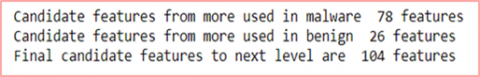
In this study, we have two thresholds, α1 and α2. The value of α1 represents the number of features in F that appear more in malware apps than benign apps. The value of α2 represents the average frequency of all features that most frequently occur in benign samples. The DF dataframe was filtered based on the α1 and α2 and the new features were saved to a new list known as Candidate Features (CF) list. Finally, the CF became an input to the next level. Figure 5 illustrates candidate features from malware and benign samples passed to level two.
Figure 5. Number of candidate features
Table 4. Top 10 features selected by MI algorithm
|
# |
Top 10 Features |
Score |
|
1 |
android.permission.READ_PHONE_STATE |
0.219263 |
|
2 |
android.permission.SEND_SMS |
0.200989 |
|
3 |
android.permission.RECEIVE_SMS |
0.150608 |
|
4 |
android.permission.READ_SMS |
0.123614 |
|
5 |
android.intent.action.VIEW |
0.121097 |
|
6 |
com.android.vending.BILLING |
0.109813 |
|
7 |
com.google.android.c2dm.permission.RECEIVE |
0.078074 |
|
8 |
android.intent.category.LAUNCHER |
0.076952 |
|
9 |
com.google.android.c2dm.permission.RECEIVE |
0.074669 |
|
10 |
android.intent.category.HOME |
0.072773 |
Algorithm 2. Discriminative Feature Ranking-Mutual Information (DFR-MI) feature selection algorithm
|
Input: F is a set of features in the dataset Output: SFList is a set of Selected Features Parameter Initialization: SFList =[], CFList =[], $\alpha=0, \alpha 1=0, \alpha 2=0$, Featurecount =0, CFcf $\in$ BList=[], CFcf $in$ MList=[] DFdataframe =[,], DFindex =0 Start: For each feature $in$ F do: FFfeature $\in M=\sum_{s=1}^{|S|}$ FFfeature $\in B=\sum_{s=1}^{|S|}$ DFdataframe .featurename=feature DFdataframe.value= FFfeature $\in \boldsymbol{M}$ – FFfeature $\in \boldsymbol{B}$ Increment DFindex by one End For For each value $in$ DFdataframe .value do: if (value < 0): $\alpha=\alpha-$ value Increment Featurecount by one End If End For α2= $\alpha /$ Featurecount For each feature, value $in$ (DFdataframe .featurename, DFdataframe .value) do: if value $>\alpha 1$: CFcf $\in$ MList .Append (feature) End If if value $\leq \alpha 2$ CFcf $\in$ BList .Append (feature) End If End For CFList= CFcf $\in$ MList $\cup$ CFcf $\in$ List SFList = top N feature from $\boldsymbol{M I}(\boldsymbol{C F}, \boldsymbol{C})=\sum_{c f_i} \sum_{c_j} p\left(C F=c f_i, C=c_j\right) * \log \frac{p\left(C F=c f_i, C=c_j\right)}{p\left(C F=c f_i\right) * p\left(C=c_j\right)}$ End |
3.2.2 Level two: Mutual Information (MI)
Mutual information is a technique that can be used for weighing variables. It is widely used in machine learning problems to assess the mutual independence of two random variables. The value of MI is a non-negative number that ranges from 0 to 1. The maximum value of MI indicates a strong correlation between the two variables. The value of 0 indicates no correlation between the two variables. The following is the mutual information formula:
$M I(C F, C)=\sum_{c f_i} \sum_{c_j} p\left(C F=c f_i, C=c_j\right) * \log \frac{p\left(C F=c f_i, C=c_j\right)}{p\left(C F=c f_i\right) * p\left(C=c_j\right)}$ (7)
In our study, MI is used to measure the relevance of features received from CF list at the first level. The variable CF indicates whether the cfi appears in an application. C represents the class label of the application belonging to malware or benign application, and p (CF= cfi) indicates the probability that the variable CF is cfi, p(C=ci) represents the probability that the value of C is ci. Based on the basic formula of the MI, the correlation value MI (CF, C) of each feature is obtained. Table 4 represents the top 10 features selected from the mutual information algorithm.
The combination of DFR and MI can help to improve the overall performance of the feature selection process by eliminating redundant features and selecting only significant features for the model. Consequently, this refinement results in more precise predictions and reduces the computational complexity of the model.
In our study, we used windows ten 64-bit operating system machine with Intel(R) Core (TM) i5-2320 CPU @ 3.00GHz, NAVIDIA Quadro 4 GB, and 16 GB of RAM. For processing our data, the GPU was used to accelerate the execution of machine learning algorithms. We implemented our codes on the anaconda platform. The python version is 3, and the basic libraries utilized in this work include pandas, NumPy, sci-kit-learn, TensorFlow, matplotlib, and seaborn.
4.1 Machine learning and splitting dataset
We used nine machine-learning algorithms (RF, DT, SVM, KNN, LR, NB, AdaBoost, Gradient Boosting, and ANN) for training and testing on our dataset to find a good model for detecting malware on the smartphone device. During the learning phase, the variables (hyperparameters) of each algorithm are adjusted with some values. Table 5 illustrates the details of the hyperparameters used for each algorithm.
To improve the performance of these models and lower the risk of overfitting, the mutual information (MI) and DFR-MI algorithms were used to choose important features. On this basis, we conducted two experiments to compare the performance of the two algorithms for feature selection and its effects on the predicate models. In the first experiment, the mutual information algorithm chose 75 features and passed them to nine machine-learning algorithms to train on.
In the second experiment, the same process was followed, but this time the DFR-MI algorithm was used instead of the mutual information algorithm to choose the same number of features. The scores of each experiment are shown in Table 6.
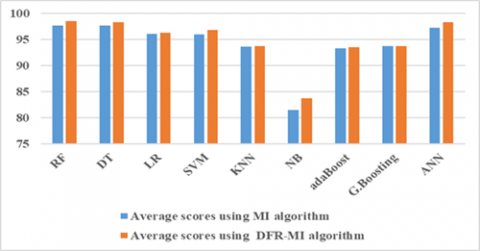
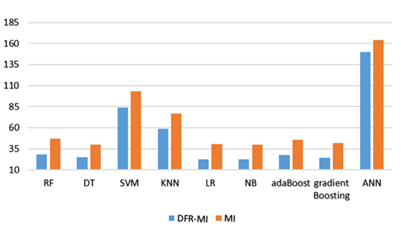
The dataset was divided into two sets: 80% of the dataset was used for training and 20% for testing models. In general, it is recommended to use as much data as possible for training to maximize the performance of the models while still reserving enough data for testing to obtain reliable estimates of their performance. The performance of each model was evaluated based on common metrics such as accuracy, precision, recall, and F1 score to determine the best model for Android malware detection. By comparing the results of the two experiments, we found that the RF and the DT with DFR-MI algorithms got a higher score in accuracy in the training case, which is 98.9. While in the case of the test, we found that the RF with the DFR-MI algorithm outperformed all algorithms in terms of accuracy, precision, recall, and the f1 score, which are 98.52, 98.62, 98.41, and 98.52 respectively. This leads to the RF algorithm having the best average score, which is 98.52. We also got the worst result with NB using the mutual information algorithm for most evaluation metrics. The average scores of each algorithm in Table 7 are plotted to generate related graphs as shown in Figure 6.
Table 5. Hyperparameters used by each algorithm in the experiments
|
No. |
Algorithms |
Hyperparameters and Values |
|
1 |
RF |
n_estimators=200, criterion=’Gini’, max_depth=50, ,random_state=42 |
|
2 |
DT |
n_estimators=200, criterion=’Gini’, max_depth=50, random_state=42 |
|
3 |
SVM |
Kernel=’rbf |
|
4 |
KNN |
n_neighbors=3, weights=’ uniform’ |
|
5 |
LR |
Solver=’ lbfgs’ |
|
6 |
NB |
var_smoothing=1e-9 |
|
7 |
AdaBoost |
n_estimators=100, learning_rate=1.0, algorithm=’ SAMME.R’, random_state=42 |
|
8 |
GradientBoosting |
learning_rate=0.1, n_estimators=100, random_state=67 |
|
9 |
ANN |
Activation=’Relu’, kernel_initializer= glorot_uniform, kernel_constraint= maxnorm(3), optimizer=’adam, loss=’ binary_crossentropy’, Epoch=100, batch_size=20 |
Table 6. Results of two experiments with MI and DFR-MI features selection algorithms
|
Algorithms |
Feature Selection Algorithms |
Accuracy (%) |
Precision (%) |
Recall (%) |
F1 Score (%) |
Average Scores (%) |
|
|
Train |
Test |
Test |
Test |
Test |
Test |
||
|
RF |
MI |
98.14 |
97.68 |
97.05 |
98.35 |
97.69 |
97.69 |
|
DFR-MI |
98.9 |
98.52 |
98.62 |
98.41 |
98.52 |
98.52 |
|
|
DT |
MI |
98.14 |
97.65 |
97.13 |
98.19 |
97.66 |
97.66 |
|
DFR-MI |
98.9 |
98.33 |
98.44 |
98.22 |
98.33 |
98.33 |
|
|
SVM |
MI |
96.31 |
96 |
94.92 |
97.2 |
96.05 |
96.04 |
|
DFR-MI |
96.56 |
96.25 |
95.53 |
97.04 |
96.28 |
96.28 |
|
|
KNN |
MI |
97.64 |
95.89 |
94.97 |
96.92 |
95.93 |
95.93 |
|
DFR-MI |
98.44 |
96.82 |
96.65 |
97.01 |
96.83 |
96.83 |
|
|
LR |
MI |
93.74 |
93.75 |
93.74 |
93.18 |
93.96 |
93.66 |
|
DFR-MI |
93.89 |
93.75 |
93.8 |
93.68 |
93.74 |
93.74 |
|
|
NB |
MI |
77.99 |
77.59 |
69.44 |
97.56 |
81.48 |
81.51 |
|
DFR-MI |
84.21 |
84.53 |
94.15 |
73.63 |
82.63 |
83.74 |
|
|
adaBoost |
MI |
93.2 |
93.36 |
93.64 |
93.03 |
93.33 |
93.34 |
|
DFR-MI |
93.43 |
93.5 |
93.63 |
93.34 |
93.49 |
93.49 |
|
|
G.Boosting |
MI |
93.76 |
93.73 |
93.74 |
93.71 |
93.73 |
93.73 |
|
DFR-MI |
93.81 |
93.76 |
93.72 |
93.81 |
93.76 |
93.76 |
|
|
ANN |
MI |
97.53 |
97.27 |
97.2 |
97.35 |
97.28 |
97.28 |
|
DFR-MI |
98.27 |
98.32 |
98.05 |
98.4 |
98.32 |
98.27 |
|
Figure 6. Average scores of the two experiments
4.2 Training and testing model duration time
In this subsection, we calculated the duration time needed for each model during training and testing on 75 features twice: once with the DFR-MI and once with mutual information algorithms for feature selection. The DFR-MI algorithm not only increased the model's accuracy but also helped reduce the duration of time for training and testing the model. Table 8 shows the duration time in seconds for each algorithm for training and testing the model with the DFR-MI and MI algorithms. The obtained data in Table 7 are plotted to generate related graphs. As shown in Figure 7, it is clear that the time taken to train and test any model with the proposed algorithm DFR-MI is reduced compared to the MI algorithm by at least 14 seconds.
4.3 Performance comparison between our dataset and the benchmark dataset
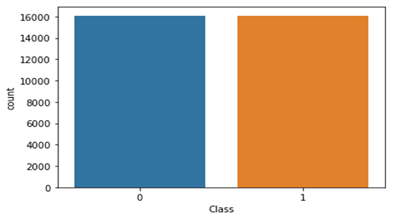
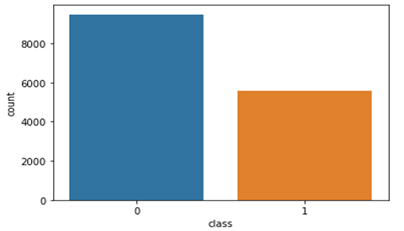
The authors of this study observed that the Drebin dataset was commonly favored by many researchers during the review process, consistently yielding high accuracy in the detection of malicious Android applications. Building upon this precedent, this study selected the Drebin dataset as a benchmark and conducted a comparative analysis with their own dataset. The visualization of our dataset and the Drebin dataset are illustrated in Figures 8 and 9.
The Darbin dataset dates back to 2012 and contains four feature types: API call signatures, permissions, command signatures, and intent. The number of samples in the Drebin dataset is 15036, of which 5560 are malware samples, and 9476 are benign samples. Our dataset consists of 32170 samples, distributed equally between malware and benign samples. The number of columns in our dataset is 209; 208 columns represent features, and 1 column represents a class label. Two hundred eight features are distributed between permissions and intents. Permissions can be native permissions or custom permissions. The number of native permissions is 102 features, the number of custom permissions is 60, and the number of intents is 46. To compare our dataset with the Drebin dataset, we have removed the feature categories like API call signatures and command signatures from the Drebin dataset. This is because our dataset only contains two feature categories: permissions and intents. After deleting the mentioned features from the Drebin dataset, the remaining features are 136 (23 intents and 113 permissions). In this way, we can a fair comparison between the two datasets with respect to their effectiveness in detecting Android malware based on permissions and intents. Then we applied MI and DFR-MI algorithms for feature selection to select the top 75 features in both datasets and passed them to nine machine learning algorithms. The scores each algorithm got on the Drebin datasets are illustrated in Table 8.
Table 7. Duration time in seconds for training models with DFR-MI and MI
|
Algorithms |
MI |
DFR-MI |
|
RF |
47 |
28.4 |
|
DT |
40.1 |
25.2 |
|
SVM |
103 |
84 |
|
KNN |
77 |
58.8 |
|
LR |
40.6 |
22.5 |
|
NB |
40.2 |
22.2 |
|
adaBoost |
45.9 |
27.8 |
|
G.Boosting |
41.8 |
24.2 |
|
ANN |
164 |
150 |
According to the scores obtained by each algorithm in Table 9, we noted that most algorithms got high scores in terms of accuracy, precision, recall, and F1 score with the DFR-MI feature selection algorithm on the Drebin dataset. To compare the performance of our dataset with the Drebin dataset, we summarize the average scores of each machine-learning algorithm with the DFR-MI algorithm on both datasets in Table 9. The average scores in Table 9 are plotted to get their related graphs, as shown in Figure 10.
Figure 7. Duration time in seconds for training and testing models with DFR-MI and MI
Figure 8. Visualization our dataset
Figure 9. Visualization Drebin dataset
The authors of this paper observed that the samples within the Drebin dataset suffer from being outdated, imbalanced, and lacking the inclusion of features utilized by modern malicious samples. These issues were meticulously addressed in the development of a new dataset, resulting in improved outcomes when the machine learning algorithm was trained on it. For example, the feature android.permission.REQUEST_INSTALL_PACKAGES ranked among the top fifteen features in the developed dataset and can be abused by malicious applications to deceive users into installing harmful apps on their devices. Notably, this feature is absent in the older API level utilized by the Drebin dataset.
Overall, we found the random forest algorithm with DFR-MI feature selection to be the best performer on our dataset. So, we chose this algorithm to build a model for figuring out which apps on smartphones are malicious.
Figure 10. Average scores on both datasets based on the DFR-MI
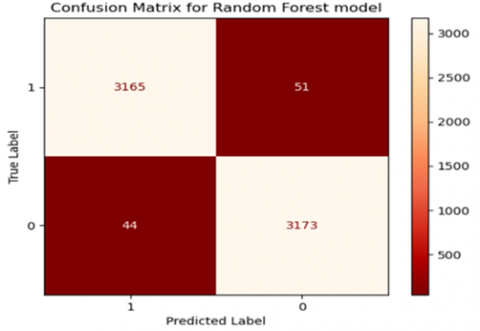
4.4 Analyzing the confusion matrix of the random forest algorithm
A classification model's performance can be assessed by counting the number of testing samples that the model correctly and incorrectly predicts. A confusion matrix is a table that displays these counts. Figure 11 shows the confusion matrix related to the random forest algorithm for binary classification. The total number of successfully classified samples equals the sum of the diagonals in the matrix. In contrast, the total number of incorrectly classified samples equals the sum of the secondary diagonal in the matrix.
As illustrated in Figure 11, 3165 samples are malware. They are correctly classified as malware samples, while the predictive model misclassifies 44 samples of benign apps as malware. On the other hand, 3173 samples were correctly classified as benign, while 51 malware and incorrectly classified as benign by the predictive model. Overall, the error rate of the proposed model is 0.014.
Table 8. Results of nine ML algorithms with MI and DFR-MI feature selection algorithms on the Drebin dataset
|
Algorithms |
Feature Selection Algorithms |
Accuracy (%) |
Precision (%) |
Recall (%) |
F1 Score (%) |
Average Scores (%) |
|
|
Train |
Test |
Test |
Test |
Test |
Test |
||
|
RF |
MI |
95.82 |
95.01 |
96.25 |
90.01 |
93.02 |
93.57 |
|
DFR-MI |
97.47 |
96.44 |
96.91 |
93.34 |
95.09 |
95.45 |
|
|
DT |
MI |
95.82 |
94.18 |
94.32 |
89.65 |
91.93 |
92.52 |
|
DFR-MI |
97.47 |
94.94 |
94.03 |
92.17 |
93.09 |
93.56 |
|
|
SVM |
MI |
94.42 |
94.61 |
96.31 |
87.85 |
92.34 |
92.78 |
|
DFR-MI |
95.11 |
95.21 |
96.89 |
89.92 |
93.28 |
93.83 |
|
|
KNN |
MI |
91.09 |
90.25 |
83.59 |
91.63 |
87.43 |
88.23 |
|
DFR-MI |
95.69 |
95.41 |
94.59 |
92.89 |
93.73 |
94.16 |
|
|
LR |
MI |
92.83 |
93.31 |
93.92 |
87.58 |
90.64 |
91.36 |
|
DFR-MI |
93.12 |
93.41 |
93.52 |
88.3 |
90.84 |
91.52 |
|
|
NB |
MI |
61.63 |
61.8 |
49.16 |
97.93 |
65.46 |
68.59 |
|
DFR-MI |
64.07 |
64.79 |
51.24 |
98.11 |
67.32 |
70.37 |
|
|
adaBoost |
MI |
92.45 |
92.71 |
93.39 |
86.42 |
89.77 |
90.57 |
|
DFR-MI |
92.63 |
92.91 |
92.52 |
87.94 |
90.17 |
90.89 |
|
|
G.Boosting |
MI |
92.62 |
92.95 |
93.52 |
86.96 |
90.12 |
90.89 |
|
DFR-MI |
93.09 |
93.31 |
93.42 |
88.12 |
90.69 |
91.39 |
|
|
ANN |
MI |
93.92 |
94.64 |
95.32 |
89.92 |
92.54 |
93.11 |
|
DFR-MI |
96.08 |
96.17 |
96.8 |
92.71 |
94.71 |
95.10 |
|
Table 9. Average scores on both datasets based on the DFR-MI algorithm
|
Algorithms |
Dataset |
Average Test Scores (%) |
|
RF |
Drebin |
95.45 |
|
Our |
98.52 |
|
|
DT |
Drebin |
93.56 |
|
Our |
98.33 |
|
|
SVM |
Drebin |
93.83 |
|
Our |
96.28 |
|
|
KNN |
Drebin |
94.16 |
|
Our |
96.83 |
|
|
LR |
Drebin |
91.52 |
|
Our |
93.74 |
|
|
NB |
Drebin |
70.37 |
|
Our |
83.74 |
|
|
adaBoost |
Drebin |
90.89 |
|
Our |
93.49 |
|
|
G.Boosting |
Drebin |
91.39 |
|
Our |
93.76 |
|
|
ANN |
Drebin |
95.10 |
|
Our |
98.32 |
Figure 11. Confusion matrix for random forest
This study presents a significant contribution to the field of Android malware detection. Fusing native and custom permissions with intents, a new dataset was created that is extensive, comprehensive, and encompasses samples developed from API level 1 to API level 32. Extensive experimentation and evaluation using nine machine-learning algorithms were conducted to compare the performance of this dataset against the Drebin benchmark dataset. Due to the comprehensiveness of the developed dataset, it consistently outperformed the Drebin dataset across all predictive models by at least 2.22%. Additionally, a novel feature selection algorithm DFR-MI was proposed with superior performance to the mutual information algorithm in both accuracy and time efficiency across the nine predictive models. The DFR-MI algorithm markedly reduced the training and testing time during the model construction phase. The findings of this study hold significant implications for enhancing mobile security. Precise identification of malicious apps ensures user privacy and defense against threats; developers in Android security can benefit from the developed model and feed it with the extracted permissions and intents from real applications to predict their state. Additionally, the dataset and feature selection algorithm introduced in this study have the potential to advance the development of more effective malware detection systems. Despite these contributions, the proposed model may produce false alarms when the tested application doesn't include any permissions and intents. So future research should address this limitation by exploring additional feature sets or integrating dynamic analysis techniques to further enhance Android malware detection accuracy.
[1] Feng, P., Ma, J., Li, T., Ma, X., Xi, N., Lu, D. (2021). Android malware detection via graph representation learning. Mobile Information Systems, 2021: 5538841. http://doi.org/10.1155/2021/5538841
[2] Ding, Y., Zhang, X., Hu, J., Xu, W. (2020). Android malware detection method based on bytecode image. Journal of Ambient Intelligence and Humanized Computing, 14: 6401-6410. http://doi.org/10.1007/s12652-020-02196-4
[3] Alkahtani, H., Aldhyani, T. (2022). Artificial intelligence algorithms for malware detection in Android-operated mobile devices. Sensors, 22(6): 2268. http://doi.org/10.3390/s22062268
[4] Arif, J.M., Razak, M.F., Awang, S., Mat, S.R., Ismail, N.S. (2021). A static analysis approach for Android permission-based malware detection systems. PloS One, 16(9): e0257968. http://doi.org/10.1371/journal.pone.0257968
[5] Wang, X., Li, C. (2021). Android malware detection through machine learning on kernel task structures. Neurocomputing, 435: 126-150. http://doi.org/10.1016/j.neucom.2020.12.088
[6] Wang, X., Zhang, L., Zhao, K., Ding, X. (2022). MFDroid: A stacking ensemble learning framework for android malware detection. Sensors, 22(7): 2597. http://doi.org/10.3390/s22072597
[7] Frenklach, T., Cohen, D., Shabtai, A., Puzis, R. (2021). Android malware detection via an app similarity graph. Computers & Security, 109: 102386. http:// doi.org/10.1016/j.cose.2021.102386
[8] Ananya, A., Aswathy, A., Amal, T., Swathy, P., Vinod, P., Shojafar, M. (2020). SysDroid: A dynamic ML-based android malware analyzer using system call traces. Cluster Computing, 23(4): 2789-2808. http://doi.org/10.1007/s10586-019-03045-6
[9] Zhang, N., Tan, Y., Yang, C., Li, Y. (2021). Deep learning feature exploration for android malware detection. Applied Soft Computing, 102: 107069. http://doi.org/10.1016/j.asoc.2020.107069
[10] Mathur, A., Podila, L., Kulkarni, K., Niyaz, Q. (2021) NATICUSdroid: A malware detection framework for Android using native and custom permissions. Journal of Information Security and Applications, 58: 102696. http://doi.org/10.1016/j.jisa.2020.102696
[11] Wang, Z., Li, K., Hu, Y., Fukuda, A., Kong, W. (2019). Multilevel permission extraction in android applications for malware detection. In 2019 International Conference on Computer, Information and Telecommunication Systems (CITS), Beijing, China, pp. 1-5. http://doi.org/10.1109/CITS.2019.8862060
[12] Amer, E. (2021). Permission-based approach for android malware analysis through ensemble-based voting model. In 2021 International Mobile, Intelligent, and Ubiquitous Computing Conference (MIUCC), Cairo, Egypt, pp. 135-139. http://doi.org/10.1109/MIUCC52538.2021.9447675
[13] Khariwal, K., Singh, J., Arora, A. (2020). IPDroid: Android malware detection using intents and permissions. In 2020 Fourth World Conference on Smart Trends in Systems, Security and Sustainability (WorldS4), London, UK, pp. 197-202. http://doi.org/10.1109/WorldS450073.2020.9210414
[14] Zhang, H., Luo, S., Zhang, Y., Pan, L. (2019). An efficient Android malware detection system based on method-level behavioral semantic analysis. IEEE Access, 7: 69246-69256. http://doi.org/10.1109/ACCESS.2019.2919796
[15] Ma, Z., Luo, S., Zhang, Y., Pan, L. (2019). A combination method for android malware detection based on control flow graphs and machine learning algorithms. IEEE Access, 7: 21235-21245. http://doi.org/10.1109/ACCESS.2019.2896003
[16] Li, D., Zhao, L., Cheng, Q., Lu, N., Shi, W. (2020). Opcode sequence analysis of Android malware by a convolutional neural network. Concurrency and Computation: Practice and Experience, 32(18): e5308. http://doi.org/10.1002/cpe.5308
[17] Niu, W., Cao, R., Zhang, X., Ding, K., Zhang, K., Li, T. (2020). Opcode-level function call graph based android malware classification using deep learning. Sensors, 20(13): 3645. http://doi.org/10.3390/s20133645
[18] Mahdavifar, S., Abdul Kadir, A., Fatemi, R., Alhadidi, D., Ghorbani, A. (2020). Dynamic android malware category classification using semi-supervised deep learning. In 2020 IEEE Intl Conf on Dependable, Autonomic and Secure Computing, Intl Conf on Pervasive Intelligence and Computing, Intl Conf on Cloud and Big Data Computing, Intl Conf on Cyber Science and Technology Congress (DASC/PiCom/CBDCom/CyberSciTech), Calgary, AB, Canada, pp. 515-522. http://doi.org/10.1109/DASC-PICom-CBDCom-CyberSciTech49142.2020.00094
[19] John, T.S., Thomas, T., Emmanuel, S. (2020). Graph convolutional networks for android malware detection with system call graphs. In 2020 Third ISEA Conference on Security and Privacy (ISEA-ISAP), Guwahati, India, pp. 162-170. http://doi.org/10.1109/ISEA-ISAP49340.2020.235015
[20] Ribeiro, J., Saghezchi, F.S., Mantas, G., Rodrigues, J., Abd-Alhameed, R. (2020). Hidroid: Prototyping a behavioral host-based intrusion detection and prevention system for android. IEEE Access, 8: 23154-23168. http://doi.org/10.1109/ACCESS.2020.2969626
[21] Wang, S., Chen, Z., Yan, Q., Yang, B., Peng, L. (2019). A mobile malware detection method using behavior features in network traffic. Journal of Network and Computer Applications, 133: 15-25. http://doi.org/10.1016/j.jnca.2018.12.014
[22] Arshad, S., Shah, M.A., Wahid, A., Mehmood, A., Song, H., Yu, H. (2018). SAMADroid: A novel 3-level hybrid malware detection model for android operating system. IEEE Access, 6: 4321-4339. http://doi.org/10.1109/ACCESS.2018.2792941
[23] Arora, A., Peddoju, S.K. (2018). NTPDroid: A hybrid android malware detector using network traffic and system permissions. In 2018 17th IEEE International Conference on Trust, Security and Privacy in Computing and Communications/ 12th IEEE International Conference on Big Data Science and Engineering (TrustCom/BigDataSE), New York, NY, USA, pp. 808-813. https://doi.org/10.1109/TrustCom/BigDataSE.2018.00115
[24] Malik, S., Khatter, K. (2018). Malicious application detection and classification system for android mobiles. International Journal of Ambient Computing and Intelligence (IJACI), 9(1): 122-142. http://doi.org/10.4018/IJACI.2018010106
[25] Sewak, M., Sahay, S.K., Rathore, H. (2020). DeepIntent: ImplicitIntent based android IDS with E2E deep learning architecture. In 2020 IEEE 31st Annual International Symposium on Personal, Indoor and Mobile Radio Communications, London, UK, pp. 1-6. http://doi.org/10.1109/PIMRC48278.2020.9217188
[26] Barbhuiya, S., Kilpatrick, P., Nikolopoulos, D.S. (2020). DroidLight: Lightweight anomaly-based intrusion detection system for smartphone devices. In Proceedings of the 21st International Conference on Distributed Computing and Networking, pp. 1-10. http://doi.org/10.1145/3369740.3369796
[27] Shyong, Y., Jeng, T.H., Chen, Y.M. (2020). Combining static permissions and dynamic packet analysis to improve android malware detection. In 2020 2nd International Conference on Computer Communication and the Internet (ICCCI), Nagoya, Japan, pp. 75-81. http://doi.org/10.1109/ICCCI49374.2020.9145994
[28] Thangavelooa, R., Jing, W., Leng, C., Abdullah, J. (2020). Datdroid: Dynamic analysis technique in android malware detection. International Journal on Advanced Science, Engineering and Information Technology, 10(2): 536-541. http://doi.org/10.18517/ijaseit.10.2.10238
[29] Elayan, O.N., Mustafa, A.M. (2021). Android malware detection using deep learning. Procedia Computer Science, 184: 847-852. http://doi.org/10.1016/j.procs.2021.03.106
[30] Akbar, F., Hussain, M., Mumtaz, R., Riaz, Q., Wahab, A., Jung, K.H. (2022). Permissions-based detection of android malware using machine learning. Symmetry, 14(4): 718. http://doi.org/10.3390/sym14040718
[31] Odat, E., Yaseen, Q.M. (2023). A novel machine learning approach for android malware detection based on the co-existence of features. IEEE Access, 11: 15471-15484. http://doi.org/10.1109/ACCESS.2023.3244656