Shalaka Deore*![]() | Arpan Khuniya
| Arpan Khuniya![]() | Ashwin Sasi
| Ashwin Sasi![]() | Jagruti Pawar
| Jagruti Pawar![]() | Mohammed Zeeshan Patel
| Mohammed Zeeshan Patel![]()
© 2024 The authors. This article is published by IIETA and is licensed under the CC BY 4.0 license (http://creativecommons.org/licenses/by/4.0/).
OPEN ACCESS
Early diagnosis and prognosis of deadly illnesses have been made possible by advancements in machine learning algorithms. In order to analyze patient pathology reports and make informed decisions regarding medicine supply and marketing strategies, pharmaceutical companies employ advanced data mining tools to generate statistical reports and extract valuable information. Our proposed system fulfils the requirement of patients as well as pharmaceutical clients that are concerned with the two diseases: diabetes mellitus and hypothyroidism. Generating statistical reports from the relevant data and providing an aerial view of the occurrence and spread of a disease in India. The diabetes mellitus and hypothyroidism prediction is carried out using three models: Support Vector Machine (SVM), Naive Bayes, and Random Forest (RF). The Random Forest model is the most appropriate for predicting diabetes mellitus with an accuracy of 90% and 98.05% for predicting hypothyroidism. Diabetes increases a patient's risk of heart disease, stroke and vision problems. Hence our findings help patients to take proactive care.
diabetes mellitus, hypothyroidism, healthcare, prediction, machine learning, algorithms
Early diagnosis of deadly illnesses aids in more effective patient care or possibly disease prevention. Patients and medical companies have benefited in a number of ways from advancements in machine learning applications in the healthcare and pharmaceutical industries. Patients can select whether to contact a doctor by being informed at the outset of a dangerous condition. Machine learning (ML) is important for the healthcare industry. ML helps Doctors to detect patterns that help them to identify new diseases, assess risks, and evaluate treatment results. It also helps to diagnose diseases early, find previously undetectable symptom patterns and compare them with larger data sets. Help surgeons by carrying out difficult jobs while they are operating. It improves the visibility and provides guidance on how to finish treatments.
By generating statistics from patient records in a certain area, pharmaceutical companies are able to calculate the appropriate amount of medications to produce for a given location depending on the total number of patients. Additionally, it assists them in choosing which medical aid to promote based on the predominant patient demographic in a certain area. Consequently, this has a direct bearing on their marketing and manufacturing plans.
When machine learning models featuring high accuracy are used, the predictions are accurate, making the system reliable for patients and also for the healthcare industry as their sales are enhanced. The proposed model performs prediction on two blood-related diseases: diabetes mellitus and hypothyroidism for patients and generates analytical results via a table on real-time patient data for healthcare organisations to give insights on the different patient populations and its statistical metrics in an area.
Diabetes is a metabolic disease that increases the blood count of sugar in the blood [1]. Insulin regulates our bodies’ glucose levels. Diabetes Mellitus (also known as Type-2 Diabetes) is brought on by the inability of our body to react to generated insulin or by the pancreatic islets of Langerhans (special cells). The World Health Organization (WHO) ranked Diabetes Mellitus at 9th position for the “Top 10 Leading causes of Death Globally” in the year 2021 which was ranked 15th in the year 2000 [2].
Frequent urination, intense thirst, major exhaustion, blurred vision, slow-healing wounds, losing weight are mainly Type 1 diabetes symptoms. Tingling in the hands or feet and extreme fatigue are common symptoms of Type 2 diabetes [3].
A variety of laboratory and medical tests are necessary to identify clinical illnesses. The disease is related with risk factors such as High blood sugar, a history of pregnancy diabetes, high/low blood pressure, disproportionate body mass index (BMI), and any illness history of family are mentioned in paper [4].
For the various forms of diabetes to be treated and managed, early identification of illness is crucial [5]. It is imperative for timely treatment to be carried out and can help prevent callous fatalities. Using SVM, Naïve Bayes and RF, we were able to yield the following accuracies-0.78, 0.79, 0.90.
The prevalence of thyroid disorders is on an exponential rise globally. T3, T4, and other hormones are produced by the thyroid gland. Thyroid issues affect one in ten Indians. Vital bodily processes including respiration, body weight, heart rate, and muscular strength are controlled by these hormones.
Effective thyroid therapy depends on early diagnosis of the condition. Hypothyroidism, hyperthyroidism, goitre, and thyroid cancer are a few examples of thyroid problems. Fatigue, weight gain, and sadness can be symptoms of hypothyroidism, wherein the thyroid gland, located on our trachea, produces an insufficient amount of the hormone. The prediction of thyroid problems has been done using machine learning approaches. These techniques analyse patient data using algorithms to look for patterns that indicate the possibility of thyroid malfunction. Depending on the dataset and attributes chosen for analysis, these approaches prediction accuracy varies.
In general, knowing how the thyroid gland works and spotting thyroid diseases early might help avoid significant health issues. Machine learning may help with early thyroid disease identification and prediction, which might result in more successful treatment results. Using SVM, Naïve Bayes, Decision Tree, KNN and RFC, we were able to yield the following accuracies-0.75, 0.79, 0.9, 0.86 and 0.98.
The following is a summary of our main contributions:
(1) Creation of a highly accurate disease detection model with a user friendly UI. It contributes by making disease detection more accessible and intuitive for patients. It allows patients to input their symptoms and risk factors through simple form and then they receive a prediction. This is designed in very basic format so that all type of users can easily access UI.
(2) Displaying a list of immediate remedies as preventive measures as well as redirecting the patient to specialists around their respective locations.
(3) Provision of an accessible dashboard with a patient as well as healthcare client interface.
(4) Generation of statistical demographics based on real-time patient data.
The paper is organized as follows: Section I provides an introduction and background to the research topic. Section II conducts a comparative analysis of existing literature reviews pertaining to the chosen diseases. The methodology adopted in our extensive research is explained in Section III. Section IV displays the experimental results that were obtained. Finally, the research work reaches a conclusion in Section V.
The literature survey is mainly divided into two parts: Diabetes Mellitus Prediction and Hypothyroidism Prediction.
2.1 Diabetes mellitus prediction
Awoniran et al. [6] worked on a model to categorise the patients, they employed the support vector machines (SVM), decision trees (DT), and random forests (RF) machine learning methods. The RF algorithm, which had an accuracy of 77%, was determined to have the best performance by the authors. The RF algorithm with the RFE feature selection approach is a promising strategy for the initial identification of diabetes mellitus. The accuracy of the suggested method is on par with previous machine learning methods that were previously used to identify diabetes. Other variables including age, family history, and lifestyle choices that may influence the chance of acquiring diabetes were not taken into account in the study. Aggarwal [7] proposed a machine learning-based method for predicting insulin resistance, a condition linked to a number of metabolic diseases. They sought to develop a prediction model utilising non-invasive variables such as age, their body mass index (BMI), the circumference of the waist, and fasting insulin and glucose levels. They used Logistic Regression, XGBoost, SVM and LDA among others and were able to yield an accuracy of 97±1 (for all). To categorise Type 2 diabetes data, Kannadasan et al. [8] suggested using stacked auto-encoders, a kind of unsupervised learning method, within a deep neural network design. The mining of higher-level representations for the data is made possible by stacking numerous layers of auto-encoders, which are neural network models that attempt to recreate their input. Deep neural networks advocate the use of several hidden layers to develop complex representations of the input data, nevertheless. This led to an accuracy of around 86.26%. Dey et al. [9] created an architecture that can determine whether a patient has diabetes or not. The development of a web application built around a set of very effective machine learning algorithms with greater accuracy in predicting was their main objective in conducting this inquiry. They employed a benchmark dataset called Pima Indian, which has the ability to diagnose-based forecast the onset of diabetes. ANN predicts with an accuracy of 82.35%. Pei et al. [10] suggested a decision tree-based classifier that employed nine patient characteristics that are simple to collect and unobtrusive as predictor variables to pinpoint prospective diabetes events. The classifier implies that diabetes may be successfully screened for using a decision tree analysis, aiding healthcare practitioners in the early identification of diabetes. Accuracy, recall, precision, and area under the ROC curve (AUC) scores for identifying suspected diabetes were 94.2%, 94.2%, 94.0%, and 94.8%, respectively. A venture to predict diabetes using various machine learning techniques was carried out by Mujumdar and Vaidehi [11]. Along with those responsible for diabetes, external variables were included in the investigation. A pipeline model for prediction was subsequently employed once the categorization was strengthened with fresh datasets. When creating the machine learning pipeline, the work documented better results with the extra datasets. How the new dataset affected the estimation of improved outcomes is not evident, though. A similar attempt was also made by Tigga and Garg [12]. The study sought to determine how people's lifestyles and family histories affected their chance of developing diabetes. With the aim of reducing the prevalence of type-II diabetes, the study employed Logistic Regression, SVM, KNN, Nave-Bayes (NB), Decision Tree and RF in predicting the incidence of the illness. RF provided an accuracy of about 94% for the study utilising a dataset about people's health, behaviours, and family histories that the team of investigators had gathered. However, the accuracy was 75% when the same method was adapted to a dataset of risk factors for diabetes. The majority of the attempts to forecast diabetes using machine learning heavily rely on algorithms for machine learning. Most of these efforts have been made in an effort to find the optimal algorithm that could aid in illness prediction. However, there hasn't been much investigation into the optimal methods for pre-processing the data for improved machine learning. The accuracy of the current approaches can be improved by using techniques that more precisely determine variables that are independent to improve machine learning algorithms.
2.2 Hypothyroidism prediction
The feature selection techniques presented by Priyanka Duggal and Shukla [13] are tree-based feature selection, recursive feature elimination, and univariate selection. Three classification methods-Naive Bayes, SVM, and RF-have been utilised. The most accurate method, according to the findings, is SVM with an accuracy of 92.9%. Priya et al. [14] worked with Random Forest Classifier which yielded an accuracy of 82%. They were able to raise accuracy to 97% by using PCA to minimize dimensionality. Rao and Renuka [15] study aims to predict thyroid illness using predictive modelling classification, which is followed by binary classification using decision trees ID3 and Naive Bayes algorithms. After getting the Thyroid Patients dataset with the appropriate features, the Decision Tree approach is used to determine if the person has a thyroid. Furthermore, the Naive Bayes method is utilized to establish the individual's thyroid stage if thyroid is identified. Vasan et al. [16] worked with SVM, KNN, ANN, Decision Tree and Logistic Regression. They observed the following accuracies-95.38%, 93.84%, 75.38%, 92.3% and 96.92%. Park and Lee [17] attempted to develop a disease recurrence prediction model using machine learning techniques by analysing the prognostic significance of clinico-pathologic factors in patients with papillary thyroid carcinoma (PTC), including the number of metastatic lymph nodes (LNs) and lymph node ratio (LNR). The effectiveness of five predictive machine learning algorithms for reoccurring predictions was evaluated based on accuracy. The combined performance of the lightGBM and stacking models achieved an accuracy of 93%, while the Decision Tree approach had the greatest accuracy (95%) of all the models. Prerana and Taneja [18] presented a method using the back propagation algorithm to find the thyroid. To make a preliminary prediction of thyroid function, artificial neural networks (ANNs) are honed using a variety of training datasets and built via backpropagation of error. To offer experimental findings, MATLAB was utilised.
Ammulu and Venugopal [19] collected the data from the UCI repository and used the random forest method to forecast the hypothyroid condition. The performance metric is precisely determined using the confusion matrix. Pandey et al. [20] categorised thyroid patients using an ensemble model that includes feature selection.
The proposed methodological structure contains six phases. Problem analysis is the foremost step in the research. Followed by data collection, model training, user interface integration, and system installation were completed.
3.1 Data gathering
The PIMA Indian Diabetes Dataset (PIDD) was taken from the Kaggle repository [21]. The dataset has a total of 9 attributes. The dataset includes information on 768 individuals, of which 268 have been diagnosed with diabetes and 500 are non-diabetic. The UCI Machine Learning repository is where the Thyroid Disease Dataset is located. A total of 3221 instances with six features make up the collection. To determine if a patient has a thyroid problem or not, the dataset is utilized for classification tasks.
3.2 Data cleaning & pre-processing
To remove missing and inaccurate data, data cleaning was performed. This involved looking for and removing any incorrect, missing, or null data from the dataset. The empty or missing data values were replaced using the median of the others since the size of the datasets was not too comprehensive.
By repeatedly choosing a smaller set of features depending on the score, Recursive Feature Elimination (RFE) allows an external estimator to assign weights or priority values to each and every feature using the attribute feature importance in order to assess the significance. For diabetes out of the 9 attributes, we found the feature importance score of each of them and discarded the lowest two-pregnancies and skin thickness. Table 1 gives the features’ list that was selected to build the diabetes mellitus model.
Table 2 gives the list of features that were selected to build the diabetes mellitus model.
To find the best hyperparameters, scikit library provided us with GridSearchCV. Machine learning uses the GridSearchCV method for hyper-parameter optimisation. It helps to improve model performance by identifying the best collection of hyper parameter settings for a certain machine-learning approach. We start by defining a grid of hyperparameters out of which some are selected. This grid typically includes various values or ranges for the hyperparameters that can be tune as per our requirement Hyper-parameters are variables that are established before to the training process rather than ones that are learnt from the data. They significantly affect the model's functionality and capacity for generalisation. The learning rate, regularisation intensity, and quantity of hidden units in a neural network are a few hyperparameters we tuned. Hyper-parameters like RandomizedSearchCV, TPOTClassifier, BayesSearchCV, EnsembleMethods and C value in SVM were used. GridSearchCV combines this hyper-parameter grid search with cross-validation. Cross-validation is used by GridSearchCV to analyse a predetermined set of hyper-parameter values and assess the model's performance. It builds a grid of every conceivable combination of hyperparameters and trains the model with each one. Cross-validation, which frequently makes use of techniques like k-fold cross-validation, is used to assess the efficacy of the model for each combination. This makes it possible to evaluate the model's effectiveness for various hyper-parameter values thoroughly. GridSearchCV then decides which hyper-parameter combination, depending on a predetermined evaluation criteria, such as accuracy or F1-score, results in the highest performance. The final model may be trained on the complete dataset using the chosen combination after the best one has been identified. Using the above, we concluded that the best parameters for the diabetes model were: {'max_depth': 16, 'n_estimators': 100}.
For the thyroid dataset, label encoding for the gender attribute was necessary. Machine learning uses the label encoding approach to express category variables numerically. Ordinal encoding is a sort of encoding in which a number label is given to each distinct category.
Label encoding is a simple technique that gives each category a different integer value. The categories "M" and "F" can be represented as 0 and 1, respectively, when it comes to gender. With this encoding, an ordering is implied, with 0 being less than 1. You may use label encoding with a variety of programming tools, such scikit-learn in Python. The procedure entails changing the data in accordance with the encoder that has been fitted to the categorical variable. The encoder would map "M" to 0 and "F" to 1 in the event of gender.
Table 1. Features of diabetes mellitus dataset
|
Features |
Data Value |
|
Age |
1-100 |
|
Insulin |
50-200 |
|
BMI |
20-150 |
|
Blood Pressure |
130/80 |
|
Glucose |
100-200 |
|
Pregnancy |
Yes/No |
|
Diabetes Pedigree Function |
Yes/No |
Table 2. Information about hypothyroidism dataset
|
Attribute |
Data Value |
|
TSH |
0-10 |
|
FTI |
0.5-11 |
|
TT4 |
4.5-12.5 |
|
T3 |
80-200 |
|
Age |
20-100 |
|
Sex |
M/F |
3.3 System architecture
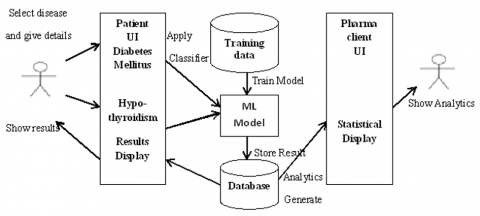
Figure 1 describes the system architecture of our proposed model. A user interface allows the proposed product to communicate with its intended users. The Patient User Interface (UI) is used by people who want to forecast or diagnose any of the listed disorders (hyperthyroidism, diabetes mellitus). The user can choose the illness for which they want to receive a prediction using this interface. The user must enter the information requested in the form after choosing the ailment. This form includes questions about the specific ailment, and the user must either enter numeric data (such as age) or check relevant checkboxes (yes/no).
Figure 1. System architecture
The software's backend examines user data once this form is submitted to make predictions, and it then displays the results (either positive or negative) to the patient UI. The user's data is mapped to dataset properties when the form is submitted, allowing the chosen ML model to make predictions based on the user's data. This machine learning (ML) model was chosen from a variety of techniques that constructed models using training data. The technique with the greatest accuracy amongst the remaining ones has been picked to produce predictions. This study compares all of the algorithms for the pertinent illnesses in its Results and Discussion section. Following the generation of the classification findings, each disease's characteristics and class are saved in a database. The doctor's interface includes a UI that will allow him or her to identify patients with similar diseases from a specific geographic area. If a patient tests positive for a particular disease, the user interface directs them to a page with details about specialists who specialize in treating that disease and links to make appointments, making it easier for patients to contact them for additional care.
3.4 Model training
Three algorithms Support Vector Machine (SVM), Naive Bayes, and Random Forest (RF) are explored by the suggested system. The model offering the highest degree of accuracy shall be chosen to construct the system via Ensembling.
3.4.1 Support vector machine (SVM)
Support vector machine (SVM) is a machine learning algorithm that is used for solving classification and regression-based problems [22]. A hyper plane is used by the SVM (Support Vector Machine) classifier to divide classes. The technique takes a collection of labelled training data as input (supervised learning), and it produces a graph that divides fresh data instances into classes using the best hyperplane. Each class is positioned on one side of the boundary line that partitions the hyper plane's width into two half of the plane. Whilst it may be applied to both regression and classification problems, it is more typically utilised for classification problems. Each data point is depicted in an n-dimensional space, where n is the total number of features, and each feature's value corresponds to a specific location on the graph.
(1) Capable of handling data with large dimensions.
(2) Resistant to overfitting.
(3) Broadly applicable kernel functions for both linear and nonlinear data.
(1) Requires a lot of computation, particularly for large datasets.
(2) Sensitivity to parameter tweaking, since the kernel and regularisation parameters' selection can have a big effect on performance.
(3) Lack of interpretability since SVMs don't offer clear-cut justifications for how decisions are made.
The training parameters for this model were:
The accuracy yielded by SVM for the prediction of diabetes mellitus was 78% and hypothyroidism was 75%.
3.4.2 Naïve bayes classifier
Naive Bayes is a classification strategy that bases its assumptions on predictor independence and the Bayes Theorem. Simply expressed, a Naive Bayes classifier thinks that the presence of a single characteristic in a class does not rely on the involvement of any other features. Large data sets can benefit from using the straightforward to build Naive Bayes model. Despite being a simple strategy, Naive Bayes has the ability to triumph over more complicated categorization strategies.
$\mathrm{P}(\mathrm{A} \mid \mathrm{B})=\frac{P(B \mid A) P(A)}{P(B)}$ (1)
According to Bayes’ theorem formula in Eq. (1): Here, P(A) stands for probability of event (A). Probability that occurrence A will happen. P(B) is an estimate of the probability that B will occur. Probability that event B will arise. P(A|B) =how likely it is for A to come about after B has occurred. P(B|A) =how likely it is for B to come about after A has occurred.
(1) Quick and effective.
(2) Simple to implement.
(3) Resilient to unimportant traits.
(1) A strong assumption of independence.
(2) Model expressiveness is restricted.
(3) Concerned with data quality.
The training parameters for this model were:
The accuracy yielded by SVM for the prediction of diabetes mellitus was 79% and hypothyroidism was 79.6%.
3.4.3 Random Forest Classifier
A Random Forest Classifier (RFC) is an ensemble learning method and meta-estimator that classifies data by fitting decision tree classifiers, which are constructed at the time of training, on data points of the dataset [23]. It may be applied similarly to bootstrapping when a forest-like collection of decision trees is employed. Each of the trees is dependent on the arbitrarily chosen values of the provided vector, leading to the optimum mix of tree predictors. Every time that a new piece of input information is received, the algorithm instantaneously generates a decision tree for it and incorporates it to the forest with the previous decision trees. To yield a more accurate set of performance metrics, we have incorporated K-fold cross validation and AdaBoosting within our models. These methods have immensely helped in increasing accuracies and made the models perform better. K-fold cross-validation is a methodology utilised to evaluate the performance and the generalizability of machine learning models. It is a technique for model assessment and resampling that aids in determining how effectively a model will function with unknown data.
For k-fold cross-validation, the initial collection of data is divided into k different subsets or folds that are virtually the same size. The model is then trained and tested a total of k times, with every instance using the fresh fold as the validation set and all the folds that remain as the training set. This guarantees that each piece of data is used for validation as well as training purposes. To estimate the model's performance overall, the performance metrics acquired from all folds are averaged. By lowering the bias and variance of the assessment, K-fold cross-validation is utilised to produce a more solid and trustworthy estimate of a model's performance. It gives information on the model's stability and dependability as well as how well it will generalise to new data.
The amount of folds or subsets utilised is indicated by the "k" in the phrase "k-fold cross-validation." It is a parameter that may be selected based on computing limitations and the amount of the dataset. Depending on the precise specifications of the study, different numbers can potentially be used in place of the typical options for k, which are 5 and 10.
Number of k folds used for our model: 5
Following are the various stages that constitute k-fold cross-validation:
(1) Separate the given dataset into k folds or subsets.
(2) Use remaining k-1 folds as a training set and train the model for each of the folds.
(3) Assess the model's accuracy on the omitted fold.
(4) For each fold, repeat steps 2 and 3, changing the fold that serves as the validation set at all times.
(5) To determine the general estimate concerning the model's performance, compute the average performance metric over all folds.
(1) High predictability.
(2) Strong against overfitting.
(3) Offers an evaluation of feature relevance.
(1) Increasing computational demands and complexity.
(2) Less comprehensible than individual decision trees.
(3) Might find it difficult to work with datasets that have unbalanced class distributions.
Ensembling is a potent machine learning approach that integrates different separate models to produce a more robust and precise prediction model. It makes use of the notion that combining many models can frequently result in better outcomes than using just one model.
Different strategies, including averaging, bagging, and boosting, can be used to assemble. Averaging approaches, such as simple averaging or weighted averaging, combine the findings of various models by taking the average or weighted average of many models' predictions. Bagging, more specifically Random Forests, produces several decision trees using bootstrapping portions of the training data, which are then integrated by the majority voting or aggregating their forecasts. Contrarily, boosting involves training models in a sequential manner while iteratively identifying and fixing mistakes caused by earlier models. It educates weak models to focus on those challenging data and gives larger weights to instances that were incorrectly identified. Ensembling frequently makes use of boosting techniques like AdaBoost, Gradient Boosting Machines (GBM), XGBoost, and LightGBM. After performing tests on the system, we concluded that AdaBoost gives the best accuracy among the list of boosting algorithms. A comparison of the accuracies of all algorithms chosen by us has been shown in Table 3.
The findings demonstrate that, among the Ensemble approaches, AdaBoosting with Random Forest had the highest degree of accuracy. As a result, it was opted for to forecast Diabetes Mellitus using the provided dataset.
Table 3. Classifier accuracy comparison in diabetes mellitus prediction
|
Classifier |
Accuracy |
|
CATBoost |
88% |
|
LightGBM |
85% |
|
AdaBoosting on Random Forest |
90% |
3.5 User interface integration
The chosen ML model will be integrated with the web app and HTML. Web app is created using Python Flask (back end), while web application is constructed using HTML5 (front end) and CSS. The front end of the web app will accept the patient as well as pharmaceutical client's queries. The result will then be displayed on the end-user’s display screen. The User Interface was designed keeping in mind the ease of accessibility and usability of the dashboard.
4.1 Prognosis of diabetes mellitus
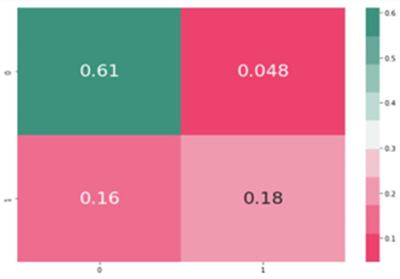
Computing three different Algorithms for the prediction of diabetes, we were able to go ahead with the best model based on the performance metrics of each algorithm. This section will highlight the results obtained from initial experimental outcomes. Confusion Matrix for Diabetes Mellitus is displayed in Figure 2.
The confusion matrix enables additional study and assessment of the model's strengths and shortcomings while also revealing important information about the performance of the SVM model and any discrepancies or biases in the classification results. It functions as a crucial tool for model improvement and performance assessment in SVM-based classification applications.
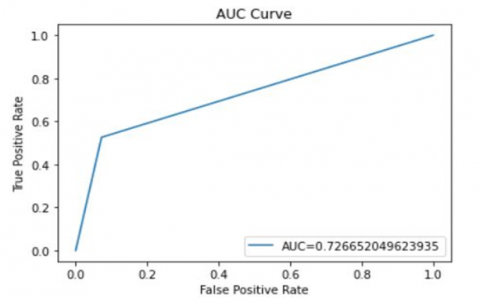
The predictive power of a classification model can be assessed using the Area Under the Curve (AUC) and ROC (Receiver Operating Characteristic) curves, particularly in binary categorization scenarios. They provide a graphical overview of the model's capacity to discern between favourable and unfavourable cases under a variety of criteria.
AUC quantifies the general effectiveness of a classification model by assessing the area under the ROC curve. AUC represent degree or separability. AUC value near 1 represents good measure of separability. The higher value of AUC better the model is to distinguish having diseases or no diseases.
A higher AUC value suggests that the model is more accurate at differentiating between those with and without diabetes. We achieved 0.7 AUC score. Figure 3 shows that our classifier gives a value of around 0.7 which makes it a pretty viable classifier.
Figure 2. Diabetes Mellitus Confusion Matrix
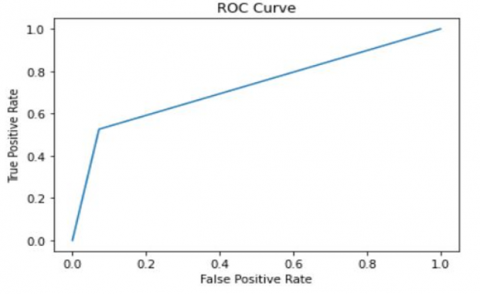
The ROC curve in Figure 4 illustrates the relationship between the true positive rate (sensitivity) and the false positive rate (specificity-1). By analysing the curve, we can identify the ideal classification threshold for diabetes prediction that strikes a compromise between sensitivity and specificity. A diabetes prediction model's performance is thoroughly assessed using AUC and ROC curves, which show the model's accuracy in classifying people and offer insights into the trade-off between the two parameters.
Comparative analysis of accuracies between the algorithms we performed for Diabetes Mellitus.
Figure 5 shows different accuracies achieved by each algorithm in predicting Diabetes Mellitus. On observations, it was concluded that SVM and Naïve Bayes yielded an accuracy of 78% and 79% respectively. Random Forest Classifier was able to achieve a higher accuracy of 90%. Therefore, using the provided dataset, it ended up being selected to predict Diabetes Mellitus.
On comparing the results of the proposed system with the existing literature review, we noticed a positive outcome. Table 4 gives a comparative analysis of the outcomes of our models and the outcomes of the algorithms chosen by the existing literature survey.
Figure 3. AUC curve for Diabetes Mellitus
Figure 4. ROC curve for Diabetes Mellitus
Figure 5. Column chart showing accuracies of algorithms to detect Diabetes Mellitus
Table 4 gives a relative analysis of the proposed system by comparing the accuracies of both the models. The former used Naïve Bayes, RFC and DNN. Accuracy values of 0.76, 0.77, and 0.89 were attained, with Deep Neural Networks outperforming the other two.
Table 4. Relative analysis of proposed method with base paper performance metrics
|
Dataset |
Reference No. |
Algorithm |
Accuracy |
|
PIMA |
[7] |
SVM RFC DNN |
0.76 0.77 0.89 |
|
Proposed Model |
SVM NB RFC |
0.78 0.79 0.90 |
Table 5. Performance metrics table of Random Forest Classifier on Diabetes Mellitus Dataset
|
Metric |
Value (Negative) |
Value (Positive) |
|
Accuracy |
0.90 |
|
|
Precision |
0.91 |
0.87 |
|
F1-score |
0.92 |
0.94 |
|
Recall |
0.94 |
0.81 |
|
Error-rate |
0.10 |
|
The proposed system outperforms each of the algorithms in their respective metrics-SVM gives an accuracy of 0.78, Naïve Bayes gives 79% and Random Forest outperforms them all by giving an accuracy of 90% as shown in Table 5 making it the most suitable model for diabetes mellitus prediction.
4.2 Prognosis of hyperthyroidism
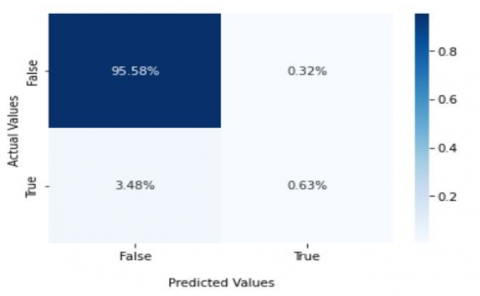
Computing five different Algorithms for the prediction of diabetes, we were able to go ahead with the best model based on the performance metrics of each algorithm. This section will highlight the results obtained from initial experimental outcomes. The Random Forest (RF) algorithm's confusion matrix is a table-based summary of how well the RF classifier performed in a classification job. It gives a thorough analysis of the projected and actual class labels, making it possible to compute several performance measures.
The confusion matrix in Figure 6 of the RF method provides insightful information on the performance of classification, allowing evaluation of the model's capacity to appropriately categorise instances while distinguishing false positives and false negatives. It is a crucial tool for assessing how well the RF algorithm performs various categorization tasks, such as diagnosing illnesses like diabetes.
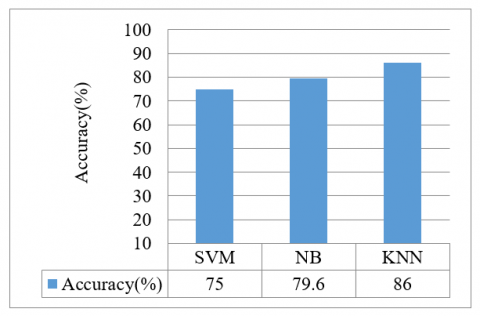
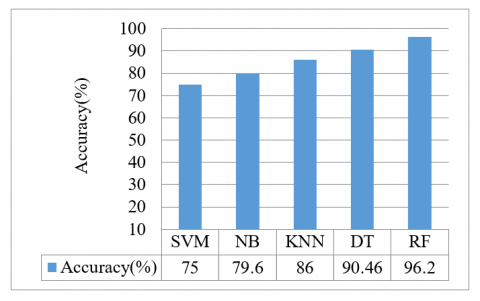
Figure 7 below shows us the different accuracies achieved by each algorithm in predicting Hypothyroidism. On observations, it was concluded that SVM and Naïve Bayes yielded an accuracy of 75% and 79.6% respectively. KNN gave an accuracy of 86% which was improved by Decision Tree to 90.46%. Initially, RFC achieved a high accuracy of 96.2% for 10 decision trees.
RFC was therefore selected to forecast hyperthyroidism using the provided dataset.
On comparing the results of the proposed system with the existing literature review, we noticed a positive outcome. Table 6 gives a comparative analysis of the outcomes of our models and the outcomes of the algorithms chosen by the existing literature survey.
Table 6 gives a relative analysis of Duggal and Shukla [13] and the proposed system by comparing the accuracies of both the models. The former used Naïve Bayes, SVM and RFC and attained accuracies of 0.74, 0.92 and 0.78. The proposed system used SVM, Naïve Bayes, KNN and RFC, yielding accuracies of 0.75, 0.79, 0.86 and 0.96.
Figure 6. Confusion matrix of hypothyroidism
Figure 7. Column chart showing accuracies of algorithms to detect hypothyroidism
Random Forest was an inevitable pick for the ensembling technique since it outperforms all the aforementioned algorithms with a base accuracy of 96.2% using 10 decision trees. On a weighted average of K-Fold cross validation, the proposed system is able to increase the final accuracy to about 98.05% as shown in Table 7.
Our findings help patients in predicting where they have diabetes or hypothyroidism efficiently. This is more convenient compared to having to schedule doctor appointment for initial screening. The UI also provide next step like doctor recommendation, making it easier for patients to seek further care.
Table 6. Comparative analysis of proposed model with base paper performance metrics
|
Dataset |
Reference No. |
Algorithm |
Accuracy |
|
UCI Machine Learning Repository |
[13] |
Naïve Bayes SVM RFC |
0.74 0.92 0.78 |
|
Proposed Model |
SVM NB KNN RFC |
0.75 0.79 0.86 0.96 |
Table 7. Performance metrics table of Random Forest Classifier on thyroid dataset
|
Metric |
Value (Negative) |
Value (Positive) |
|
Accuracy |
0.98 |
|
|
Recall |
0.97 |
0.91 |
|
Precision |
0.97 |
0.91 |
|
F1-score |
0.96 |
0.95 |
|
Error-rate |
0.02 |
|
The proposed project serves to satisfy the demands of pharmaceutical clients and patients. The efficacy of the study is ensured by the accuracy obtained for each illness prediction model. Comparing the project to other websites on the internet that can anticipate a single disease by combining two major diseases into a single programme and generating analytics reports from actual patient data that may aid pharmaceutical businesses in choosing commercial strategies. The ML models selected for prediction have the greatest accuracy, as noted in the Experimental Results and Outcomes section, and the datasets elected for prediction are unique in their own ways.
The system could further be expanded to predict other common diseases like heart disease, COPD, asthma etc. These diseases have well-studied risk factors and data available, making them suitable candidates for applying similar machine-learning techniques. Predicting more diseases would increase the system's usefulness for patients. It can currently only accurately forecast four illnesses at this time. Accuracy for these models may be increased further by the development of new ML algorithms and hyper-parameter adjustment. The datasets used have a limited number of instances and features. More complex models like deep neural networks could be explored with larger datasets. There may be underlying correlations between the features that are not accounted for by the models. On request from the user, analytics reports can also be expanded. The initiative can be further integrated with the government's medical care websites for the beneficial aspects of the country and elevate the health index. Additionally, working with different institutions and private physicians may be done to give individuals who test positive for any disease the contact information for their doctor.
[1] Al-Ishaq, R.K., Abotaleb, M., Kubatka, P., Kajo, K., Büsselberg, D. (2019). Flavonoids and their anti-diabetic effects: Cellular mechanisms and effects to improve blood sugar levels. Biomolecules, 9(9): 430. https://doi.org/10.3390/biom9090430
[2] World Health Organization. (2022). Cardiovascular diseases. https://www.who.int/health-topics/cardiovasculardiseases/.
[3] Huifen, H., Xuelin, Z., Liang, F., Haiyan, D. (2020). Effect of jiangtangning capsule combined with acarbose on blood glucose and islet β cell function in patients with type 2 diabetes. Modern Journal of Integrated Traditional Chinese and Western Medicine, 15(15): 1669. https://doi.org/10.3969/j.issn.1008-8849.2020.15.017
[4] Shafaeizadeh, S., Harvey, L., Abrahamse-Berkeveld, M., Muhardi, L., M. van der Beek, E. (2020). Gestational diabetes mellitus is associated with age-specific alterations in markers of adiposity in offspring: A narrative review. International Journal of Environmental Research and Public Health, 17(9): 3187. https://doi.org/10.3390/ijerph17093187
[5] Herman, W.H., Ye, W., Griffin, S.J., Simmons, R.K., Davies, M.J., Khunti, K., Rutten, G.E.H.M., Sandbaek, A., Lauritzen, T., Borch-Johnsen, K., Brown, M.B., Wareham, N.J. (2015). Early detection and treatment of type 2 diabetes reduce cardiovascular morbidity and mortality: A simulation of the results of the Anglo-Danish-Dutch study of intensive treatment in people with screen-detected diabetes in primary care (ADDITION-Europe). Diabetes Care, 38(8): 1449-1455. https://doi.org/10.2337/dc14-2459
[6] Awoniran, O.M., Oyelami, M.O., Ikono, R.N., Famutimi, R.F., Famutimi, T.I. (2022). A machine learning technique for detection of diabetes mellitus. In 2022 5th Information Technology for Education and Development (ITED), Abuja, Nigeria, pp. 1-6. https://doi.org/10.1109/ITED56637.2022.10051439
[7] Aggarwal, M.C.A. (2020). A machine learning based approach for the identification of insulin resistance with non-invasive parameters using homa-IR. International Journal of Emerging Trends in Engineering Research, 8(5): 2055-2064. https://doi.org/10.30534/ijeter/2020/95852020
[8] Kannadasan, K., Edla, D.R., Kuppili, V. (2019). Type 2 diabetes data classification using stacked autoencoders in deep neural networks. Clinical Epidemiology and Global Health, 7(4): 530-535. https://doi.org/10.1016/j.cegh.2018.12.004
[9] Dey, S.K., Hossain, A., Rahman, M.M. (2018). Implementation of a web application to predict diabetes disease: An approach using machine learning algorithm. In 2018 21st International Conference of Computer and Information Technology (ICCIT), Dhaka, Bangladesh, pp. 1-5. https://doi.org/10.1109/ICCITECHN.2018.8631968
[10] Pei, D., Zhang, C., Quan, Y., Guo, Q. (2019). Identification of potential type II diabetes in a Chinese population with a sensitive decision tree approach. Journal of Diabetes Research, 2019. https://doi.org/10.1155/2019/4248218
[11] Mujumdar, A., Vaidehi, V. (2019). Diabetes prediction using machine learning algorithms. Procedia Computer Science, 165: 292-299. https://doi.org/10.1016/j.procs.2020.01.047
[12] Tigga, N.P., Garg, S. (2020). Prediction of type 2 diabetes using machine learning classification methods. Procedia Computer Science, 167: 706-716. https://doi.org/10.1016/j.procs.2020.03.336
[13] Duggal, P., Shukla, S. (2020). Prediction of thyroid disorders using advanced machine learning techniques. In 2020 10th International Conference on Cloud Computing, Data Science & Engineering (Confluence), Noida, India, pp. 670-675. https://doi.org/10.1109/Confluence47617.2020.9058102
[14] Priya, V.V., Subashini, R., Priya, S.H. (2023). Thyroid disease prediction using random forest algorithm. In 2023 7th International Conference on Computing Methodologies and Communication (ICCMC), Erode, India, pp. 794-799. https://doi.org/10.1109/ICCMC56507.2023.10083592
[15] Rao, A.R., Renuka, B.S. (2020). A machine learning approach to predict thyroid disease at early stages of diagnosis. In 2020 IEEE International Conference for Innovation in Technology (INOCON), Bangluru, India, pp. 1-4. https://doi.org/10.1109/INOCON50539.2020.9298252
[16] Vasan, C.R.C., DSU, B., MS, C., Devikarani, H.S. (2018). Thyroid detection using machine learning. International Journal of Engineering Applied Sciences and Technology, 5(9):173-177.
[17] Park, Y.M., Lee, B.J. (2021). Machine learning-based prediction model using clinico-pathologic factors for papillary thyroid carcinoma recurrence. Scientific Reports, 11(1): 4948. https://doi.org/10.1038/s41598-021-84504-2
[18] Prerana, P.S., Taneja, K. (2015). Predictive data mining for diagnosis of thyroid disease using neural network. International Journal of Research in Management, Science & Technology, 3(2): 75-80.
[19] Ammulu, K., Venugopal, T. (2017). Thyroid data prediction using data classification algorithm. International Journal for Innovative Research in Science & Technology, 4(2): 208-212.
[20] Pandey, S., Tiwari, A., Shrivas, A.K., Sharma, V. (2015). Thyroid classification using ensemble model with feature selection. International Journal of Computer Science and Information Technologies, 6(3): 2395-2398.
[21] Pima Indians Diabetes Database. https://www.kaggle.com/datasets/uciml/pima-indians-diabetes-database.
[22] Cervantes, J., Garcia-Lamont, F., Rodríguez-Mazahua, L., Lopez, A. (2020). A comprehensive survey on support vector machine classification: Applications, challenges and trends. Neurocomputing, 408: 189-215. https://doi.org/10.1016/j.neucom.2019.10.118
[23] Ahmad, G.N., Fatima, H., Abbas, M., Rahman, O., Alqahtani, M.S. (2022). Mixed machine learning approach for efficient prediction of human heart disease by identifying the numerical and categorical features. Applied Sciences, 12(15): 7449. https://doi.org/10.3390/app12157449