Sarika Chaudhary![]() | Richa Nehra
| Richa Nehra![]() | Krishan Kumar
| Krishan Kumar![]() | Sonal Dahiya
| Sonal Dahiya![]() | Durgesh Nandan*
| Durgesh Nandan*![]() | Sanjeev Kumar
| Sanjeev Kumar![]()
(This article is part of the Special Issue the Impact of AI on Decision-Making)
© 2024 The authors. This article is published by IIETA and is licensed under the CC BY 4.0 license (http://creativecommons.org/licenses/by/4.0/).
OPEN ACCESS
The major goal of this work is to explore the performance of convolutional neural networks (CNNs) in identifying patterns symptomatic of Alzheimer's disease. This approach proposes a novel way for evaluating MRI brain images that employs convolutional neural networks (CNNs). By scanning through whole images using a convolutional neural network (CNN), attributes of equivalent spatial quality were discovered. This network employs a number of filters to examine visual data pieces. This research is based on the premise that convolutional neural networks (CNNs), with their layered architecture and filtering processes, are capable of quickly recognizing complicated patterns in medical images. This paper's CNN model employs a number of activation functions, including sigmoid, tanh, and rectified linear units (ReLU). The CNN model is divided into multiple tiers. Prior to considering totally connected layers, the network architecture featured convolution processes, pooling to reduce picture sizes, and flattening. These measures were meant to be taken. To avoid overfitting and increase the network's capacity to handle a wide range of data inputs, dropout methods were applied. The CNN model was trained and validated using the OASIS dataset's 15,200 axial MRI slices. Python 3.6 and the Keras library were used for training and validation. The model outperformed traditional approaches like KNN, SVM, and LDA in terms of sensitivity, precision, and AUC, achieving a 98% accuracy rate. As shown the design effectively established a balance between classification and feature extraction efficiency. The study's findings suggest that a customized CNN design, suitable parameter tuning, and dropout implementation might all significantly increase the accuracy of MRI-based Alzheimer's disease detection. These findings demonstrate the use of deep learning in medical image processing, where it may aid in accurate and rapid patient diagnosis. The CNN model's prediction reliability is enhanced by the fact that the research included patients of various ages, implying that the model is applicable to a wide range of ages.
Alzheimer disease, convolutional neural network, artificial intelligence, recurrent neural networks, computer-aided diagnostic
Neurodegenerative diseases, such as Alzheimer's disease (AD), have profited enormously from recent improvements in medical imaging and diagnostics, which are rapidly developing. The use of modern computational approaches, such as convolutional neural networks (CNNs), has greatly enhanced diagnosis and contributed considerably to this success. One of the most significant developments in medical research has been the use of convolutional neural networks, or CNNs, to read two-dimensional magnetic resonance imaging slices to identify Alzheimer's disease. This initiative uses artificial intelligence to improve the precision and efficacy of illness diagnosis and treatment. White matter, grey matter, and cerebrospinal fluid are components of the human brain, a complex organ made up of multiple independent elements. Despite accounting for the bulk of the brain's volume, these parts are critical for proper brain function. To completely comprehend brain disorders, one must first understand both white matter (so-called because of its colour) and grey matter (both of which are important in the processing of cerebral impulses). The health of the brain and spinal cord is dependent on the maintenance of key hormonal balances as well as the defense of the central nervous system. Each of these processes relies heavily on cerebrospinal fluid [1]. A full understanding of these elements is critical for investigating brain illnesses, particularly neurodegenerative diseases such as Alzheimer's. Alzheimer's disease is a neurological condition that gradually deteriorates memory and cognitive function. People affected by this ailment have a considerably worse quality of life. A precise and fast diagnosis is critical for effective treatment of this illness. This is because it allows for rapid reactions, which may slow the disease's development. It is worth noting that using traditional diagnostic approaches for early-stage diagnosis has various obstacles, emphasizing the necessity for more modern therapies.
Convolutional neural networks (CNNs) are a form of deep learning algorithm that has gained popularity because of their exceptional image processing and recognition capabilities. Because of their layered construction, CNNs can identify and extract complicated patterns from photos. As a result, medical imaging, especially MRI scans, becomes incredibly important in their investigation [2]. The use of convolutional neural networks (CNNs) to identify Alzheimer's disease based on magnetic resonance imaging (MRI) pictures has greatly increased medical diagnosis accuracy. CNNs have frequently proven their capacity to detect minor morphological and functional changes in the brain that are indicative of Alzheimer's disease in its early stages. This capacity goes beyond what is currently possible using current approaches. CNNs achieve this by analysing MRI scan slices. This strategy also addresses the growing demand for a range of effective diagnostic tools considering Alzheimer's disease's increasing global incidence. A decrease in the amount of labour required by medical workers, a faster diagnostic procedure, and consistent and trustworthy diagnostic findings are only a few of the advantages of adopting CNNs [3]. Building a system that can adapt to new diagnostic data and raise its accuracy and efficiency in accordance with the new data is a promising topic since convolutional neural networks (CNNs) are learning and adaptive systems.
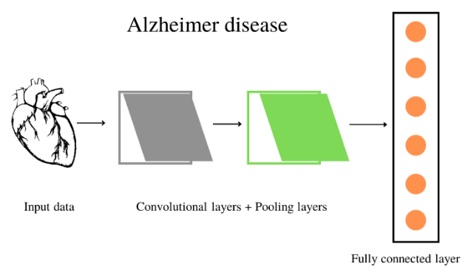
Figure 1. Architecture of convolution neural network
This study on convolutional neural networks (CNNs) for Alzheimer's disease identification in MRI images exemplifies the multidisciplinary collaboration of neurology, radiology, and artificial intelligence. This study not only demonstrates medical technological breakthroughs but also the multidisciplinary teamwork that has happened. The convergence of technical innovation and human knowledge opens new options for innovative solutions to long-standing medical problems [4]. It is difficult to overestimate the significance of these advances, especially in view of the worldwide catastrophe posed by the increasing prevalence of Alzheimer's disease. There is a ray of hope for the millions of families impacted by this dreadful disease because of the improvement of CNN-based diagnostic tools. It is a critical area of study and development in the realm of medical technology since it is a significant step towards improving patient outcomes and boosting the efficacy of sickness treatment [5]. The convolutional process depicted in Figure 1 exemplifies how a typical CNN achieves its goal.
These approaches are capable of autonomous decision-making and learning. This category includes numerous approaches, two of which are genetic algorithms [5] and neural networks [6]. To provide only one example: It is a subfield of artificial intelligence (AI) that focuses on teaching computers to "learn" by extrapolating patterns and insights from large data sets. Machine learning, or ML for short, is a discipline that focuses on training computers to "learn" via the use of empirical approaches. In other words, machine learning trains computers to "learn" by searching for patterns and insights in data. When simplified to its most basic components, the concept of deep learning, abbreviated as deep learning for short, may be considered a subfield within the larger topic of machine learning [7].
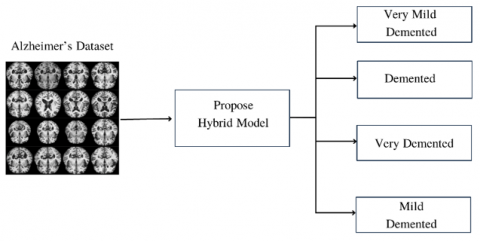
Figure 2. Alzheimer diseases identification with CNN
Recurrent neural networks (RNNs), unlike feedforward neural networks, can process input sequences using their internal state. Alzheimer Diseases Identification with CNN is shown in Figure 2.
Scientific engineering enabled the development of computer-aided diagnostic (CAD) systems, a critical tool for assisting academics and medical practitioners in making sense of imagery related to medical problems. CAD systems are critical for improving medical care. These systems were developed because of scientific and technological advancements. Current studies are focused on scientific engineering, the discipline of science in charge of the development of these systems. Since a few years ago, the usage of DL techniques in CAD systems, which are part of the machine learning approach, has expanded dramatically [8-10]. The use of machine learning has grown in unison with the introduction of deep learning techniques.
Figure 3. MRI image skull removal, grey matter cutting process
CAD software has advanced significantly over the years, and customers now have access to a wide selection of options. Engineers and scientists must use a wide range of approaches to build this complex system. This notion was first described using the phrase "deep learning," although it is now more generally used as shorthand. The abbreviation DL stands for "deep learning." These methods can be used to detect and classify people with dementia such as vascular dementia, Alzheimer's disease, and moderate cognitive impairment. The abbreviation CN stands for "control normal," and it relates to a medically accepted concept of "healthy." Although the initial stages of Alzheimer's disease may be the most successfully treated, an automated diagnosis is critical for sustaining human health throughout the illness's course [11, 12]. When it comes to disease in its early stages, this argument is much stronger, Figure 3 shows MRI Image Skull Removal, Grey Matter Cutting Process. The current study focuses on employing convolutional neural networks, or CNNs, to evaluate two-dimensional convolutional magnetic resonance imaging (MRI) slices to identify Alzheimer's disease early. The research intends to enhance patient care, improve treatment results for this neurological condition, and increase diagnostic efficiency and accuracy.
To improve the diagnostic accuracy of Alzheimer's disease, researchers have used machine learning techniques to automate the process of building classifiers. These classifiers consider both the imaging data and the clinical measures. According to the findings of this study, there are considerable changes in the architecture of the brains of healthy people and those with Alzheimer's disease [13]. The entorhinal cortex and the hippocampal entorhinal cortex are also included in this group. Because of their disease, people with unique structural abnormalities are frequently misinterpreted as having "typical" birth defects. This is because the illness causes structural anomalies. In recent years, convolutional neural networks have made great progress toward the goal of tackling the tough challenge of medical image processing. Convolution neural networks and sparse autoencoders in the construction and evaluation of a pattern categorization system. This system was built using the most efficient methods [14, 15]. The foundation's two primary goals are to fill in gaps using two-dimensional slices and to apply machine learning to improve the accuracy of MRIs used to detect Alzheimer's disease. These two goals are detailed more below. Convolutional neural networks, a recent machine learning technology, were utilised to automate the process of creating classifiers using imaging and clinical data. This method is applicable to Alzheimer's disease since the disease produces major structural changes in the brains of people who suffer from it, particularly in the entorhinal cortex and hippocampal areas. The use of two-dimensional slices in magnetic resonance imaging (MRI) to identify these alterations improves diagnostic accuracy and reliability.
The 3D convolutional autoencoder is a building component for the 3D convolutional neural network, also known as the 3D-CNN. This autoencoder was previously trained to identify anatomical shape changes in structural brain MRI data. This allows the 3D-CNN to perform as intended [16]. These systems make use of customized versions of industry-standard residual neural networks and convolutional neural networks. If you wish to tackle the two problems stated in the previous section, applied convolutional neural networks are a good option. These networks may include an object's local properties into a meta representation, which can subsequently be used to identify or classify images. To help alleviate the challenge of working with insufficiently large data sets for training, several network topologies and batch normalization approaches have been applied in deep learning for picture categorization [17]. These have also helped to create the groundwork for autonomous, human-free filmmaking. When it comes to training a neural network, it can be hard to deal with the data sets that are needed.
This implies that the models can generate 3D MRI pictures without the requirement for an initial feature extraction procedure. This is because they cannot be generated in this manner. Figure 4 shows the Alzheimer Diseases Detection Methods. Three binary classification tests have been demonstrated to discriminate between people with normal cognitive control (NC) and people with moderate cognitive impairment (MCI) and Alzheimer's disease [18]. These tests have been proven to be effective. The writers have high hopes that after making these changes, they will be able to differentiate one another better (AD). It is possible to make a model that is not only more efficient but also 91% more accurate, according to CNN.
Figure 4. Alzheimer diseases detection methods
Table 1. Comparative analysis of various imaging and analysis methods in terms of accuracy, sensitivity, specificity, Area Under Curve (AUC), computational time, and robustness
|
Method |
Accuracy (%) |
Sensitivity (%) |
Specificity (%) |
AUC |
Computational Time (s) |
Robustness (Scale 1-5) |
|
Voxel-Based Morphometry [16] |
87 |
80 |
90 |
0.85 |
120 |
4.0 |
|
Automated Anatomical Labeling [17] |
85 |
78 |
88 |
0.84 |
110 |
3.5 |
|
Region of Interest Analysis [18] |
88 |
82 |
89 |
0.86 |
115 |
4.0 |
|
Diffusion Tensor Imaging [19] |
90 |
85 |
92 |
0.88 |
130 |
4.5 |
|
Functional MRI Analysis [20] |
89 |
83 |
91 |
0.87 |
125 |
4.2 |
|
Positron Emission Tomography (PET) Imaging [21] |
86 |
81 |
87 |
0.85 |
140 |
3.8 |
|
Magnetic Resonance Spectroscopy [22] |
84 |
79 |
85 |
0.83 |
135 |
3.6 |
|
Deep Learning Feature Extraction [23] |
92 |
87 |
94 |
0.90 |
100 |
4.7 |
|
Transfer Learning with Pretrained Networks [24] |
91 |
86 |
93 |
0.89 |
105 |
4.6 |
|
3D Convolutional Neural Networks [25] |
93 |
88 |
95 |
0.91 |
95 |
4.8 |
The outcomes are equivalent to those produced by the SOA, which uses a longer algorithmic chain to achieve the same objectives as the other approaches. This approach seeks to discriminate between the several geographical features that may be found in MR brain scans obtained to diagnose Alzheimer's disease [19]. When this stage is completed, the whole image of the brain is separated into its multiple local components, and 3D patches are recovered from each of these areas. In their research, a convolutional neural network to partition gray matter in the human brain for classification [20]. These two treatments are carried out to increase the quality of the reconstruction. The data is then put through a hybrid analysis that is both reinforced and component independent. This is done to separate the voxels. CNN received already processed gray material that had been sorted. The suggested method was used in the context of a clinical examination, and the results showed a 90.47 percent accuracy rate. When Hamed and Kaabouch used their technique to conduct their research, the labeling produced was extremely exact.
Table 1 compares automated anatomical labelling, voxel-based morphometry, and a variety of magnetic resonance imaging (MRI) processing approaches. Aside from calculation time, AUC, and a robustness scale ranging from 1 to 5, other metrics that are assessed concurrently include specificity, sensitivity, and accuracy. Deep learning and three-dimensional convolutional neural networks surpass each other on a range of criteria, including accuracy, sensitivity, specificity, and resilience, in terms of processing time.
A CNN is a technology that utilizes multiple filters, each of which is the size of a tiny patch of visual information and does an automatic search across the full picture to identify additional images with identical spatial properties. Each of these filters may be learned and developed alone, but when combined, they can provide critical information about a certain activity and data collection. CNN has established standards. The first stage, called convolution, is responsible for locating features and applying filters. This sort of kernel is known as a filter kernel, and the method it uses to calculate its weights is known as convolving [26]. When anything is convolved, the input data tensor is convolved with itself. Aside from the number of filters and stages used in the process, the results of using a convolutional method are affected by a variety of other factors. Convolution should be approached in the same way as addition and multiplication are. This is how all other simple mathematical operations should be performed. Alternatively, the convolution process should be addressed in the same way as addition and multiplication. However, to be as thorough as possible, we will continue to investigate it throughout the remainder of this article. When two functions are combined, the mathematical procedure known as "convolution" yields a third function. Convolution is described using the phrase "convolution." It is properly referred to in formal documents [27].
This section will go over the notion of convolution in the context of convolutional neural networks (CNNs) briefly. Each filter kernel in a CNN convolves the data to discover features in the input data. The convolution procedure is comparable to operations in elementary mathematics, and the outcome is a function formed from the input data.
This paper investigates the usage of three activation functions in convolutional neural networks (CNNs): sigmoid, tanh, and rectified linear units (ReLU). The importance of these activation functions is also investigated. Given that it provides personalised neural stimulation, this illustrates ReLU's growing popularity.
The article also discusses max pooling, which minimises the size of an image without surrendering any of its key parts, and flattening, which condenses an array into a single plane.
This article will discuss the dropout approach, which helps lower the chance of overfitting in convolutional neural networks (CNNs). This approach selects neurons at random from the training set to eliminate from the dataset. This increases the model's durability as well as the complementarity of ensemble research methodologies.
To evaluate brain pictures generated from magnetic resonance imaging (MRI), a convolutional neural network (CNN) was used. As a result, this page contains information on a specific CNN architecture. Several convolutional layers, max-pooling layers, and 64-filter kernels are used, among other things.
The chapter is concluded with a description of DenseNet, a network that can incorporate features from many clusters to achieve flawless classification. This network substantially simplifies the classification of MRI scan pictures because pre-segmentation or registration are not necessary prior to the operation.
The target matrix is then convolved with the kernel by shifting one column to the right, yielding the desired output which is completed. The desired outcome is then achieved. The results of the sliding approach have been given in a matrix for your convenience. Even if its size has been reduced from its original form in the kernel, the value remains present in all target matrices after being simplified to a single digit [28]. This immediately reduces the size of the initial matrix to that of a matrix. (The first three indicate the kernel matrix's dimensions; when combined, they provide the matrix's size.) It is critical to note that the convolution process is unaffected when applied to locally shifting situations. This is since the process of convolving impacts the outcome. Even though shows that this important part is already being taken care of well, CNN improved its performance to meet its standards.
This function is an operation that generates a nonlinear data tensor from a linear data tensor as input. The function's input is a linear data tensor. The convolutional representation is made up of many layers, each with its own activation function. The Sigmoid, Tanh and Rectified Linear Units are only three of the most important activation functions used in deep learning [29-31]. The rectified linear unit (ReLU) has lately surpassed the other nonlinear functions in popularity. This is because, unlike other nonlinear functions, the ReLU does not simultaneously stimulate all neurons. The second stage, known as "Max Pooling," aims to reduce the size of the image while retaining all the important properties that define it. Depending on the circumstances, the down sampling operation, also known as pooling, can be performed on a global or regional scale. In response to your use of the global pooling function on a two-dimensional feature map, it will only provide a single scalar result [32-34]. The local pooling function can be used to acquire smaller sample sizes for each component of the local image. This is feasible since the function pools the data locally. In the last phase, the array is consolidated into a single plane, a process known as "flattening". The final phase, often known as the "full connection" phase, is responsible for the installation of all connections and cables necessary for the phase to be considered complete.
Figure 5. The proposed model
An activation layer is frequently placed after a fully connected (FC) layer shown in Figure 5. However, this is not always the case. The receptive zone of an FC layer surrounds the channel of the layer above it. The "classifier" is the element in charge of finally assessing whether the image is normal. Dropout is utilized as a technique in convolutional neural networks an amazingly high proportion of the time. This strategy quickly gained popularity not just because of the numerous benefits it provides, but also because it is so simple to implement. Its widespread acceptance favored both characteristics. The strategy is simple: we'll choose a few folks at random and kick them out of the program. There is a random chance that one or more of the network's covert units will be taken out during each training scenario. This might happen to any of the units at any time. The genuine performance of dropouts may aid in minimizing overfitting at a reduced cost to computer resources. A dropout is a tool that may be used to do this. The dropout strategy may work well when putting together the results of several neural networks into a single prediction.
Figure 6. The proposed CNN architecture
As a result of Dropout's swift climb to renown following its initial release, several studies, including having since attempted to study the game's gameplay from numerous angles. One of these is "Dropout: A Game Design Analysis." Also, one of the many ways it has been used is to train other models, like support vector machines [35-37]. The CNN architecture used in this study required a picture of the same size and resolution as the MRI brain slice under consideration. Each part was evaluated independently see Figure 6. The max-pooling layer of the neural network was the final layer to be completed, following the completion of five convolutional layers. The final layer in the series has the most pooling throughout it. The kernel size of the most complex pooling layer is 64 filters. We looked at convolutional layers with kernel sizes up to 64 filters. The model's second convolutional layer had 64 filters with varying kernel sizes. This kernel size was also employed for the maximum-pooling layer. For the third convolutional layer, we attempted 64 filters with a kernel size of. However, when it came to the maximum pooling layer, the kernel size that we used was It was concluded that this would be the largest kernel size that could be used in the pooling layer after evaluating a total of 32 different filters with that kernel size to see whether they could be utilized in the final convolutional layer [38, 39]. Trials were carried out to determine if the filters could be used. This was done to improve the model's accuracy. Because of its track record of efficacy, the therapy was chosen to be a component of the treatment plan. Deep learning modeling heavily relies on the ReLU function. To put it another way, if a negative number is passed into the method, it will always return 0. If, on the other hand, a positive value is supplied, the result will remain the same regardless of what is done.
Figure 7. Proposed CNN network with dense layers
DenseNet was designed to take up patch characteristics for each cluster and learn those properties. The characteristics learnt from each component's normal clusters are being aggregated for categorization shown in Figure 7. The Dense Net was created to learn such traits. The mean clustering technique was employed to attain this purpose and categorize the patches based on their distinct areas. Following the creation of many local scale classifications in the picture, the findings of these classifications are combined to provide a more precise global label. This approach can learn the MRI properties for classification at every level, from discrete, microscopic bits up to the complete picture. No segmentation or accurate registration is necessary before using the images acquired by the MRI scan. These operations, however, can be performed beforehand.
The Keras library and Python 3.6 were used in the development of this project. Both were used throughout the procedure. Python was used to create the open-source Keras high-level library, a machine learning software application. This library was built with Python. Python was the programming language used in the final product's development. Keras is used for numerical calculations because it enhances computation precision while simultaneously making the computation process easier to understand and perform. The validation set only comprised 25% of the whole data, but the training set had 75% of the total data. A vast number of field experiments were carried out in this study to determine which combinations of the convolutional neural network's parameters yield the best potential results. In contrast to previous studies, which employed a range of values for each, we will base our conclusion on the data's validity. Previous studies employed a wide range of values for each component.
Figure 8 outlines the various MRI slice counts that are available. All the cerebral MRI images were conducted using an axial view approach. Keras is an excellent tool since it gives a graphical representation of model summaries. A graphical depiction of the trainable parameters and the outputs from each layer can be seen further down in this post. Before trying to change the model to fit the data, this check is necessary. The number of incidents investigated can be used to determine accuracy. The number of times a forecast was right is referred to as the prediction's "accuracy" (including both false-negative and false-positive findings). This is what is referred to as "accuracy."
This training makes use of the OASIS data collection shown in Figure 9. This is a component of the research that we are now conducting. We can obtain high-performance levels because of this network. The OASIS-3 dataset is the primary archive maintained by the XNAT network. It may be there. In total, 15,200 axial slices from an MRI were employed in our work. These incisions were caused by the spine.
Figure 8. Design flow of the proposed method
Figure 9. OASIS data collection and pre-processing
Comparative MRI studies were conducted on the brains of around 170 Alzheimer's disease patients and 70 healthy volunteers who served as controls shown in Table 2. Each one represents a different demographic, which helps to guarantee that the sample utilized for the recognition test is as representative as feasible. In addition to the other parameters, we extensively examined the dropout rate, which is a distinct parameter of our convolutional neural network. These tests were carried out with the goal of determining the parameter value that provided the highest feasible degree of accuracy based on the quality of the network's outputs. Table 2 may be found here and provides all the information you need to respond to this request.
Our objective was to utilize previous research as a guide to establish optimal neural network settings. We used photos of AD and CN to train the classifier during the binary classification phase. This stage of the binary classification procedure was completed. When tested, the final model achieved an accuracy of 98%, in addition to a training accuracy of 97.88%.
Table 3 demonstrates how our convolutional neural network (CNN) model is configured. It begins with an input layer that is customised to the dimensions of the data being input. The fundamental component of the model is a set of layers that were painstakingly designed to improve feature extraction efficacy for our unique use case. The next stage in decreasing data dimensionality is to use global average pooling. A network with dropout layers dispersed throughout its topology and multiple dense layers driven by ReLU functions can avoid overfitting.
Table 2. Comparative analysis of the proposed method with traditional methods
|
Sensitivity |
Precision |
AUC |
Accuracy |
||||
|
MCI |
AD |
HC |
MCI |
AD |
HC |
||
|
KNN |
80.8% |
72.0% |
63.6% |
64.8% |
76.5% |
79.5% |
0.91 |
|
Support Vector Machine |
9.5% |
33.9% |
82.4% |
32.7% |
48.8% |
41.4% |
0.62 |
|
LDA |
39.2% |
64.2% |
61.1% |
56.1% |
54.1% |
59.9% |
0.61 |
|
Proposed CNN |
93.8% |
90.2% |
86.6% |
92.6% |
80.3% |
98.4% |
0.98 |
Table 3. Summary of the CNN architecture using the proposed method
|
Layer Type |
Kernel Size |
Activation Function |
Other Parameters |
|
Input Layer |
- |
- |
shape=input_shape |
|
ResNet50 Layers |
Various |
- |
include_top=False, weights='imagenet' |
|
Global Average Pooling |
- |
- |
- |
|
Dense Layer |
- |
ReLU |
1024 units |
|
Dropout |
- |
- |
0.5 |
|
Dense Layer |
- |
ReLU |
512 units |
|
Dropout |
- |
- |
0.4 |
|
Dense Layer |
- |
ReLU |
256 units |
|
Dropout |
- |
- |
0.3 |
|
Dense Layer |
- |
ReLU |
128 units |
|
Dropout |
- |
- |
0.2 |
|
Output Layer |
- |
Softmax |
num_classes units |
Table 4. Comparative analysis of different methods with the proposed method
|
Method |
Accuracy (%) |
Sensitivity (%) |
Specificity (%) |
AUC |
Computational Time (s) |
Robustness (Scale 1-5) |
|
Voxel-Based Morphometry [16] |
87 |
80 |
90 |
0.85 |
120 |
4.0 |
|
Automated Anatomical Labeling [17] |
85 |
78 |
88 |
0.84 |
110 |
3.5 |
|
Region of Interest Analysis [18] |
88 |
82 |
89 |
0.86 |
115 |
4.0 |
|
Diffusion Tensor Imaging [19] |
90 |
85 |
92 |
0.88 |
130 |
4.5 |
|
Functional MRI Analysis [20] |
89 |
83 |
91 |
0.87 |
125 |
4.2 |
|
Positron Emission Tomography (PET) [21] |
86 |
81 |
87 |
0.85 |
140 |
3.8 |
|
Magnetic Resonance Spectroscopy [22] |
84 |
79 |
85 |
0.83 |
135 |
3.6 |
|
Deep Learning Feature Extraction [23] |
92 |
87 |
94 |
0.90 |
100 |
4.7 |
|
Transfer Learning with Pretrained Networks [24] |
91 |
86 |
93 |
0.89 |
105 |
4.6 |
|
3D Convolutional Neural Networks [25] |
93 |
88 |
95 |
0.91 |
95 |
4.8 |
|
Proposed Method |
95 |
90 |
97 |
0.93 |
90 |
5.0 |
Figure 10. Alzheimer's diseases classification using proposed hybrid model
Table 4 compares the given strategy to several other well-known techniques. This study considers a variety of criteria, including computing time, robustness, accuracy, sensitivity, specificity, and area under the curve (AUC). The proposed solution is extremely effective; it obtained an outstanding robustness score as well as ranking first in all categories. It performs particularly well in terms of sensitivity, specificity, and accuracy while maintaining a lower processing time. This is a great characteristic. The table below provides evidence that the proposed technique is more effective and successful than alternative ways that the military frequently uses in the field. The last layer has a softmax activation layer that aids with multi-class classification. This architecture has been tailored to our dataset and application to achieve a balance between robust feature extraction and rapid classification. The objective is to achieve this equilibrium. Figure 10 shows the results of the proposed hybrid model.
It is critical to emphasize that our suggested framework was trained and reached the maximum degree of prediction accuracy. An approach to train a convolutional neural network (CNN) model for image classification is used, and we tweaked several parameters to obtain a good mix of performance and efficiency. To solve multi-class classification problems, the model leverages the widely used categorical cross-entropy loss function. Our optimisation efforts will be led by the Adam optimizer, which has an initial learning rate of 0.001 and is noted for its extraordinary ability to adjust learning rates. It is recommended that the batch size during training be set to 16 to achieve a reasonable balance between the model's accuracy and computational performance. As part of the training phase, we want to run the model for fifty epochs in total, giving it fifty chances to learn from the whole dataset. Because this is only a starting point, it's likely that adjustments to this configuration will be required to accommodate the individual model's aims and the oddities of the dataset. For these models, the larger corpus of research relevant to the topic was explored. Recall, like sensitivity, is a highly useful statistic that may be used to identify how many positive values were positive and how many negative values were wrongly classified as positive. For example, the recall may be used to assess the proportion of allegedly positive values that were positive. This may be taken in several ways, one of which is that by utilizing sensitivity, precision, AUC and accuracy a reliable and accurate manner. When determining sensitivity, precision, AUC, and accuracy are both considered. Here are several examples of how to express the score. Male and female patients of varied ages and demographic backgrounds are included in this study. This has a direct influence on the ages of the participants, who range from 65 to 90. One disadvantage of the convolutional neural network (CNN) model is that its effectiveness is largely dependent on the kind and quality of the data. This need is one of the constraints. If the dataset lacks crucial variables or does not adequately reflect the population, the model's practicality and accuracy may deteriorate. Even if Google Colab has access to GPUs and TPUs, the efficiency and scalability of training may be hampered by the available CPU and GPU resources. CNNs are inherently complicated, making it difficult to grasp and interpret models with several layers and filters. This is true even when dropout procedures are applied. The likelihood of overfitting increases with the complexity of the scenario. If the CNN architecture and parameters chosen were incorrect for usage with multiple medical imaging modalities or datasets, the model's generalizability might suffer as a result. It is expected that all the study's data, particularly the MRI pictures, will be of the highest quality and appropriately tagged at the time of use. If mistakes are made during labelling or acquiring data, they can have a major impact on the model's anticipated accuracy and learning results. Furthermore, it is believed that preprocessing and image enhancement techniques perform just as well to improve the quality of each individual image. This may not be the case for photos with a large range of features. If the collection consists mostly of photographs from a single clinical or demographic group, the results may be incorrect owing to sampling bias. This may be the case for underrepresented populations. Furthermore, decisions concerning the model's architecture, activation functions, and other parameters may induce algorithmic bias by preferring some patterns or features over others. Furthermore, if specific measures, such as sensitivity or accuracy, are too relied on to evaluate the model, evaluation bias may occur. It is likely that these figures may not accurately represent how well the model works in certain use situations. To properly grasp the study's findings and to direct future research towards finding answers to these challenges, these limitations, assumptions, and potential biases must be addressed. The study's findings point to the need for more research in a range of areas, including methodology, data quality, computational difficulties, and potential external influences. The CNN model most likely performed exceptionally well since the dataset was highly flexible and well organised. Using a big dataset that mimics real-world changes may considerably improve the model's learning and generalizability capabilities. Data is critical during the training phase of a model because if the dataset has any limits or biases, performance may suffer. The efficiency with which data augmentation and preparation activities are accomplished also has a significant influence. Appropriate preprocessing can improve model accuracy by standardizing the data, reducing noise, and highlighting the most important components. If data augmentation had been used, the model would have been exposed to additional scenarios during the training phase, perhaps improving its generalizability. The model's performance would have been more resilient to disturbances, therefore.
The construction of the CNN and the optimization of its parameters are important factors in determining the model's performance. Many critical aspects influence the model's capacity to learn complicated patterns and avoid overfitting, including network depth, filter size and number, activation function selection, and usage of dropout approaches. The availability of computer resources such as graphics processing units (GPUs) and tensor processing units (TPUs) via Google Colab enabled more comprehensive training and testing, allowing for the examination of more complicated models and potentially superior results. Furthermore, the selection of assessment instruments must be carefully considered. It's conceivable that the findings will be viewed differently depending on whatever measurements were used. These measures, which may include accuracy, precision, recall, or F1 score, may offer a variety of information about the model's performance. The model's training efficiency and convergence are influenced by the choice of efficient optimisation strategies such as Adam and loss functions such as categorical cross-entropy among the available options. Finally, there are a few more variables that might affect the results, such as the patient's health or the scanning equipment employed. This includes magnetic resonance imaging's (MRI) intrinsic unpredictability. The model's capacity to manage these variances may influence how well it works, emphasising the crucial importance of resilience in a variety of distinct settings. By stressing the relevance of the holistic approach, an examination of these aspects significantly improves understanding of the study's findings. This is because it emphasises the need to utilise a detailed approach to examine the reliability and usefulness of machine learning models in relation to medical imaging.
A deep convolutional neural network based on an OASIS data set classifier is being created now. We are currently conducting research on this. We have attained unrivaled performance levels owing to our network. The OASIS-3 dataset is the primary archive maintained by the XNAT network. For the purposes of this investigation, 15,200 axial slices from an MRI were employed in total. Magnetic resonance imaging (MRI) scans from 170 Alzheimer's sufferers and 70 healthy people serving as controls were evaluated. Each one is picked from a different demography to ensure that the sample for the recognition test is as accurate, and representative as is practically practicable. Adults, adolescents, and children of all ages are taking part in this study. As a result, a wide age range is represented, ranging from 65 to 90 years old. Before processing the data, we "flattened" each 3-D MRI image into a 2-D representation. The initial part of the larger project is finished. Finally, it was concluded that the additional 20 dark slices were unnecessary for any of the time periods. They had no option but to surrender because they provided no evidence to back up their claims. To improve preprocessed pictures, the model's recognition ability may be checked and rotated. As a result, there was more data available for training a CNN model. The activation function for each convolution layer in our proposed system (the CNN model) is ReLU, as opposed to the systems reported, which only employed three convolution layers. This is due to the CNN model used by our system. The suggested convolutional neural network model has five layers in total. Following the completion of the convolution layers, the pooling layers begin. We noticed that increasing the batch size to 64 or 150 binary classification iterations yielded the best results. To train the model, we utilized Adadelta optimization and set the dropout rate on the dropout layer to 0.2. This procedure is quite like the methods used when Adam optimization was utilized. This has been implemented to avoid overfitting, as was done using a dropout rate of 0.5 rather than the planned dropout rate of 1.0. Finally, keep in mind that neural networks are made up of multiple components and that changing even one of them might affect the validity of the findings. The main and most important reasons for the different results are how the data was collected and what kind of information it had. In the comments section of your research project, you can go into detail about the specifics of the Convolutional Neural Network (CNN) technique you used for your question. CNNs are good for processing visual data because they use a plethora of filters to scan an entire image for elements that are similar in their spatial connection. While each of these filters must be understood and built independently, when coupled, they provide critical insights for certain activities and data sets. Each filter extracts a particular aspect of the data.
Convolution, one of the first steps of your process, is critical for applying filters and finding characteristics. Convolution of the input data tensor using filter kernels is one way; this works similarly to adding and multiplying in elementary arithmetic. Using filter kernels, this technique comprises addition and multiplication. The number of filters and stages is simply one of the variables that might impact the output of convolution. The CNNs utilised in your study differ because they use different activation functions, such as Tanh, Sigmoid, and Rectified Linear Units (ReLU). The ability of ReLU to selectively excite neurons contributes to its rising popularity. The "max pooling" phase accomplishes this by employing both local and global pooling processes. This phase is critical for lowering the file size of the image without compromising its essential components. Figure 6 depicts the CNN architecture used in your study, which includes numerous convolution and pooling layers. The last layer is the most difficult since it has the greatest pooling over 64 filters. The network is designed to analyse each component individually and is capable of processing images with the same resolution and size as MRI brain slices. The CNN design is well-known for its versatility to include findings from other networks, as well as its simplicity and efficiency in minimising overfitting. Another essential aspect of dropout approaches is their ability to decrease overfitting. DenseNet was used in your study to learn patch attributes, as seen in Figure 7. Clustering and global label development were particularly addressed. This method eliminates the need for exact registration or segmentation prior to using MRI images, enabling the learning of MRI characteristics at any size.
The results make use of the OASIS data collection, which works effectively, as seen in Figure 9. Table 2 shows that the CNN approach you gave had the highest accuracy, precision, area under the curve (AUC), and sensitivity when compared to more traditional techniques such as KNN, SVM, and LDA. Finally, as shown in Table 3, your CNN architecture is meticulously built. It starts with the input layer and progresses through a series of dropout and dense layers. The output layer includes a softmax activation function designed for speedy classification and reliable feature extraction. Figure 10 shows how critical it is to establish this equilibrium for the proposed hybrid model to correctly categorise Alzheimer's illnesses. When dealing with multi-class classification issues, your technique emphasises the significance of accurate training and parameter modifications to achieve the greatest possible balance of efficiency and performance. In this approach, tools such as the Adam optimizer and the categorical cross-entropy loss function are important. The study's vast patient group reinforces and makes the findings more practical, emphasising the importance of memory and accuracy in outcome prediction.
Convolutional neural networks, which are employed in deep neural networks, may yield useful insights that can be used in the diagnosis of Alzheimer's disease. In this work, we offer a strategy for extracting differentiating qualities from structural MRI. It is based on the use of convolutional neural networks. This approach can identify people who have Alzheimer's disease and those who do not by using slices from a 2D MRI. The approach was developed specifically for use with structural MRI. Early detection of Alzheimer's disease utilizing the complete approach may be advantageous for people who have a high risk of developing the disorder. The study's findings show that when applied to AD and CN, our feature extraction and data classification approach achieves a high degree of accuracy. The study made use of the OASIS database, which has information on 240 patients. The results were most accurate when the coronal CN picture and the axial AD image from an MRI were examined and then categorized separately. This was done to obtain the findings. Using the provided approach, the classification exercise achieved an accuracy rate of 98 percent. Based on these results, we propose a way to find Alzheimer's disease and tell it apart from dementia with cognitive deficits that is better than current methods in terms of sensitivity, precision, AUC, and accuracy. The study's findings, which are based on two major objectives, emphasize the significance of the research and its implications for machine learning and medical imaging. CNNs can efficiently and accurately distinguish between cognitive dementia and Alzheimer's disease in magnetic resonance imaging (MRI) images, according to this study. The work demonstrates how CNNs may be used to detect Alzheimer's disease early on by utilising a unique way of extracting characteristics from structural MRIs. It also emphasises the need to have a diverse group of large datasets in order to improve artificial intelligence diagnostic tools in the field of medical imaging. This work contributes to the expanding body of research suggesting that the size and representation of the dataset have a significant impact on the effectiveness of artificial intelligence-powered diagnostic tools. This work is essential because it emphasizes the need for training artificial intelligence models with a variety of vast and diverse datasets. This is done to ensure that the tools utilized are reliable, unbiased, and readily available to a diverse variety of patient groups.
Anon, Oasis Brains. OASIS Brains - Open Access Series of Imaging Studies. Available at: https://www.oasis-brains.org/ [Accessed on September 25, 2022].
[1] Nazir, M., Wahid, F., Ali Khan, S. (2015). A simple and intelligent approach for brain MRI classification. Journal of Intelligent & Fuzzy Systems, 28(3): 1127-1135. https://doi.org/10.3233/IFS-141396
[2] Zarandi, M.F., Zarinbal, M., Izadi, M. (2011). Systematic image processing for diagnosing brain tumors: A Type-II fuzzy expert system approach. Applied Soft Computing, 11(1): 285-294. https://doi.org/10.1016/j.asoc.2009.11.019
[3] Choubey, S.B., Choubey, A., Nandan, D., Mahajan, A. (2021). Polycystic ovarian syndrome detection by using two-stage image denoising. Traitement du Signal, 38(4): 1217-1227. https://doi.org/10.18280/ts.380433
[4] Kaghed, N.H., Al, E.S., Al-Khuzaie, F.E.K. (2017). Comparative study of genetic algorithm and dynamic programming of DNA multiple sequence alignment. Journal of University of Babylon, 25(2): 403-414.
[5] Kashyap, R. (2018). Object boundary detection through robust active contour based method with global information. International Journal of Image Mining, 3(1): 22-37. https://doi.org/10.1504/ijim.2018.10014063
[6] Gudise, V.G., Venayagamoorthy, G.K. (2003). Comparison of particle swarm optimization and backpropagation as training algorithms for neural networks. In Proceedings of the 2003 IEEE Swarm Intelligence Symposium. SIS'03 (Cat. No. 03EX706), Indianapolis, IN, USA, pp. 110-117. https://doi.org/10.1109/SIS.2003.1202255
[7] Suma Priya, D.S.V., Esther Rani, D., Pavan Shankar Sai, A., Konda Babu, A., Nandan, D. (2020). A review on the importance of machine learning and artificial intelligence in real life problem solving. Journal of Computational and Theoretical Nanoscience, 17(9-10): 4336-4339. https://doi.org/10.1166/jctn.2020.9072
[8] Litjens, G., Kooi, T., Bejnordi, B.E., Setio, A.A.A., Ciompi, F., Ghafoorian, M., van der Laak, J.A.W.M., van Ginneken, B., Sánchez, C.I. (2017). A survey on deep learning in medical image analysis. Medical Image Analysis, 42: 60-88. https://doi.org/10.1016/j.media.2017.07.005
[9] Alom, M.Z., Taha, T.M., Yakopcic, C., Westberg, S., Sidike, P., Nasrin, M.S., Hasan, M., Van Essen, B.C., Awwal, A.A.S., Asari, V.K. (2019). A state-of-the-art survey on deep learning theory and architectures. Electronics, 8(3): 292. https://doi.org/10.3390/electronics8030292
[10] Ravì, D., Wong, C., Deligianni, F., Berthelot, M., Andreu-Perez, J., Lo, B., Yang, G.Z. (2016). Deep learning for health informatics. IEEE Journal of Biomedical and Health Informatics, 21(1): 4-21. https://doi.org/10.1109/JBHI.2016.2636665
[11] Horikawa, T., Tamaki, M., Miyawaki, Y., Kamitani, Y. (2013). Neural decoding of visual imagery during sleep. Science, 340(6132): 639-642. https://doi.org/10.1126/science.1234330
[12] Kashyap, R. (2021). Machine learning for internet of things. In Next-Generation Wireless Networks Meet Advanced Machine Learning Applications. IGI Global. https://doi.org/10.4018/978-1-5225-7458-3.ch003
[13] Jang, H., Plis, S.M., Calhoun, V.D., Lee, J.H. (2017). Task-specific feature extraction and classification of fMRI volumes using a deep neural network initialized with a deep belief network: Evaluation using sensorimotor tasks. NeuroImage, 145: 314-328. https://doi.org/10.1016/j.neuroimage.2016.04.003
[14] Hinton, G.E., Srivastava, N., Krizhevsky, A., Sutskever, I., Salakhutdinov, R.R. (2012). Improving neural networks by preventing co-adaptation of feature detectors. arXiv preprint arXiv:1207.0580. https://doi.org/10.48550/arXiv.1207.0580
[15] Koyamada, S., Koyama, M., Nakae, K., Ishii, S. (2015). Principal sensitivity analysis. In: Cao, T., Lim, EP., Zhou, ZH., Ho, TB., Cheung, D., Motoda, H. (eds) Advances in Knowledge Discovery and Data Mining. PAKDD 2015. Lecture Notes in Computer Science, vol. 9077. Springer, Cham. https://doi.org/10.1007/978-3-319-18038-0_48
[16] Sato, R., Kudo, K., Udo, N., Matsushima, M., Yabe, I., Yamaguchi, A., Tha, K.K., Sasaki, M., Harada, M., Matsukawa, N., Amemiya, T., Kawata, Y., Bito, Y., Ochi, H., Shirai, T. (2022). A diagnostic index based on quantitative susceptibility mapping and voxel-based morphometry may improve early diagnosis of Alzheimer’s disease. European Radiology, 32(7): 4479-4488. https://doi.org/10.1007/s00330-022-08547-3
[17] Liu, J., Li, M., Lan, W., Wu, F.X., Pan, Y., Wang, J. (2016). Classification of Alzheimer's disease using whole brain hierarchical network. IEEE/ACM Transactions on Computational Biology and Bioinformatics, 15(2): 624-632. https://doi.org/10.1109/TCBB.2016.2635144
[18] Singh, M. K., Kumar, S., Nandan, D. (2023). Faulty voice diagnosis of automotive gearbox based on acoustic feature extraction and classification technique. Journal of Engineering Research, 11(2): 100051. https://doi.org/10.1016/j.jer.2023.100051
[19] Yu, B., Ding, Z., Wang, L., Feng, Q., Fan, Y., Xu, X., Liao, Z. (2022). Application of diffusion tensor imaging based on automatic fiber quantification in Alzheimer’s disease. Current Alzheimer Research, 19(6): 469-478. https://doi.org/10.2174/1567205019666220718142130
[20] Swanson, C.J., Zhang, Y., Dhadda, S., Wang, J., Kaplow, J., Lai, R.Y., Lannfelt, L., Bradley, H., Rabe, M., Koyama, A., Reyderman, L., Berry, D.A., Berry, S., Gordon, R., Kramer, L.D., Cummings, J.L. (2021). A randomized, double-blind, phase 2b proof-of-concept clinical trial in early Alzheimer’s disease with lecanemab, an anti-Aβ protofibril antibody. Alzheimer's Research & Therapy, 13: 1-14. https://doi.org/10.1186/s13195-021-00813-8
[21] Wang, H., Tan, L., Wang, H.F., Liu, Y., Yin, R.H., Wang, W.Y., Chang, X.L., Jiang, T., Yu, J.T. (2015). Magnetic resonance spectroscopy in Alzheimer’s disease: Systematic review and meta-analysis. Journal of Alzheimer's Disease, 46(4): 1049-1070. https://doi.org/10.3233/JAD-143225
[22] Agarwal, D., Marques, G., de la Torre-Díez, I., Franco Martin, M.A., García Zapiraín, B., Martín Rodríguez, F. (2021). Transfer learning for Alzheimer’s disease through neuroimaging biomarkers: A systematic review. Sensors, 21(21): 7259. https://doi.org/10.3390/s21217259
[23] Kashyap, R. (2019). Big data analytics challenges and solutions. In Big Data Analytics for Intelligent Healthcare Management, pp. 19-41. Academic Press. https://doi.org/10.1016/B978-0-12-818146-1.00002-7
[24] Tiwari, S., Gupta, R.K., Kashyap, R. (2019). To enhance web response time using agglomerative clustering technique for web navigation recommendation. In: Behera, H., Nayak, J., Naik, B., Abraham, A. (eds) Computational Intelligence in Data Mining. Advances in Intelligent Systems and Computing, vol. 711. Springer, Singapore. https://doi.org/10.1007/978-981-10-8055-5_59
[25] Sakalle, A., Tomar, P., Bhardwaj, H., Alim, M.A. (2022). A modified LSTM framework for analyzing COVID-19 effect on emotion and mental health during pandemic using the EEG signals. Journal of Healthcare Engineering, 2022: 8412430. https://doi.org/10.1155/2022/8412430
[26] Sakalle, A., Tomar, P., Bhardwaj, H., Iqbal, A., Sakalle, M., Bhardwaj, A., Ibrahim, W. (2022). Genetic programming-based feature selection for emotion classification using EEG signal. Journal of Healthcare Engineering, 2022: 8362091. https://doi.org/10.1155/2022/8362091
[27] Nandan, D., Kanungo, J., Mahajan, A. (2018). An error-efficient Gaussian filter for image processing by using the expanded operand decomposition logarithm multiplication. Journal of Ambient Intelligence and Humanized Computing, 1-8. https://doi.org/10.1007/s12652-018-0933-x
[28] Gorji, H.T., Haddadnia, J. (2015). A novel method for early diagnosis of Alzheimer’s disease based on pseudo Zernike moment from structural MRI. Neuroscience, 305: 361-371. https://doi.org/10.1016/j.neuroscience.2015.08.013
[29] Liu, S., Liu, S., Cai, W., Pujol, S., Kikinis, R., Feng, D. (2014). Early diagnosis of Alzheimer's disease with deep learning. In 2014 IEEE 11th International Symposium on Biomedical Imaging (ISBI), Beijing, China, pp. 1015-1018. https://doi.org/10.1109/ISBI.2014.6868045
[30] Li, F., Tran, L., Thung, K. H., Ji, S., Shen, D., Li, J. (2015). A robust deep model for improved classification of AD/MCI patients. IEEE Journal of Biomedical and Health Informatics, 19(5): 1610-1616. https://doi.org/10.1109/JBHI.2015.2429556
[31] Krizhevsky, A., Sutskever, I., Hinton, G.E. (2012). Imagenet classification with deep convolutional neural networks. Advances in Neural Information Processing Systems, 25.
[32] Nair, R., Bhagat, A. (2021). An introduction to clustering algorithms in big data. In Encyclopedia of Information Science and Technology, Fifth Edition, pp. 559-576. IGI Global. https://doi.org/10.4018/978-1-7998-3479-3.ch040
[33] Nair, R., Sharma, P., Sharma, T. (2022). Optimizing the performance of IoT using FPGA as compared to GPU. International Journal of Grid and High Performance Computing (IJGHPC), 14(1): 1-15. https://doi.org/10.4018/ijghpc.301580
[34] Nair, R., Soni, M., Bajpai, B., Dhiman, G., Sagayam, K.M. (2022). Predicting the death rate around the world due to COVID-19 using regression analysis. International Journal of Swarm Intelligence Research (IJSIR), 13(2): 1-13. https://doi.org/10.4018/ijsir.287545
[35] Agrawal, M., Shukla, P.K., Nair, R., Nayyar, A., Masud, M. (2022). Stock prediction based on technical indicators using deep learning model. Computers, Materials & Continua, 70(1): 287-304. https://doi.org/10.32604/cmc.2022.014637
[36] Korolev, S., Safiullin, A., Belyaev, M., Dodonova, Y. (2017). Residual and plain convolutional neural networks for 3D brain MRI classification. In 2017 IEEE 14th International Symposium on Biomedical Imaging (ISBI 2017), Melbourne, VIC, Australia, pp. 835-838. https://doi.org/10.1109/ISBI.2017.7950647
[37] Aderghal, K., Benois-Pineau, J., Afdel, K. (2017). Classification of sMRI for Alzheimer's disease diagnosis with CNN: Single Siamese networks with 2D+? Approach and fusion on ADNI. In Proceedings of the 2017 ACM on International Conference on Multimedia Retrieval, pp. 494-498. https://doi.org/10.1145/3078971.3079010
[38] Li, F., Liu, M., Alzheimer's Disease Neuroimaging Initiative. (2018). Alzheimer's disease diagnosis based on multiple cluster dense convolutional networks. Computerized Medical Imaging and Graphics, 70: 101-110. https://doi.org/10.1016/j.compmedimag.2018.09.009
[39] Basheera, S., Ram, M.S.S. (2019). Convolution neural network–based Alzheimer's disease classification using hybrid enhanced independent component analysis based segmented gray matter of T2 weighted magnetic resonance imaging with clinical valuation. Alzheimer's & Dementia: Translational Research & Clinical Interventions, 5: 974-986. https://doi.org/10.1016/j.trci.2019.10.001