Sunardi![]() | Abdul Fadlil
| Abdul Fadlil![]() | Denis Prayogi*
| Denis Prayogi*![]()
© 2023 IIETA. This article is published by IIETA and is licensed under the CC BY 4.0 license (http://creativecommons.org/licenses/by/4.0/).
OPEN ACCESS
Machine Learning (ML), an intelligent system known for its capacity to automate procedures by discerning patterns pertinent to specific tasks such as detection, prediction, and pattern recognition, is increasingly being used to advance biometric technologies. Among these, facial recognition, a subset of computer vision-based biometrics, is emerging as a robust security measure. The present study is centered on the design of a room security system that leverages facial recognition, rooted in a Convolutional Neural Network (CNN) architecture. The CNN model was constructed within the Tensorflow framework, employing the Keras library and Scikit-learn, all embedded within a Raspberry Pi system. The model was trained on 15 registered face classes, with an additional three unregistered classes used for biometric security testing. Performance was evaluated using the False Acceptance Rate (FAR) and False Rejection Rate (FRR), metrics that assess the system's ability to accurately verify authorized and unauthorized users. Findings demonstrated that the CNN model achieved a 97% accuracy rate in facial identification. Furthermore, biometric security testing of the CNN model using room security devices yielded optimal results at a threshold of 90%, with FAR=26.67%, FRR=9.33%, and an Equal Error Rate (EER) of 21.33%. It was observed that factors such as lighting, data variation, resolution, and positional changes during data sampling could impact the system's performance in real-time operations. It is therefore recommended that data collection and facial scanning be consistently conducted under identical environmental conditions to enhance the accuracy of the system. This study signifies a substantial stride in the development of advanced room security systems, thus contributing to the broader realm of secure access control systems.
biometric, Convolutional Neural Network, face recognition, machine learning, security system
In recent years, biometric systems such as the retina (eye), fingerprint, voice, gait [1] and facial recognition have developed rapidly. They are widely applied in various fields in society [2], such as security, because they can identify and verify. The face is a unique part of the human body, so it can be used for identification and verification, such as attendance, making identity cards, security systems, intelligent control systems, and online payments [3]. For humans, recognizing other people's faces is very easy just by looking at the person. However, for machines such as computers, it is very difficult and challenging to do [4], and it requires accurate programs to recognize faces. In the computer field, facial recognition systems are part of the computer vision science family that uses biometric technology.
The process of facial recognition in computer vision compares the pattern of a person's facial information [5] with image data in the database to get a face image match. The images stored in the database are previously carried out by a training process, namely by entering as many images of a person's face as possible to improve accuracy. Several image classification and extraction methods that can be used in the process of recognizing faces include Convolutional Neural Network (CNN) [6, 7], Principal Component Analysis (PCA) [8, 9], Eigenface [10], Local Binary Pattern (LBP) [11, 12], and Support Vector Machine (SVM) [13]. While the method for face detection usually uses the Haar Cascade Classifier. Several things affect the process of recognizing faces in computer systems, namely lighting [14], changes in faces such as mustaches, beards, glasses, aging, poses, and facial expressions [15]. For computers to recognize faces, machine learning (ML) is needed, which can optimize the accuracy of recognizing faces. One of the ML commonly used is deep learning [16, 17], which is a working model of an artificial neural network inspired by how humans think, and this model works on the hidden layer. CNN is a learning model method that can recognize faces with high accuracy both statically and in real time.
Tabassum et al. [18] combine four algorithms, namely PCA, Linear Discriminant Analysis (LDA), Discrete Wavelet Transform (DWT), and CNN. This aggregation gives a human face recognition rate of 89.56% for the worst case and 93.34% for the best case. This result depends on the image and diversity of the facial database used but is claimed to be still better than previous work. Archana et al. [19] used machine learning-based facial recognition to build a vehicle starter safety system. The system built is a prototype so that it can be further developed if it is to be commercialized. This shows that the facial recognition system can be used for various purposes and can continue to be developed. Shavetov and Sivtsov [20] researched facial recognition for an access control system using Viola-Jones and MultiTask CNN (MTCNN). The results of this study were able to match faces from online cameras to images in the database. This system is also equipped with spoof detection to prevent system bypasses, such as displaying photos of people who have permission for access control.
From several previous studies, this research designed a room security system using facial recognition verification built based on deep machine learning technology. Generally, room security in buildings or offices is still limited to using manual locks on doors, fingerprints, passwords, and Radio Frequency Identification (RFID) cards to open doors. Keys are easily duplicated, left behind, or lost when using manual keys, and difficulties in developing systems using room door security products already on the market. One that can be developed for a room security system is using facial recognition. Access to the room can be limited so that it is done by certain people whose faces have been registered in advance through the training process so that if they open the door, that person must scan his face then the system will recognize the face. If the face can be verified, then the door will open. If not, then the system will deny access to open the door.
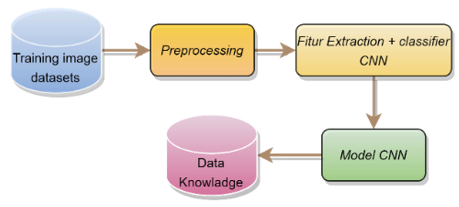
This research builds a room security system device using face verification. The system was built using the Python programming language version 3.9.2, the Keras 2.8.0 library, Scikit-learn 1.0.2, and Tensorflow 2.8.0 which are compatible with the 64-bit Bullseye operating system on Raspberry Pi [21, 22]. Figure 1 is the stages of the research carried out.
Figure 1. The stage of research
The stage begins with collecting facial image data used in the study, which can be seen in Table 1. This stage determines how many samples will be used, who is the sample respondent, and how to take facial images through the camera. After the facial image data is available, the next step is the second stage. The image data is divided into two parts: training and testing to build the model. The facial image is pre-processed so that it can be processed by CNN, such as reducing its size and converting it to grayscale. After that, the image is used as input for the convolution process in CNN. This stage also analyzes what CNN architecture will be used and is suitable for Raspberry Pi implementation. The convolution, feature extraction, and classification processes produce a model evaluated using a confusion matrix to measure its accuracy. Models with good accuracy will be used as a database to be tested using FAR and FRR. The knowledge database is tested using biometric-based security testing techniques in the third stage. This is done to measure the level of EER and find out how safe the system is built when tested with this method. The results of biometric security testing will be a reference for determining whether the model built from CNN can be used. Then the fourth stage, namely designing room security devices using raspberry pi and sensors. In this stage, researchers analyze hardware requirements such as sensors and others that will be used. This hardware needs to be adjusted to the features built to complement the room security system, such as detecting a person at the door and detecting their movements before facial scanning occurs. The fifth stage is real-time device testing with face verification. Hardware and sensors will be tested directly to determine whether they can work properly or not, according to the design of the software. The sixth stage is to conclude the results of the trials and then evaluate them as a whole.
Table 1. Dataset of registered person's face
|
Description |
Total Data |
|
Class data (Person) |
15 |
|
Training image |
2100 |
|
Testing image |
525 |
Table 1 displays the facial data used to build the CNN model. The data class consists of 15 people who are registered and have access to enter the room. To test the security of the biometric system, the data used are in Table 2.
Table 2. Biometric security test image data
|
Person |
Amount of Images |
Description |
|
Person1 |
5 |
Registered person |
|
Person2 |
5 |
|
|
… |
… |
|
|
Person14 |
5 |
|
|
Person15 |
5 |
|
|
Person16 |
5 |
Unregistered person |
|
Person17 |
5 |
|
|
Person18 |
5 |
Table 2 displays the amount of data used to test biometric security. Person1 to person15 are registered faces with access rights, then verified based on facial data stored in the model. At the same time, person16 to person18 are people who are not registered and do not have access rights to enter the room. Figure 2 is a sample of the face used in the study.
Figure 2. Face's sampling
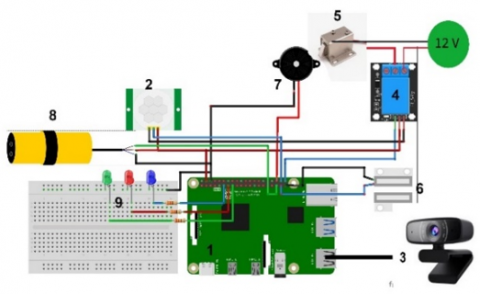
Room security devices use the Raspberry Pi model 4b as a data processing center because it has advantages over other models [23]. Proximity sensors and Passive Infra Red (PIR) motion detection sensors ensure that what is detected on the front camera is a human face object. The security system also has an open room door detection facility using a magnetic sensor. Table 3 shows the device used in the study.
Table 3. Research device
|
Device |
Specification |
Utility |
|
Raspberry pi 4b |
Quad core ARM 1,4 GHz, RAM 2 GB |
minicomputer as a data processing center |
|
Webcam |
USB 720HD |
to scan and verify faces |
|
Solenoid door lock |
12v |
to open and lock door |
|
Sensor magnet |
5v |
detects open and closed doors |
|
Sensor PIR |
5v |
Detect the presence of human based on gestures |
|
Sensor Infrared proximity e18-d80nk |
5v |
To detect human distance from the camera |
|
Buzzer |
5v |
as Door Open Alarm |
2.1 Face recognition system in biometric technology
Facial recognition is one of the biometric technologies that can identify and recognize a person from their facial features. In the world of computers, the problem of facial recognition can be solved by visual pattern recognition. Humans can recognize visual patterns from information received by the eyes and then processed by the brain as meaningful pattern objects. Meanwhile, the image or video received by the computer is information in the form of a matrix value of the number of pixels that can be processed into a pattern [24] using specific methods such as machine learning.
The facial recognition system can run in two modes: identification and verification. Facial identification can distinguish a person from others based on specific and unique characteristics based on patterns from biometric data. The identification system will answer the question "Who are you?" by comparing a person's biometric data with all that is stored in the database or known as (1:N). Meanwhile, the face verification system is a comparison of a person's biometrics with one reference biometric on a database claimed to belong to that person or known as one-to-one matching (1:1) [25, 26]. The verification system will ensure that a person is registered and has access rights. Figure 3 is the process flow of the biometric verification system using faces.
Figure 3. Verification process
2.2 Convolutional neural network
CNN is a type of artificial neural network in deep learning [27] that is used to process images and sounds, in this case, classifying and recognizing objects [28]. Neural networks work by imitating nerve cells communicating with interconnected neurons [29]. CNN uses a convolutional operation that applies a filter in each part of the previous input to extract patterns, making CNN unique compared to other neural networks. CNN uses the GPU (Graphics Processing Unit) for processing. In other words, if they use the Nvidia Cuda platform, processing can be much faster than a CPU (Central Processing Unit).
The process flow for training the CNN model as a face database, testing the accuracy of the model, and testing the biometric security system can be seen in Figure 4.
The process begins by preparing a facial dataset collected by taking facial images using a webcam camera. Then entering the pre-processing stage, the image is converted to grayscale to reduce data dimensions. The size of each image is changed to 50×50 pixels to speed up the training process. The image is augmented by rotating the face object and changing the brightness level. The pre-processing results are input to the convolution operation to retrieve features from the image. Convolution goes into the process of training the model with CNN. The training process produces a model that contains statistical data from each image which becomes the knowledge base for the model testing process. Figure 5 shows the stages of model testing.
Figure 4. CNN training process
Figure 5. CNN model testing
Figure 6. CNN process
The test image is processed as in training. The results of feature extraction and classification at this stage are compared with the knowledge base data from the model. The result at this stage is the accuracy value of the model. The higher the level of accuracy, the better the quality of the model built.
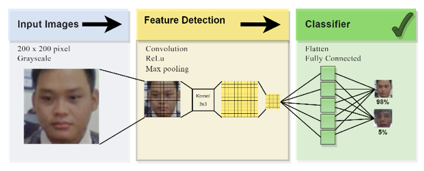
CNN details for classifying image objects [29] as shown in Figure 6.
The convolution layer is the backbone of CNN. This layer retrieves image data, then applies a filter or kernel over the image. This kernel or filter extracts features by doing a dot-product, then the dot-product will be handed over to the next layer. The feature extraction process is carried out using convolution or shifting the kernel with a specific size from the top left to the bottom correct, which is then multiplied by the pixel value of the entire image. This process will produce an output of values in the form of multidimensional arrays called feature maps. Furthermore, the results of the feature maps are activated using a technique, ReLu. ReLu can make negative pixel values zero. The values contained in the features maps must be reduced to reduce the dimensions of the data using the polling process. Two techniques are commonly used at this stage, using an average of values or finding the maximum value in a matrix of a specific size, such as 2×2 pixels. Using the polling layer will reduce the value of feature maps by half. The value of the feature maps generated from the polling process is still a multidimensional array, so it must be flattened, a technique that can convert a multidimensional matrix into a one-dimensional matrix. This flattened array value can then be processed to fully connected to produce a final decision in the form of a class prediction of the object [30].
2.3 Performance evaluation
The evaluation aims to measure the performance of the room security system that has been built. Two evaluations are used in this study. Moreover, the first is to test the model built from CNN deep learning to identify faces using a confusion matrix. A confusion matrix is a table that displays the results of a classification to measure the accuracy of a model from supervised machine learning with outputs in the form of two or more classes. Four terms can be used as measurement materials: TP, FP, TN, and FN. In this study, measurements are made to look for accuracy by looking at how much of the predicted data is correct from the total data used, known as TP. Models that have good accuracy will be used to build facial recognition systems and tested using biometric-based security system performance measurements to verify. The performance of the biometric security system uses the EER from the meeting point between the FAR and FRR lines [31].
2.3.1 CNN model
The problem in deep learning is how to get a good and accurate data model from the training dataset process. In order to get a model with good accuracy, an evaluation of the model based on the classification results is carried out using test data. The results of measuring the accuracy of the model testing process have several terms, namely TP. TP is the result used to measure how much actual positive data is correctly predicted from the total data, for example, the face of a person named "risma" and the system indicates "risma". To get the accuracy of the model being trained, the equation used is [32]:
$A C C=\frac{T P}{n}$ (1)
2.3.2 Measure the FAR value
FAR is one of the performances of a biometric-based security system to measure the error rate of a person who is not registered in the database (recognized) and does not have access. However, the system seems to recognize him as one in the database and grants access, termed FP. For example, if "Aldi" tries to access the door to enter the room, the system allows it to enter. Even though "Aldi" includes people who are not registered in the database in this study. To measure FAR, the equation used is [31]:
$F A R=\frac{F P}{n}$ (2)
2.3.3 Measure the FRR value
FRR is a measurement of how big the system's error rate is in recognizing someone who is truly legitimate but is rejected or unknown and is termed FN. For example, a registered person has access on behalf of "leo" when trying to enter the room, but the system does not allow it because it is not recognized. The equation can measure FRR [31]:
$F R R=\frac{F N}{n}$ (3)
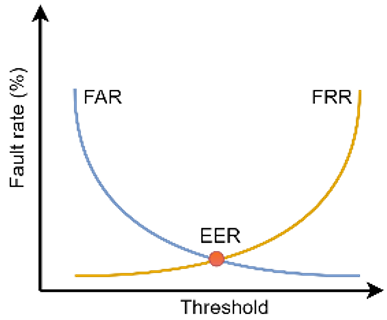
FAR and FRR measurements will produce lines meeting each other on a graph called EER [33], as shown in Figure 7.
Figure 7. FAR and FRR lines
The meeting of these two lines is called the EER (Equal Error Rate) point with FAR = FRR. EER can be used as a reference for how big the error is in testing security systems using biometric data.
3.1 Build CNN model
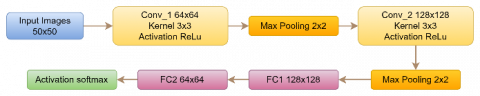
The CNN model was built using two hidden layer architectures, 64×64 and 128×128, with the input image resized to 50×50 pixels to speed up the computation process. Two kernel filters are used following the number of hidden layers with a size of 3×3. A size 3×3 filter kernel is commonly used in CNN architecture [27]. The kernel is decisive because it gets new representative information from the multiplication results in the input image section. Figure 8 displays the CNN architecture used in this study.
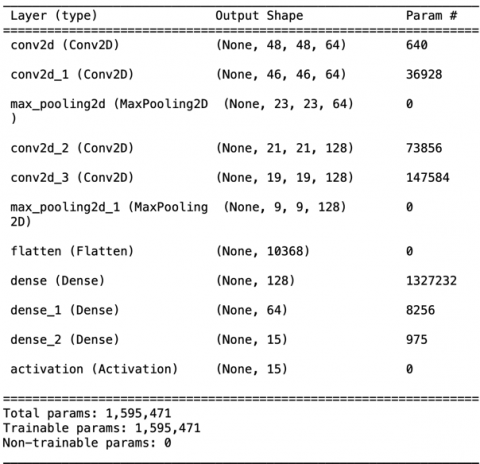
Based on the architecture used, as shown in Figure 8, the summary results are obtained as shown in Figure 9.
Figure 8. CNN architecture
Figure 9. CNN architecture summary
Figure 9 displays a summary of the CNN process. In the convolutional layer, the inserted image is 50×50 pixels in padding so that the pixel values on the edges of the image are discarded so that they become 48×48 and 46×46. The convolution operation uses a 3×3 kernel filter and 64-channel feature maps. So that the image dimensions are 46×46×64 pixels. Furthermore, maximum pooling is used to reduce the dimensions of feature maps (downsampling) so that the image size is 23×23×64 pixels. Then the convolution and maximum pooling processes are repeated until the image size is 9×9×128 pixels. These feature maps are still multi-dimensional arrays, so they are flattened into one-dimensional arrays for input from the fully connected layer with 128 feature maps connected to 10,368 nodes. The activation function used is ReLu to get the output value, after which the matrix multiplication is performed. The last stage is activation using softmax with an output of 15 nodes, producing a form of neurons interconnected to objects that have been given name labels. The total weight of the parameters used is 1,595,471. The results of the data that have been trained will be stored in a model that can be used for testing.
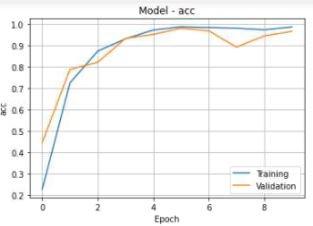
The epoch used for data training is 10, with a batch size of 32 data in processing. The validation setting during training is 20% of the training data sample. Validation is needed to determine how much accuracy and loss error are when training the data for each iteration. Figure 9 is a graph of CNN training results built based on the architecture.
Figure 10(a) is an accuracy graph during the training process. The trend line shows an increase in training accuracy results from iterations 1-10 with the highest value of 0.9875, while the validation trend line also increased with the highest value of 0.9667. Between the training and validation lines, the value difference is not much, so overfitting does not occur. Likewise, the loss in Figure 10(b) in training from iterations 1-10 has decreased to close to zero. Loss during training gets the lowest value of 0.0475 and validation 0.2021. The loss function used is categorical cross-entropy. This function is widely used in classification tasks. Categorical cross entropy can measure the difference between two probability distributions for specific variables to minimize loss. Categorical cross-entropy is used because the data is multiclass and requires labels to be coded as categories. For example, if the data consists of three classes, then the data representation is [0, 0, 1], [0, 1, 0], and [1, 0, 0]. The summary of loss values in training and validation can be seen in Figure 11.
(a) Training accuracy
(b) Training loss
Figure 10. CNN training results
Figure 11. Summary of loss values
Using Categorical cross-entropy, in every iteration of training and validation, the loss value is continuously improved so that it continues to decrease to near zero, and there is no overfitting in this experiment.
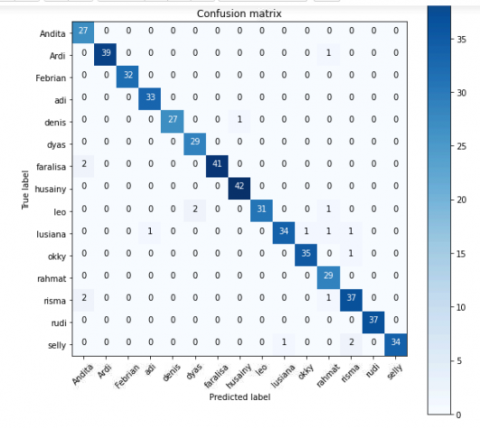
Model testing is carried out to evaluate how good the accuracy is using the confusion matrix from the test data of 525 registered person images based on Eq. (1). The results of model testing can be seen in Figure 12.
Based on Figure 12, the model's accuracy trained with Eq. (1) can be calculated. TP is obtained by knowing how much of the predicted data is correct, then dividing it by the total test data. Of the 15 classes with 525 image data tested, 507 prediction results were correct as an example of data named "risma" which has 40 actual data. The model built correctly predicted 37 data, while three data were predicted wrong. Two data are predicted as "andita", and one data is predicted as "rahmat" which is marked with a red box in Figure 10. So the accuracy of the model is: $A C C=\frac{507}{525}=0.9675 \times 100 \%=96.75 \%=97 \%$.
Figure 12. Confusion matrix of model
This model gets a high accuracy score, so it can be used as a knowledge database to build a security system by identifying humans based on faces. However, the results can differ if more training and test datasets are used. As Sun et al. [7] researched, they used CNN based on DeepFace architecture with VGG16 and InceptionResNetV2 models. The best accuracy obtained is 84.6% with a total YouTube Faces (YTF) Dataset that includes 621,126 images of 1,595 identities. Yang [6] also researched face recognition based on CNN VGG16 with more varied models: DeepFace, CaffeFace, DeepID2, and MicroFace. The four models tested produced an accuracy of above 96%. Accuracy results depend on the CNN architecture and the model used. The hardware specifications also significantly affect the training and testing process on CNN. However, due to limited resources on the Raspberry Pi, the researchers used the architecture shown in Figure 8 because it is pretty accurate in training and testing the data used.
3.2 Biometric security testing
FAR and FRR testing to analyze the performance of the room security system by verifying legitimate users and unauthorized users using the facial dataset model from CNN. FAR and FRR values depend on the threshold value T (Threshold) or the limit value determining whether an image can be recognized. A low T value can make the system more vulnerable and easy for unauthorized users to enter. Conversely, if the T value is high, the system will be more secure [34]. The T value ranges from 0 to 1 or 0 to 100%. This study uses a T value of 50% - 100% to find the best performance to recognize legitimate and unauthorized users.
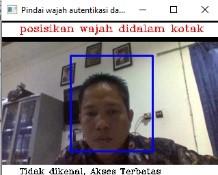
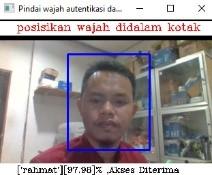
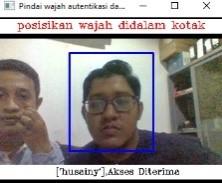
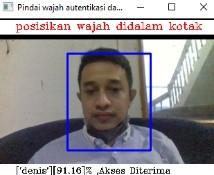
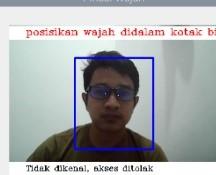
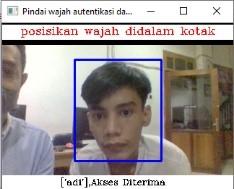
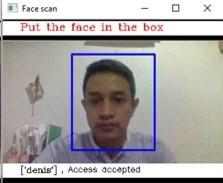
The FRR and FRR tests are based on image samples from 15 registered people (genuine images) using five images each so that the total (P) is 75 data. Whereas the FAR test uses three people who are not registered (image falsification) with five image samples each so that the total (N) is 15. Figure 13 is an example of testing using T=80%.
Figure 13. Testing of FAR dan FRR
Figure 13 is an example of a biometric test. Figure 13(a) is a registered person who cannot be recognized at a certain threshold so that the status is limited access. In this case, it is referred to as FN in measuring the FRR value. Figure 13(b) is a person registered in the system and recognized so that the status is accepted and referred to as TP. In measuring FAR and FRR, TP is not involved. Meanwhile, Figure 13(c) is an error in recognizing a person who is not registered. The system recognizes it as "Rahmat" with a similarity percentage of 88.79%, the error in recognizing is referred to as FP in the FAR measurement.
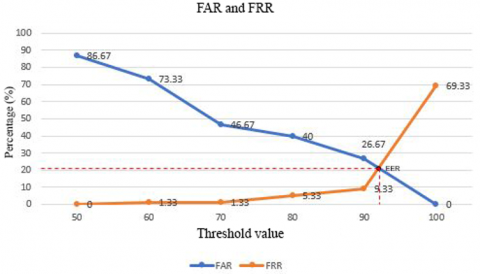
Based on six experiments by testing the threshold, the results are shown in Table 4.
Table 4. Results of FAR dan FRR
|
T (%) |
FN |
FP |
FAR |
FRR |
|
50 |
0 |
13 |
86.67 |
0.00 |
|
60 |
1 |
11 |
73.33 |
1.33 |
|
70 |
1 |
7 |
46.67 |
1.33 |
|
80 |
4 |
6 |
40.00 |
5.33 |
|
90 |
7 |
4 |
26.67 |
9.33 |
|
100 |
52 |
0 |
0.00 |
68.33 |
Based on Table 4, the FAR and FRR values were obtained from six experiments using Eqs. (2) and (3). To get the EER value to calculate the difference between FAR and FRR. The smallest value of the difference is the best threshold value and is used to create a graph to find the EER value. The best threshold value is T=90%, with a minor difference in FAR, and FRR is 17.33. The graph for obtaining the EER value can be seen in Figure 14.
The graph in Figure 14 displays the FAR and FRR lines formed from Table 4. The FAR line shows a decreasing trend, while the FRR line shows an increasing trend. The meeting point between the two lines is called EER, which means that the CNN model's biometric security test has an error rate of 21.33%. Ideally, the error value is close to zero. The smaller, the better the security level.
Figure 14. FAR and FRR graphs
3.3 Room security device design
3.3.1 Hardware design
Based on Table 3 regarding the need for research tools, the schematic design of room security devices can be shown in Figure 15.
Figure 15. Device schematic
Figure 15 illustrates the schematic circuit, input, and output sensor devices connected to Raspberry Pi as the primary control. The Raspberry pi manages input from PIR sensors, infrared proximity, magnetic sensors, and a USB webcam. Then process it to control the door lock solenoid, buzzer, and LED indicators.
3.3.2 Software design
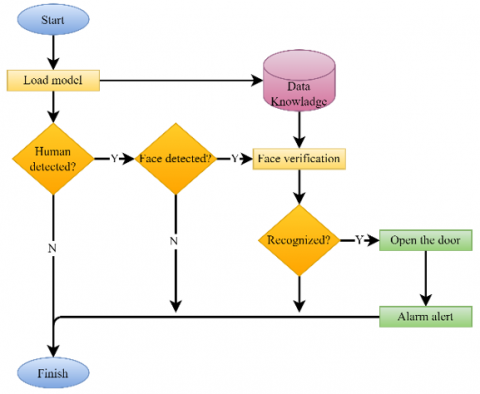
The workings of the room security devices built in the study are shown in Figure 16.
The process begins by loading the model that has been built and tested using FAR and FRR. This model contains a database of knowledge about the faces of registered people who have access to the room. Then the device detects the presence of people in front of the door to enter the room by detecting their distance and body movements. If a person is detected, the system scans whether a face is detected. If a face is detected, the system starts verifying it by recognizing it and checking whether it is registered and has access rights to enter. If the verification is successful, the door will automatically open, and the alarm will signal that someone has entered the room.
Figure 16. Room security system process flow
3.4 System test scenario
It is testing with various scenarios to ensure that the system can carry out processes based on its functions in real time and determine the response of the hardware. The test was carried out randomly with several respondents using the CNN model, and the value of T = 90%. Table 5 is the result of the system testing scenarios.
Test scenario Table 5 with conditions for ten experiments to test the verification system in real-time, hardware functions such as input and output sensors. Based on ten experiments, there are drawbacks of this device and how to maximize it so that facial scanning and use are more accurate in predicting.
First, errors in recognizing a person's face are caused by variations in data that are less varied and different lighting between training and scanning data collection. Cases like this can be overcome by making the training data more varied such as facing left, right, up, and down. In addition, taking pictures in the same lighting conditions and position between the training and scanning data is very influential in improving accuracy.
Second, the image results from the training and test data could be better and have low resolution. Facial image capture and scanning should use the same webcam device and have a minimum High Definition (HD) resolution of 1080p. In addition, increasing the composition of the training image data can also improve the scanning accuracy.
Table 5. Device test scenarios
|
Eksp |
Test Scenario |
Prediction |
Name |
Condition |
Door Lock |
Alarm |
Door Magnetic Sensor |
Indicator |
Status |
|
1 |
- |
- |
No face |
Off |
Off |
Off |
Led blue |
True |
|
|
2 |
Not found |
Not found |
The face is not in the blue box |
Off |
Off |
Off |
Led red |
True |
|
|
3 |
Unknown |
Obert |
Good lighting, faces not registered |
Off |
Off |
Off |
Led red |
True |
|
|
4 |
Rahmat |
Ardi |
The lighting is not good, and the scanning position is not the same as the dataset |
On |
Off |
Off |
Led red |
False |
|
|
5 |
Too far |
Denis |
Dark lighting, and scan position are not the same as the database |
Off |
Off |
Off |
Led red |
True |
|
|
6 |
Husainy |
Husainy |
The lighting is not good, and the scanning position is the same as the dataset. |
On |
On |
On |
Led red, green |
True |
|
|
7 |
Denis |
Denis |
Good lighting, scan position same as the dataset |
On |
On |
On |
Led red, green |
True |
|
|
8 |
Unknown |
Denis |
The lighting is not good, and the scanning position is not the same as the dataset. |
Off |
Off |
Off |
Led red |
False |
|
|
9 |
Adi |
Adi |
Good lighting, scan position same as the dataset |
On |
On |
On |
Led red, green |
True |
|
|
10 |
Yana mulyana |
Denis |
The lighting is not good, and the scanning position is not the same as the dataset |
On |
On |
On |
Led red, green |
False |
|
|
11 |
Lusiana |
Unknown |
The lighting is not good |
Off |
Off |
Off |
Led red |
False |
|
|
12 |
Okky |
Okky |
Good lighting, scan position same as the dataset |
On |
On |
On |
Led red, green |
True |
|
|
13 |
Selly |
Selly |
Good lighting, scan position same as the dataset |
On |
On |
On |
Led red, green |
True |
|
|
14 |
Denis |
Rahmat |
The lighting is not good, and the scanning position is not the same as the dataset |
On |
On |
On |
Led red, green |
False |
|
|
15 |
Denis |
Denis |
Good lighting, scan position same as the dataset |
On |
On |
On |
Led red, green |
True |
Based on 15 classes of registered person data consisting of 2625 facial images, divided into 2100 training images and 525 test images, the CNN model produces a 97% accuracy in identifying faces. The model on which data knowledge is based on building the required security system uses FAR and FRR indicators to verify authorized and unauthorized users. The test results show the value of FAR = 26.67%, FRR = 9.33% of the best threshold, and T = 90%. These results obtain an EER value of 21.33% and are still considered ideal for use in room security devices with face verification. However, things still need to be corrected in recognizing and verifying because the finalized model consists of low-resolution data images, lack of variation, and lighting effects. Future work will improve the accuracy of facial datasets for training and develop anti-spoofing using artificial neural networks.
|
ACC |
CNN model testing accuracy |
|
TP |
True Positive |
|
FP |
False Positive |
|
FN |
False Negative |
|
FAR |
False Acceptance Rate |
|
FRR |
False Rejection Rate |
|
ERR |
Equal Error Rate |
|
n |
Total data |
[1] Rajasab, N., Rafi, M. (2022). A deep learning approach for biometric security in video surveillance system using gait. International Journal of Safety and Security Engineering, 12(4): 491–499. https://doi.org/10.18280/ijsse.120410
[2] Muhammad, J., Wang, Y., Wang, C., Zhang, K., Sun, Z. (2021). Casia-face-Africa: A large-scale African face image database. IEEE Transactions on Information Forensics and Security, 16: 3634-3646. https://doi.org/10.1109/TIFS.2021.3080496
[3] Zhao, F., Li, J., Zhang, L., Li, Z., Na, S.G. (2020). Multi-view face recognition using deep neural networks. Future Generation Computer Systems, 111: 375-380. https://doi.org/10.1016/j.future.2020.05.002
[4] Lin, Y., Xie, H. (2020). Face gender recognition based on face recognition feature vectors. In 2020 IEEE 3rd International conference on information systems and computer aided education (ICISCAE), pp. 162-166. https://doi.org/10.1109/ICISCAE51034.2020.9236905
[5] Shahar, M.S.M., Mazalan, L. (2021). Face identity for face mask recognition system. In 2021 IEEE 11th IEEE Symposium on Computer Applications & Industrial Electronics (ISCAIE), pp. 42-47. https://doi.org/10.1109/ISCAIE51753.2021.9431791
[6] Yang, Z.Q. (2021). Face recognition based on improved VGGNET convolutional neural network. IAEAC 2021 - IEEE 5th Advanced Information Technology, Electronic and Automation Control Conference, pp. 2530–2533. https://doi.org/10.1109/IAEAC50856.2021.9390856
[7] Sun, Q., Redei, A. (2021). Knock knock, who’s there: Facial recognition using CNN-based classifiers. International Journal of Advanced Computer Science and Applications, 13(1): 9–16. https://doi.org/10.14569/IJACSA.2022.0130102
[8] Ren, Y., Xu, X., Feng, G., Zhang, X. (2021). Non-Interactive and secure outsourcing of PCA-Based face recognition. Computer Security, 110: 1–11. https://doi.org/10.1016/j.cose.2021.102416
[9] Almotiri, J. (2022). Face recognition using principal component analysis and clustered self-organizing map. International Journal of Advanced Computer Science and Applications, 13(3): 509–520. https://doi.org/10.14569/IJACSA.2022.0130361
[10] Fu, L., Shao, X. (2020). Reseach and implementation of face detection, tracking and recognition based on video. Proceedings - 2020 International Conference on Intelligent Transportation, Big Data and Smart City, ICITBS, pp. 914–917. https://doi.org/10.1109/ICITBS49701.2020
[11] Budiman, A., Yaputera, R.A., Achmad, S., Kurniawan, A. (2023). Student attendance with face recognition (LBPH or CNN): Systematic literature review. Procedia Computer Science, 216: 31-38. https://doi.org/10.1016/j.procs.2022.12.108
[12] Paul, J., Bhowmick, R.S., Sen, R., Ray, D., Manjhi, S.S., Sen, S., Sikdar, B.K. (2020). Evaluation of face recognition schemes for low-computation Iot system design. In 2020 24th International Symposium on VLSI Design and Test (VDAT), pp. 1-6. https://doi.org/10.1109/VDAT50263.2020.9190569
[13] Sajja, T., Kalluri, H. (2019). Gender classification based on face images of local binary pattern using support vector machine and back propagation neural networks. Advances in Modelling and Analysis B, 62(1): 31–35. https://doi.org/10.18280/ama_b.620105
[14] He, R., Cao, J., Song, L., Sun, Z., Tan, T. (2019). Adversarial cross-spectral face completion for NIR-VIS face recognition. IEEE transactions on pattern analysis and machine intelligence, 42(5): 1025-1037. https://doi.org/10.1109/TPAMI.2019.2961900
[15] Duan, Q., Zhang, L. (2020). Look more into occlusion: Realistic face frontalization and recognition with boostgan. IEEE Transactions on Neural Networks and Learning Systems, 32(1): 214-228. https://doi.org/10.1109/tnnls.2020.2978127
[16] Massoli, F.V., Carrara, F., Amato, G., Falchi, F. (2021). Detection of face recognition adversarial attacks. Computer Vision and Image Understanding, 202: 103103. https://doi.org/10.1016/j.cviu.2020.103103
[17] Zhu, Y., Jiang, Y. (2020). Optimization of face recognition algorithm based on deep learning multi feature fusion driven by big data. Image and Vision Computing, 104: 104023. https://doi.org/10.1016/j.imavis.2020.104023
[18] Tabassum, F., Islam, M.I., Khan, R.T., Amin, M.R. (2022). Human face recognition with combination of DWT and machine learning. Journal of King Saud University-Computer and Information Sciences, 34(3): 546-556. https://doi.org/10.1016/j.jksuci.2020.02.002
[19] Archana, P., Divyabharathi, P., Balaji, S.R., Kumareshan, N., Veeramanikandan, P., Naitik, S.T., Rafi, S.M., Nandankar, P.V., Manikandan, G. (2022). Face recognition based vehicle starter using machine learning. Measurement: Sensors, 24: 100575. https://doi.org/10.1016/j.measen.2022.100575
[20] Shavetov, S., Sivtsov, V. (2020). Access control system based on face recognition. In 2020 7th International Conference on Control, Decision and Information Technologies (CoDIT), Prague, Czech Republic, pp. 952-956. https://doi.org/10.1109/CoDIT49905.2020.9263894
[21] Khalifa, A.F., Badr, E., Elmahdy, H.N. (2019). A survey on human detection surveillance systems for Raspberry Pi. Image and Vision Computing, 85: 1-13. https://doi.org/10.1016/j.imavis.2019.02.010
[22] Süzen, A.A., Duman, B., Şen, B. (2020). Benchmark analysis of jetson tx2, jetson nano and raspberry Pi using deep-CNN. In 2020 International Congress on Human-Computer Interaction, Optimization and Robotic Applications (HORA), pp. 1-5. https://doi.org/10.1109/HORA49412.2020
[23] Gamess, E., Hernandez, S. (2022). Performance evaluation of different Raspberry Pi models for a broad spectrum of interests. International Journal of Advanced Computer Science and Applications, 13(2): 819–829. https://dx.doi.org/10.14569/IJACSA.2022.0130295
[24] Li, L., Mu, X., Li, S., Peng, H. (2020). A review of face recognition technology. IEEE access, 8: 139110-139120. https://doi.org/10.1109/ACCESS.2020.3011028
[25] Sayeed, M.S., Min, P.P., Bari, M.A. (2022). Deep learning based gait recognition using convolutional neural network in the COVID-19 pandemic. Emerging Science Journal, 6(5): 1086-1099. https://doi.org/10.28991/ESJ-2022-06-05-012
[26] Taskiran, M., Kahraman, N., Erdem, C.E. (2020). Face recognition: Past, present and future (A review). Digital Signal Processing, 106: 102809. https://doi.org/10.1016/j.dsp.2020.102809
[27] Li, Z., Liu, F., Yang, W., Peng, S., Zhou, J. (2021). A survey of convolutional neural networks: Analysis, applications, and prospects. IEEE transactions on neural networks and learning systems, 33(12): 6999–7019. https://doi.org/10.1109/TNNLS.2021.3084827
[28] Janiesch, C., Zschech, P., Heinrich, K. (2021). Machine learning and deep learning. Electronic Markets, 31(3): 685–695. https://doi.org/10.1007/s12525-021-00475-2
[29] Kiranyaz, S., Avci, O., Abdeljaber, O., Ince, T., Gabbouj, M., Inman, D.J. (2021). 1D convolutional neural networks and applications: A survey. Mechanical systems and signal processing, 151: 107398. https://doi.org/10.1016/j.ymssp.2020.107398
[30] Gullapelly, A., Banik, B.G. (2021). Classification of rigid and non-rigid objects using CNN. Revue d’Intelligence Artificielle, 35(4): 341–347. https://doi.org/10.18280/ria.350409
[31] Ampamya, S., Kitayimbwa, J.M., Were, M.C. (2020). Performance of an open source facial recognition system for unique patient matching in a resource-limited setting. International Journal of Medical Informatics, 141: 104180. https://doi.org/10.1016/j.ijmedinf.2020.104180
[32] Kabisha, M.S., Rahim, K.A., Khaliluzzaman, M., Khan, S.I. (2022). Face and hand gesture recognition based person identification system using convolutional neural network. International Journal of Intelligent Systems and Applications in Engineering, 10(1): 105–115. https://doi.org/10.18201/ijisae.2022.273
[33] Singh, G., Singh, R.K., Saha, R., Agarwal, N. (2020). IWT based iris recognition for image authentication. Procedia Computer Science, 171: 1868-1876. https://doi.org/10.1016/j.procs.2020.04.200
[34] Harakannanavar, S.S., Renukamurthy, P.C., Raja, K.B. (2019). Comprehensive study of biometric authentication systems, challenges and future trends. International Journal of Advanced Networking and Applications, 10(4): 3958-3968. https://doi.org/10.35444/ijana.2019.10048