Senthil Raman*![]() | Narayanan Balakrishnan
| Narayanan Balakrishnan![]() | Velmurugan Kailasam
| Velmurugan Kailasam![]()
© 2023 IIETA. This article is published by IIETA and is licensed under the CC BY 4.0 license (http://creativecommons.org/licenses/by/4.0/).
OPEN ACCESS
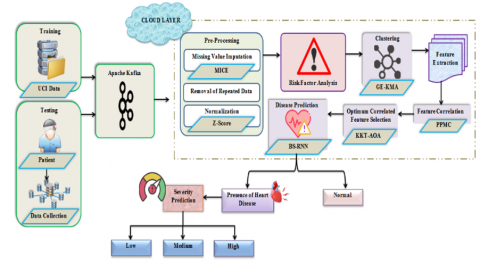
Heart disease, a leading cause of mortality globally, is increasingly impacting populations worldwide. Effective prediction methods are essential to mitigate this growing health crisis. This study proposes a novel prediction framework, employing a Bipolar Sigmoid-Recurrent Neural Network (BS-RNN), to efficiently classify the heart disease database. Initially, patient health data and body function details are collected and balanced using Apache Kafka before being stored in a cloud database. This balanced data is then pre-processed and subjected to risk analysis. Subsequently, risk and non-risk factors are clustered using the Gibbs Entropy-K-Means Algorithm (GE-KMA), from which features are extracted. The correlation between the extracted features and those trained on the UCI database is assessed using a Pre-Policy Medical Check-Up (PPMC). Subsequently, the Karush-Kuhn-Tucker-Arithmetic Optimization Algorithm (KKT-AOA) is employed to select the optimal correlated features. These features are then input into the BS-RNN classifier for heart disease prediction. In addition to prediction, the framework measures disease severity based on the extracted features. The performance of the proposed model was found to surpass existing techniques, achieving an accuracy of 98.95%, an F-measure of 96.01%, and a specificity of 96.93%. The proposed clustering algorithm also demonstrated efficiency, forming clusters in 6208 ms with a superior prediction rate. These results underscore the potential of the proposed disease prediction framework to outperform existing methods in heart disease prediction.
disease prediction, Bipolar Sigmoid-Recurrent Neural Network (BS-RNN), Gibbs Entropy-K-Means Algorithm (GE-KMA), Karush-Kuhn-Tucker- Arithmetic Optimization Algorithm (KKT-AOA), risk analysis
Human Heart plays a significant role in the functioning of the circulatory system. Yet, human habitual changes adversely affected the normal functioning of the heart and resulted in cardiovascular disease (CVD) [1]. According to the World Health Organization (WHO) report, about one-third of the population died from CVD, which acts as a leading cause of death recently [2]. Hence, an accurate diagnosis of CVD can aid in saving the lives of humans. Certain common causes responsible for heart disease are Cholesterol, High Blood Pressure (BP), and Obesity. Clinicians predicted heart disease based on their intuitions, which were not effective. In general, healthcare centres generate a huge amount of data [3]. Thus, computer-based records of the patients are maintained to improve the service quality and human lives. However, it was not possible to process a large number of patient health details on the centralized server. Hence, the big data concept is introduced for the effective prediction and tailoring of the CVD. Thus, big data is used in various applications like healthcare, business, education, etc. [4].
One of the biggest advantages of using big data in healthcare is not only its volume but also the speed and diversity of health data management. Some of the details that make up “big data” in healthcare include the physician’s prescriptions, laboratory results, pharmacy details, and patient data in Electronic Health Records (EHRs), including emergency care data [5] Descriptive analysis, predictive analysis, prescriptive analysis, and discovery analysis are the various categories involved in the medical big data analysis approach. Here, descriptive analysis is used for analysing the conventional and existing healthcare decisions based on historical data. Then, the response of the patient to different dosages of medicine is analysed through predictive and prescriptive analysis [6]. Thus, big data help doctors in providing patient-specific treatments.
Numerous invasive and non-invasive techniques are utilized for heart disease prediction using big data. Invasive methods are nothing but manual procedures, whereas non-invasive methods [7] are the Machine Learning (ML) and Deep Learning (DL) algorithms used for disease prediction based on the medical history, and the symptoms analysed by the clinicians without opening the skin [8]. Here, predictions and classifications are made based on the features learned. But, the severity of the heart disease is not considered, which in turn affected the disease prediction accuracy. Hence, a BS-RNN-based heart disease prediction framework is proposed in this work using GE-KMA and KKT-AOA techniques. The greatest advantage of using ML and DL techniques is their ability to make predictions based on the pattern of the data [9].
Problem Statement
Despite the various advantages offered by the existing disease prediction techniques, there exist certain downsides that are enlisted as follows:
Hence, in order to overcome the aforesaid shortcomings, an efficient disease prediction technique is proposed and its main contributions are:
Objectives and Motivation
The main objectives of this work are as follows:
1. To explore the situations due to heart disease worldwide, so the impact and their analysis can be discussed properly.
2. To provide the statistical analysis based on the available data to compare the impacts and the risk factors.
3. To provide an efficient heart disease prediction system easily applicable for standard available datasets.
4. To provide the combination of algorithms for the efficient use of the combination in the prediction.
5. To include maximum possible parameters so that the real impacts can be calculated and observed.
The main motivation of this work is to propose an efficient approach for the heart disease prediction for achieving the better the accuracy
Scope of the Work
Several approaches and methodologies have been introduced in the perspective study and exchange. A subset of systems is being subjected to a range of parameters, but overall accuracy is lacking. There are certain levels of proficiency in this field that need to be achieved in order to advance the expectation technique. Therefore, this study proposes a system that utilizes enhanced data extraction techniques to enhance the early identification of cardiovascular illness. Multiple ongoing research projects are currently being conducted in this field, with a primary emphasis on achieving the requirements in the early phase. Cardiac disorders exhibit a wide range of symptoms, necessitating diverse approaches to maximize the chances of favorable results. Our exploration strategy emphasizes the early detection of opportunities by employing data mining and evolutionary algorithms. The system's performance is evaluated by utilizing the Cleveland heart disease database and the Statlog heart disease dataset, both obtained from the UCI machine learning dataset repository. This database includes clinical factors such as the kind of fasting blood sugar, chest pain, gender, cholesterol levels, resting blood pressure, age, resting electrocardiogram (ECG), maximum heart rate, exercise-induced angina, ST depression generated by exercise relative to rest, the slope of the peak exercise ST segment, and the number of major arteries colored by fluoroscopy.
Following an examination of the literature review in Section 2, a discussion of the proposed methodology is presented in Section 3, the results and discussion are summarized in Section 4, and finally, Sections 5 and 6 conclude the study with a discussion of potential future research.
Kavitha et al. [10] presented a Deep Convolutional Neural Network (DCNN) based heart disease prediction approach. In this methodology, a Least Absolute Shrinkage (LAS) method was used for selecting the optimal variables through a regularization process. The selected variables were then fed into the DCNN for the classification process. Thus, the data overfitting problem was avoided by this approach. Yet, the presented approach was trained only with a limited number of features, which was the major downside, and it is developed the Ensemble DL(EDL) based disease prediction model using feature fusion techniques. Initially, the features extracted from the Electronic Medical Records (EMR) were fused and the optimal features were selected using the Information Gain (IG) technique [11]. The selected features were then fed into the meta-learning classifier to produce the predicted results. Experimental results proved the efficacy of the presented approach. Conversely, the disease prediction based on the weight values of the features produced infeasible results.
Mehmood et al. [12] propounded Heart Disease Prediction Model (HDPM) named Clinical Decision Support System (CDSS). Here, a Density-Based Spatial Clustering (DBSC) technique was used for eliminating unwanted noises. Moreover, data balancing and disease prediction were performed using a hybrid Synthetic Minority Over-sampling Technique-Edited Nearest Neighbor (SMOTE-ENN) technique. Thus, the unwanted overlapping samples were effectively eliminated. Nevertheless, the presented approach failed to work on other patient demographic datasets.
Nilashi et al. [13] employed a Decision Support System (DSS) for the prediction of heart disease using ML techniques. Pre-processing, feature selection using Genetic Algorithm (GA) and Recursive Feature Elimination (RFE), feature scaling, and classification were the various steps involved in the presented disease prediction technique. Hence, the usage of noise removal and missing value imputation techniques aided in the optimal disease prediction strategy. On the contrary, the presented approach failed to detect the severity of the heart disease.
Princy et al. [14] suggested a Convolutional Neural Network (CNN) for the prediction of heart disease. Here, a Least Absolute Shrinkage and Selection Operator (LASSO) was used for the identification of crucial features, which in turn was homogenized and passed into CNN for prediction. Thus, the data imbalance problem was effectively avoided by this technique. However, the presence of mislabelled data resulted in the misclassification problem.
Rani et al. [15] projected an Adaptive GA with Fuzzy Logic (AGAFL) based heart disease detection methodology. In this technique, the features extracted were reduced using Rough Set Theory (RST) and fed into the AGAFL classifier for disease prediction. Hence, the noises were effectively handled, and local optimum entrapment was avoided. But the rule-based fitness value generation for disease prediction produced invalid results.
Reddy et al. [16] deployed cluster-based Decision Tree Learning (CDTL) methodology for heart disease prediction. Here, significant feature selection was performed using Decision Tree (DT)-based technique. Depending on the selected features, heart disease classification was carried out. Hence, the entropy-based partition adapted in this framework reduced the dimensions of the features without reducing the accuracy of disease prediction.
Guruprasad et al. [17] Nonetheless, disease identification based on the interconnecting features was the major downside. Abdel-Basset et al. [1] exaggerated Neutrosophic Multi-Criteria Decision Making (NMCDM) heart disease prediction method. Data collection, pre-processing, feature extraction, selection, and classification were the various steps involved in the presented methodology. The usage of the fuzzy inference system improved the disease detection accuracy of the approach. Yet, the disease prediction based on the weight values was not effective.
Singh and Kumar [18] utilized a heartbeat detector that employed two Hidden Markov Models (HMMs) to analyze the patterns of heartbeats in Electrocardiogram (ECG) and Arterial Blood Pressure (ABP) readings. The HMM-based detector has the capability capability to make use of either univariate observations, such ABP or ECG signals, or bivariate observations, in which the ECG and ABP data are analyzed jointly in a centralized fashion. Both of these observation types are described in the following paragraphs.to make use of either univariate observations, such ABP or ECG signals, or bivariate observations, in which the ECG and ABP data are analyzed jointly in a centralized fashion. Both of these observation types are described in the following paragraphs.
Tougui et al. [19] the absolute value function and the squared function were both incorporated into the signal alterations that were carried out. Therefore, a total of ten recordings from the MGH/MF waveform database were used to test and validate nine single-variable detectors and six two-variable detectors. These detectors were built using single-variable and two-variable observations, respectively. The detection performance achieved a TP (true positive) value of 58736, FN (false negative) value of 631, FP (false positive) value of 788, sensitivity of 98.73%, and positive predictivity of 98.22% when the HMM was used in conjunction with both the absolute value of the ECG and the absolute value of the ABP.
BS-RNN-based heart disease prediction using cloud storage data is proposed in this work and the process involved is detailed further down. The structural design of the proposed methodology is framed in Figure 1.
Figure 1. Structural design of the proposed UCI dataset framework
3.1 Data collection
Primarily, the data regarding the Age, Sex, Blood pressure (Bp) level, Serum Cholesterol level, etc., are obtained from the patient via the body sensors placed in the patient's body. Moreover, the variation in the functions of the body parts like the chest heaviness, and the production of edema in the arms and legs are also considered in this paper. Thus, the n-number of data collected from the patient (Dc) is modelled as,
$D_{\mathrm{c}}=\left\{\mathrm{D}_1, \mathrm{D}_2, \mathrm{D}_3, \ldots, \mathrm{D}_{\mathrm{n}}\right\}$ (1)
A dataset is said to be multivariate if it contains a number of separate mathematical or statistical variables. Multivariate numerical data analysis is carried out on datasets that contain the variables. It is made up of 14 different characteristics, which are as follows: sex, age, the type of chest pain that is being experienced, resting blood pressure, fasting blood sugar, resting electrocardiographic results, serum cholesterol, exercise-induced angina, maximum heart rate accomplished, oldpeak — ST depression induced by exercise relative to rest, the slope of the peak exercise ST segment, the number of major vessels, and Thalassemia. All of the research that has been published solely relates to the application of a subset of 14 of these database's features, despite the fact that this database has 76 properties. Researchers in ML have never used any other database besides the Cleveland database, which is the only database they have ever used. One of the most important duties on this dataset is the experimental task of diagnosing the issue and gleaning as many different ideas as possible from this dataset. This could contribute to a better understanding of the issue. The other significant undertaking is to determine, on the basis of the information provided about a patient, whether or not that individual suffers from cardiovascular disease.
3.2 Apache Kafka
The collected data is then given to Apache Kafka. Since large number of data is generated periodically in the healthcare environment, in order to offer better throughput on large-scale health data processing applications, Apache Kafka is utilized. In Apache Kafka, the stream of health data collected is stored for a short duration under a unique heading likely the time of reception of data from the patient. In Apache Kafka, the data stream is published in the form of records, which in turn results in the loss of health data. The process involved in Apache Kafka is depicted below.
$S_{d}=$ Config. Offset.heading $\left[\sum_{c=1}^n D_C\right]$ (2)
where, Sd represents the streamlined health data, Config. Offset. Heading denotes the balancing function in Apache Kafka. The streamlined data is then stored in the cloud.
3.3 Data processing in the cloud
In the cloud layer, effective processing of the streamlined data takes place and the process involved is detailed further down.
3.3.1 Pre-processing
The streamlined data thus obtained is then pre-processed to make it suitable for further analysis. In the proposed framework, pre-processing techniques like missing value imputation, removal of repeated data, and normalization are utilized for efficient processing of the raw streamlined data. The pre-processing techniques are detailed further down.
(1) Missing value imputation using MICE
The presence of missing values in the obtained streamlined health data affects the disease prediction accuracy. Hence, missing value imputation is done. Here, the MICE approach is used for the perfect imputation [17] of the missing values. MICE uses the divide and conquer principle and the process involved in MICE is discussed further down.
Initially, the variables with missing values are replaced using the non-missing values accessible for that corresponding variable.
The replaced non-missing values are then regressed using the respective regression model to determine the missingness in that corresponding variable. Thus, the above procedure is repeated until the missing values are completely imputed. The mathematical formulation for MICE based imputation.
(Smice) is,
$S_{\text {mice}}=$ impute $\left(\mathrm{S}_d\right)$ (3)
In Eq. (3), impute signifies the imputation function.
(2) Removal of repeated data
Next, the repeated data present in the resultant imputed data is removed, which in turn reduces the storage requirement and the training time required for training the same data again and again significantly and is expressed as,
$S_{r r}=\operatorname{remove}\left(S_{\text {mice }}\right)$ (4)
Here, Srr is the output obtained after repeated data removal, remove signifies the constant.
(3) Normalization using Z-Score
After the removal of repeated data, normalization is done to speed up the training process. In order to overcome the numerical problems, namely the precision loss that arises in the disease prediction process, normalization is carried out. Here, normalization is carried out using the Z-score technique to normalize the data in the range (0, 1). The mathematical formulation for the Z-score normalization (Snor) is described below.
$S_{n o r}=\frac{S_{r r}-\lambda}{\mu}$ (5)
In Eq. (3), λ indicates the mean value of the imputed data, μ refers to the standard deviation.
3.3.2 Risk factor analysis
After pre-processing, the risk factor responsible for the presence of heart disease in the patient is analysed based on the numerical and categorical features. Here, the numerical factors correspond to age, serum cholesterol level (Chol), maximum rate of the heartbeat achieved (Thalach), Bp at rest, etc., whereas sex, chest pain (Cp), Electrocardiographic rate at rest, the slope value of the ST segment in the corresponding ECG signal of the patient (Slope) comes under the categorical features. Thus, the process involved in the risk factor analysis (RF) is briefed below.
$R F=$ Analyse $\left(S_{\text {nor }}\right)$ (6)
Thus, the resultant k-number of risk factors (RF) is displayed below,
$R_{F=R_1, R_2, R_3, \ldots, R_k}$ (7)
3.3.3 Clustering through GE-KM
Later, the analysed risk factors are clustered into the sensitive and non-sensitive using GE-KMA. In general, K-Means Algorithm (KMA) is used to perform clustering operations because of its simple and efficient nature. In KMA, cluster centres are selected randomly from the analysed risk factors, and the distance is computed. Based on the Euclidean distance, the data is mapped into the smallest distance measure. However, in the K-Means algorithm [14], the initial $\left(\Omega_{\text {non-sen }}\right)$. Here, heart disease features like the type of chest pain, slope, serum cholesterol level, etc., come under the sensitive factor category, whereas age, sex, and origin are the non-sensitive factors. The cluster centre determination [13] is done randomly. This random selection results in the local optimum problem. Hence, Gibbs Entropy (GE) is used in the proposed methodology to select the optimal cluster centres and thereby, the clustering accuracy is increased. This adaption of GE in the conventional KMA is known as GEKMA. It is explained further.
Let the analysed risk factors (RF) be the input and (Ce) be the initial cluster centres. The M-number of initial cluster centres is expressed as,
$C_e=C_1, C_2, C_2, \ldots C_M,$ (8)
Here, the selection of cluster centroid (Ce) is done using GE and is detailed as follows.
$C_e=-B \sum_F \mathrm{R}_{\mathrm{F}} C_{2,} 1 n\left(R_F,\right)$ (9)
where, B denotes the Boltzmann constant.
$\mathrm{E}(\mathrm{F}, \mathrm{e})=\sum_{e=1}^M \sum_{F=1}^k\left\|R_F-C_e\right\|$ (10)
Here, E(F, e) defines the Euclidean distance between the jth risk factor and the eth cluster centre.
$\operatorname{Obj}(\mathrm{f})=\sum_{e=1}^M \sum_{F \in k}^k\left|R_F-\Gamma\right|^2$ (11)
where, $\Gamma$ defines the mean value of all the clusters CM.
$\Omega_i=\left\{\Omega_i, \Omega_i, \ldots, \Omega_I\right\}$ (12)
where, i=1,2,3,…,I defines the sensitive $\left(\Omega_i\right)$ and non-sensitive facto
3.3.4 Feature extraction
From the clustered sensitive factors, feature extraction takes place. Some of the handcrafted features extracted are Fasting blood sugar (Fbs), Chol, Cp, Slope, Exercise-induced angina (Exang), Plasma Renin Activity (PRA), and Direct Renin Concentration (DRC). They are explained as follows.
PRA signifies the amount of renin pigment required for cleaving the endogenous substrate. DRC specifies the concentration of the renin in the plasma. PRA and DRC play a crucial role in the heart disease prediction process as it causes adverse complications like hypertension. The PRA is determined using the following expression.
PRA $=\frac{A_{\text {after }} A_{\text {before }}}{3}$ (13)
In Eq. (13), Aafter,Abefore indicates the antibody injected for measuring the renin concentration before and after incubation. PRA is generally expressed in ng/ml/h. Thus, the extracted features (yj) are modelled as,
$y_j=\left\{y_1, y_2, y_3, \ldots, y_j\right\}$ (14)
Here, j=1,2,3,…,J points to the J- number of extracted features.
3.3.5 Feature correlation measurement using PPMC
Next, the correlation between the features extracted and the trained UCI dataset features (yuci) takes place using PPMC. PPMC is used because of its better efficiency. PPMC performs correlation measurements based on the relationship strength between the two trained features. The correlation measurement done using PPMC (yppmc) is formulated in (15).
$y_{p p m c}=\frac{\sum\left(y_j y_{u c i}\right)}{\varepsilon \delta\left(y_j\right) \delta\left(y_{u c i}\right)}$ (15)
where, ε is the Pearson constant, $\delta\left(y_j\right) \delta\left(y_{u c i}\right)$ denotes the standard deviation of the extracted features. Thus, the resultant correlated features obtained using PPMC are expressed as (ycorr).
3.3.6 Optimal correlated feature selection via KKT-AOA
In this phase, the selection of optimal correlated features takes place using KKT-AOA. The Arithmetic Optimization Algorithm (AOA) is a versatile optimization algorithm employed for solving various optimization issues. This approach emulates the actions of the arithmetic operators (Multiplication, Division, Addition and Subtraction) when solving arithmetic problems. Nevertheless, the overall ALO algorithm is susceptible to getting stuck in local optima and necessitates a varied exploration strategy that effectively balances exploitation and exploration. So, to overcome such drawbacks, the Karush-Kuhn-Tucker (KKT) optimality condition is integrated into conventional AOA, which enhances the ability of the algorithm to escape from local optimization and improves the convergence speed of the algorithm. This amalgamation of KKT is the so-called KKT-AOA. The steps of this algorithm are detailed further,
Initialization stage: To begin with, the initial candidate solutions (correlated features) are initialized and are defined in (16).
$y_{\text {corr }}=\left[\begin{array}{ccccc}y_{1,1} & \cdot & \cdot & y_{1, l-1} & y_{1, l} \\ y_{2,1} & \cdot & \cdot & \cdot & y_{2, l} \\ \cdot & \cdot & \cdot & \cdot & \cdot \\ y_{L-1} & \cdot & \cdot & \cdot & y_{L-1, l} \\ y_{L, 1} & \cdot & \cdot & \cdot & y_{L, l}\end{array}\right]$ (16)
In Eq. (16), yL,l means the l- number of correlated features for Lth feature.
Fitness evaluation: After initialization, the fitness (Prediction rate) of each arithmetic operator is determined to identify the optimal solution. The fitness evaluation(f(ycorr)) is given below.
$y_{p p m c}=\frac{\sum\left(y_j y_{u c i}\right)}{\varepsilon \delta\left(y_j\right) \delta\left(y_{u c i}\right)}$ (17)
where, Pr details the prediction rate. The resultant operator (multiplication or division) with the better fitness value enters the exploration stage, whereas the other operators (addition or subtraction) enter the exploitation stage.
Exploration stage: In this stage, both the exploration operators use the KKT function to obtain the optimal solution depending on the division and multiplication search strategy. The KKT function (ykkt) is detailed further down.
$y_{k k t}=\varsigma_0 \Delta y_{\text {corr }}=0$ (18)
In Eq. (18), $\varsigma_0$ corresponds to the Fritz John constant, $\nabla$ is the utility function. Based on the movement, the position of the arithmetic operators is also updated.
The position updation $\left(Y_{\text {corr }}^{\text {iterc }+1}\right)$ is given below.
$\left(Y_{\text {corr }}^{\text {iterc }}\right)_{\text {mop }}=1-\frac{\text { iterc }^{\frac{1}{a}}}{\text { iterm } \frac{1}{a}}$ (19)
$\mathrm{Y}_{\mathrm{corr}}^{\text {iterc }}+1\left\{\begin{array}{c}\mathrm{f}\left(\mathrm{y}_{\mathrm{corr}}\right) \div(\mathrm{mop}+\varphi) * \mathrm{y}_{\mathrm{kkt}} * v, \mathrm{y}_{\mathrm{kkt}} \leq 0 \\ \mathrm{f}\left(\mathrm{y}_{\text {corr }}\right) *(\mathrm{mop}+\varphi) * \mathrm{y}_{\mathrm{kkt}} * v, \quad \text { otherwise }\end{array}\right.$ (20)
Here, iterc, iterm indicates the current and the maximum iteration, a denotes the sensitive co-efficient, mop discuss the Math Optimizer Accelerated, and is defined in Eq. (21).
mop $=$ MIN + iterc $*\left[\frac{M A X-M I N}{\text { iterm }}\right]$ (21)
where, MIN and MAX relates the minimum and maximum values of mop.
Exploitation stage: Upon successful identification of the optimal solution, the arithmetic operators enter the exploitation stage. Here, both the addition and subtraction operators are involved to reach the identified optimal solution
via the addition and subtraction search strategy. Thus, the updated position using the addition and subtraction search strategy is,
$Y_{\text {corr }}^{\text {iterc }+1}\left\{\begin{array}{c}f\left(y_{\text {corr }}\right)-(\operatorname{mop}+\varphi) * y_{k k t} * v, y_{k k t} \leq 0 \\ f\left(y_{\text {corr }}\right)+(\operatorname{mop}+\varphi) * y_{k k t} * v, \text { otherwise }\end{array}\right.$ (22)
Thus, the above process continues until an optimal solution is obtained and the resultant optimal correlated features (Yopt) are,
$Y_{o p t}=\sum_{k=1}^g Y_k$ (23)
In Eq. (23), Yk refers to the k- number of optimal correlated features. The pseudocode of the proposed KKT-AOA is elucidated below.
Algorithm 1. KKT AOA optimal Algorithm to evaluate the accuracy using resultant optimal correlated features.
1: Input: Correlated features ycorr
2: Output: Optimal features
3: Begin
4: Initialize Population size $L$, population, $\varsigma_0, P_r$ maximum iteration (iterm)
Set iterc=1
While (iterc≤iterm) do
5: Evaluate fitness.
6: Perform exploration with KKT function (ykkt)
7: Update position $\left(Y_{\text {corr }}^{\text {iterc }}\right.$ mop ) using $1-\frac{\text { iterc }^{\frac{1}{a}}}{\text { iterm }^{\frac{1}{a}}}$
Obtain best solution Yopt
If (f(Yopt)>f(Yopt+1)){
Select Yopt
} Else {
iterc=iterc+1
}
End If
End while
Return optimal features
End
3.3.7 Disease prediction by BS-RNN
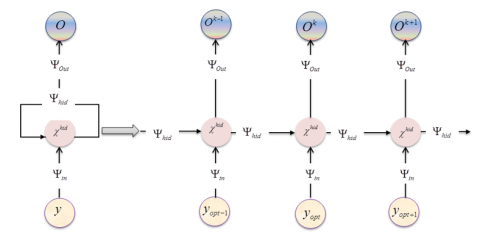
After feature selection, the presence or absence of the heart disease is classified using a Bipolar Sigmoid-Recurrent Neural Network (BS-RNN). RNN is the most widely accepted neural network that makes use of both the sequential data and the previous output to predict the next output. These networks have a memory that records the information they have seen up to the present. Yet, the dependence of the generalization performance and training stability of a neural network model on the activation function undergoes gradient diffusion problems due to the saturation problem of an activation function. So, to overcome this drawback of traditional RNN [7], a novel Bipolar Sigmoid (BS) activation function is incorporated into the RNN. This fusion of a new activation function in the general RNN is termed as BS-RNN and the baseline structure of the proposed BS-RNN is shown in Figure 2.
Figure 2. Baseline structure of the proposed BS-RNN
The process of BS-RNN is detailed as follows:
Step 1: The selected optimal correlated features (Yopt) are given to the input layer of the BS-RNN. The input neurons forward the input to the hidden layer where it is mapped with the previous output. The hidden layer output ($\chi^{\text {hid }}$) is given below.
$\lambda^{\text {hid }}=\vartheta\left(x^{i n} * \omega^{i n-h i d}+\psi^{i n-h i d}\right)$ (24)
$x^{i n}=\left(Y_{o p t} * \vartheta\right)+\psi$ (25)
In Eq. (24), $\vartheta$ is the BS activation function, $\omega^{\text {in-kid }}$ shows the weight values between the input-hidden layer, $\Psi^{\text {in-hid }}$ symbolizes the input-hidden bias value, $\chi^{\text {in }}$ refers to the output obtained at the input layer and is modelled in Eq. (25). Then, the BS activation function of the $p$-th hidden layer $\left\{\vartheta^p\right\}$ is given by,
$\vartheta^p\left(Y_{o p t}\right)=\left[\frac{2}{1+e^{-p}}\right\rceil-1$ (26)
where, p=1,2,…,f illustrates the number of hidden layers in the neural network.
Step 2: The operation of the output layer (Ok) of the BS-RNN is expressed as,
$O^k=\vartheta\left(\omega^{\text {hid-out }} * x^{\text {hid }}+\psi^{\text {hid-out }}\right)$ (27)
In Eq. (27), $\omega^{\text {hid-out }}$ is the weight connection between the hidden and output layer, $\Psi^{\text {hid-out }}$ means the bias value of the neural network. Thus, the classifier produces the presence or absence of heart disease in the patient based on the inputted features and the pseudocode of the proposed BS-RNN is shown below.
Algorithm 1. BS-RNN AOA optimal Algorithm to evaluate the accuracy for heart disease prediction.
Input: Extracted features (Yopt)
Output: Disease prediction
Begin
Initialize inputs $\left(Y_{o p t}\right)$, weights penalty $(w)$, bias $(\Psi)$, error threshold $(t d)$
If $\left(e^v<t d\right)\{$
Obtain the output (Ok)
} Else {
Update weight values
Perform $\chi^{\text {hid }}=\vartheta\left(Y_{o p t} * \omega^{\text {in-hid }}+\Psi^{\text {in-hid }}\right)$
Activate neurons with $\vartheta^p\left(Y_{o p t}\right)=\left(\frac{2}{1+e^{-p}}\right)-1$
Evaluate the output (Ok)
}
End If
Return class $\bar{O}^{\text {out }}$
End
3.3.8 Severity prediction
Here, the severity of the heart disease in the patient is measured based on the extracted PRA. Here, the prediction rate corresponds to the low, medium, and high-risk rates obtained from the abnormal functioning of the heart. In this work, the prediction rate is determined based on the PRA level in such a way that the range below 1.1% is considered low risk, 1.1%-21.1% is the medium, and the level greater than 21.1% corresponds to the high-risk level, which in turn shows the efficacy of the proposed heart disease risk prediction framework. Thus, the severity prediction is,
$S_{\text {pred }}=\left\{\begin{array}{l}1.1<P R A, \text { low } \\ 1.1<P R A<21.1, \text { medium } \\ 21.1<P R A . \text { risk }\end{array}\right.$ (28)
Thus, the proposed framework aids in the effective detection and prediction of the severity level of the heart disease in the patients.
In this segment, the performance of the proposed BS-RNN-based Heart Disease Prediction (BS-RNN-HDP) is evaluated in terms of performance metrics and is implemented in the working platform of PYTHON.
4.1 Database description
University of California Irvine (UCI) heart disease data is utilized in the proposed BS-RNN-HDP framework. It is a multivariate dataset made up of various mathematical and medical features obtained from the patient for the easy diagnosis of heart disease. The columns of this dataset provide details regarding the age, sex, place of origin, blood sugar level during fasting (fbs), Bp at rest, ElectroCardioGram (ECG) results at rest, and certain other factors are also contained in it.
4.2 Performance measurement of the proposed BS-RNN
Here, the performance of the proposed BS-RNN is evaluated and compared with the conventional RNN, CNN, Deep Neural Network (DNN), and Artificial Neural Network (ANN).
Figure 3. Performance measure of the proposed BS-RNN
Figure 3 unveils the performance of the proposed BS-RNN in terms of precision and recall. It is apparent that the precision and recall achieved by the proposed BS-RNN are better (97.82%, and 96.88%) when compared with the state-of-the-art DNN (84.72% precision, and 85.78% recall). Likewise, the precision and recall measure of various algorithms is also lower than the proposed BS-RNN. From the overall comparison, it is evident that the usage of the BS activation function in the proposed approach improved the generalization performance by avoiding the gradient diffusion problem and thus the proposed method withstands higher.
The superiority of the proposed BS-RNN is displayed in Figure 4. Here, the proposed method obtains 96.01 % of F-measure, and 96.93% of sensitivity, whereas the overall precision rate attained by the existing approaches ranges between 83.9%-91.37% and 82.57%-90.28% sensitivity rate. Thus, the proposed approach accomplishes better results in the heart disease prediction framework.
Figure 4. Performance analysis of the proposed BS-RNN
The prediction rate achieved by the proposed BS-RNN-HDP framework is displayed in Table 1. Here, the prediction rate achieved by the proposed methodology in predicting low-risk medium-risk, and high-risk levels of heart disease in the patient is 23.24%, 27.46%, and 51% respectively. Thus, the usage of the risk prediction analysis stage in the proposed disease prediction methodology and the feature correlation determination improved the efficacy of the disease prediction process.
Table 1. Comparative evaluation of the proposed BS-RNN
|
Risk Level |
Prediction Rate (%) |
|
Low |
23.24 |
|
Medium |
27.46 |
|
High |
51.0 |
(a)
(b)
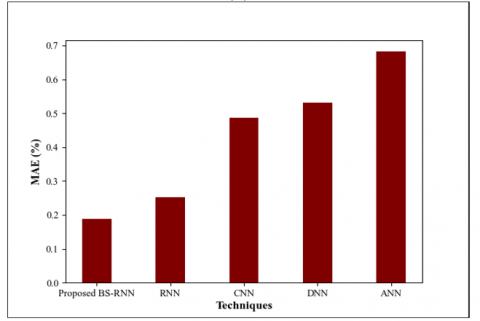
Figure 5. Performance evaluation of the proposed BS-RNN in terms of (a)RMSE (b) MAE
Figure 5 depicts the performance evaluation of the proposed methodology in terms of Root Mean Square Error (RMSE) and Mean Average Error (MAE). It is evident that the RMSE value achieved by the proposed BS-RNN is lower (0.24%) when compared with the existing RNN (0.42%), CNN (0.51%), DNN (0.87%), and ANN (1.25%). Also, the MAE value attained by the proposed methodology is 0.189%(low) while the existing CNN obtains 0.487%, which is higher than the proposed methodology. Likewise, the MAE value varies(lowers) for certain other methods also. Hence, it is revealed that the proposed work is more reliable than the existing approaches.
Table 2 comprises the training time of the proposed BS-RNN. It is clear that the proposed method takes only 3754ms for training the UCI dataset features. Conversely, the training time required by the existing RNN, CNN, DNN, and ANN is higher at the rate of 5820ms, 8419ms, 11658ms, and 15023ms, respectively. Thus, the proposed BS-RNN achieves high-performance metrics and handles uncertain circumstances in a more precise way.
Figure 6 unveils the Receiver Operating Characteristics (ROC) and Area Under the Curve (AUC) curves of the proposed BS-RNN. Better the ROC, the closer the curve to the top left corner. Here, the proposed method offers better performance by achieving better ROC and is visualized in Figure 6(a). Moreover, the AUC achieved by the proposed approach is also better (0.98%) and is elucidated in Figure 6(b). Conversely, the AUC of the other techniques is lower than the proposed method. Hence, it is revealed that the proposed work is more reliable and outperforms the existing approaches.
Table 2. Comparative measure of the proposed methodology
|
Techniques |
Training Time (ms) |
|
Proposed BS-RNN |
3754 |
|
RNN |
5820 |
|
CNN |
8419 |
|
DNN |
11658 |
|
ANN |
15023 |
(a)
(b)
Figure 6. (a) ROC and (b) AUC curve of the proposed BS-RNN
Table 3 unveils the prediction time of the proposed BS-RNN. It is apparent that the prediction time taken by the proposed methodology is 952ms, whereas the time taken by the existing RNN, CNN, DNN, and ANN is higher at the order of 1230ms, 1658ms, 1985ms, and 2474ms respectively. Thus, effective pre-processing and bipolar sigmoid utilization resulted in the prediction of heart disease in the patient in a very low time.
Table 3. Comparative measure of the proposed methodology
|
Techniques |
Prediction Time (ms) |
|
Proposed BS-RNN |
952 |
|
RNN |
1230 |
|
CNN |
1658 |
|
DNN |
1985 |
|
ANN |
2474 |
4.3 Performance evaluation of proposed KKT-AOA
The performance of the proposed KKT-AOA is analysed and compared with the conventional AOA, Particle Swarm Optimization (PSO), Grey Wolf Optimization (GWO), and Genetic Algorithm (GA).
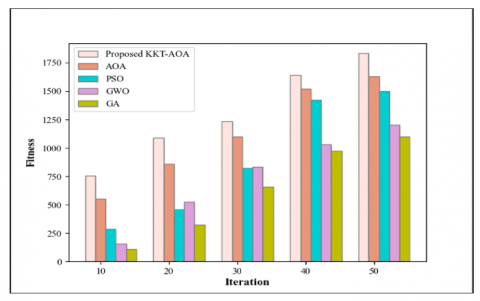
Figure 7. Performance evaluation of the proposed KKT-AOA
Figure 7 shows the fitness measurement of the proposed KKT-AOA. It is clear-cut that the proposed LF-CSO provides 758 optimal solutions in only 10 iterations, but the existing AOA, PSO, GWO, and GA deliver only 558, 289, 157, and 108 optimal solutions in the same 10 iterations. As the number of iterations increases, the optimal solution obtained by the proposed technique also increases. On the other side, the optimal solutions obtained by the existing methodologies are lower than the proposed ones. Thus, the utilization of the KKT in the proposed method achieves the best fitness values and delivers the optimal solution as quickly as possible by overcoming the premature convergence problem.
Table 4. Comparative measure of the proposed methodology
|
Techniques |
Feature Selection Time(ms) |
|
Proposed KKT-AOA |
3235 |
|
AOA |
4988 |
|
PSO |
6378 |
|
GWO |
8932 |
|
GA |
12365 |
The feature selection time taken by the proposed KKT-AOA is tabulated in Table 4. The feature selection time taken by the proposed KKT-AOA is 3235ms, whereas the feature selection time taken by the existing AOA, PSO, GWO, and GA ranges between 4988ms to 12365ms. Hence, it is transparent that the proposed KKT-AOA is superior in performance when compared with the traditional techniques.
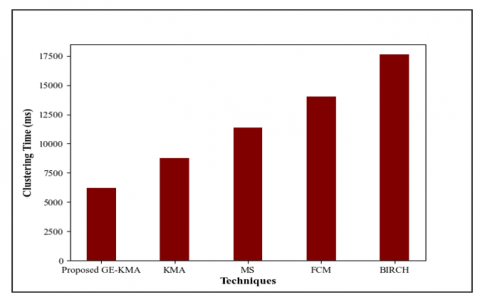
4.4 Performance determination of proposed GE-KMA
In this section, the performance of the proposed GE-KMA is measured and compared with the existing KMA, Mean Shift (MS), Fuzzy C Means (FCM), and Balanced Iterative Reducing and Clustering Hierarchies (BIRCH).
Figure 8 depicts the clustering time achieved by the proposed GE-KMA. It is apparent that the proposed GE-KMA takes only 6208ms to form the efficient clusters, but the existing KMA, MS, FCM, and BIRCH require 8784ms, 11382ms, 14018 ms, and 17622ms to form an efficient cluster, which is higher when compared to the proposed GE-KMA. Hence, among the existing clustering techniques, the proposed LL-KMA finishes the clustering process within a short period of time by eliminating the local optimum problem via GE.
Figure 8. Superiority measure of the proposed GE-KMA
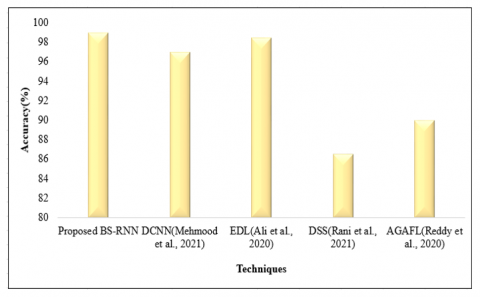
4.5 Comparative measure with literature papers
Here, the performance of the proposed methodology is determined and compared with DCNN [12], EDL [7], DSS [15], and AGAFL [16].
Figure 9. Comparative analysis of the proposed BS-RNN
Figure 9 compares the accuracy of the proposed work. From the comparison analysis, it is clear that the proposed method predicts heart disease with a high accuracy rate of 98.95%, whereas the accuracy of the existing DCNN [12] EDL [3], DSS [15], and AGAFL [16] is 97%, 98.5%, 86.6%, and 90% respectively. This is literally low as compared to the proposed work. Hence, usage of the risk factor analysis and BS utilization in the proposed BS-RNN showed a noteworthy performance in the disease prediction process.
A BS-RNN framework is proposed in this work using GE-KMA and KKT-AOA techniques by analysing various risk factors in the cloud layer. Numerous operations like Pre-processing, risk factor analysis, clustering, and disease prediction are involved in the proposed framework. Finally, the severity measurement is done based on the extracted novel feature. After that, performance and comparative analysis are carried out to validate the efficacy of the proposed methodology. Here, the publically available UCI heart disease dataset is utilized for the analysis, and the proposed method achieves 98.95% of accuracy, 96.01% of F-measure, and 96.93% of specificity. Furthermore, the proposed clustering algorithm forms an efficient cluster with limited time, such as 6208 ms with a better prediction rate. Overall, the proposed disease prediction framework outperforms the existing methods. However, the severity prediction only based on the extracted novel feature in the proposed framework is not effective and hence in the future, the research will be expanded by using advanced multimodal neural networks to develop a disease severity prediction system, which will also take into account certain additional criteria.
[1] Abdel-Basset, M., Gamal, A., Manogaran, G., Son, L.H., Long, H.V. (2020). A novel group decision making model based on neutrosophic sets for heart disease diagnosis. Multimedia Tools and Applications, 79: 9977-10002. https://doi.org/10.1007/s11042-019-07742-7
[2] Ahmed, H., Younis, E.M.G., Hendawi, A., Ali, A.A. (2020). Heart disease identification from patients’ social posts, machine learning solution on Spark. Future Generation Computer Systems, 111: 714-722. https://doi.org/10.1016/j.future.2019.09.056
[3] Ali, F., El-Sappagh, S., Islam, S.M.R., Kwak, D., Ali, A., Imran, M., Kwak, K.S. (2020). A smart healthcare monitoring system for heart disease prediction based on ensemble deep learning and feature fusion. Information Fusion, 63: 208-222. https://doi.org/10.1016/j.inffus.2020.06.008
[4] Batko, K., Ślęzak, A. (2022). The use of Big Data Analytics in healthcare. Journal of Big Data. https://doi.org/10.1186/s40537-021-00553-4
[5] Budholiya, K., Shrivastava, S.K., Sharma, V. (2022). An optimized XGBoost based diagnostic system for effective prediction of heart disease. Journal of King Saud University - Computer and Information Sciences, 34(7): 4514-4523. https://doi.org/10.1016/j.jksuci.2020.10.013
[6] Dutta, A., Batabyal, T., Basu, M., Acton, S.T. (2020). An efficient convolutional neural network for coronary heart disease prediction. Expert Systems with Applications, 159: 113408. https://doi.org/10.1016/j.eswa.2020.113408
[7] Fitriyani, N. L., Syafrudin, M., Alfian, G., Rhee, J. (2020). HDPM: An effective heart disease prediction model for a clinical decision support system. IEEE Access, 8: 133034-133050. https://doi.org/10.1109/ACCESS.2020.3010511
[8] Gárate-Escamila, A. K., Hajjam El Hassani, A., Andrès, E. (2020). Classification models for heart disease prediction using feature selection and PCA. Informatics in Medicine Unlocked. https://doi.org/10.1016/j.imu.2020.100330
[9] Indrakumari, R., Poongodi, T., Jena, S.R. (2020). Heart disease prediction using exploratory data analysis. Procedia Computer Science, 173: 130-139. https://doi.org/10.1016/j.procs.2020.06.017
[10] Kavitha, M., Gnaneswar, G., Dinesh, R., Sai, Y.R., Suraj, R.S. (2021). Heart disease prediction using hybrid machine learning model. Proceedings of the 6th International Conference on Inventive Computation Technologies, 2021: 1329-1333. https://doi.org/10.1109/ICICT50816.2021.9358597
[11] Magesh, G., Swarnalatha, P. (2021). Optimal feature selection through a cluster-based DT learning (CDTL) in heart disease prediction. Evolutionary Intelligence, 14(2): 583-593. https://doi.org/10.1007/s12065-019-00336-0
[12] Mehmood, A., Iqbal, M., Mehmood, Z., Irtaza, A., Nawaz, M., Nazir, T., Masood, M. (2021). Prediction of heart disease using deep convolutional neural networks. Arabian Journal for Science and Engineering, 46(4): 3409-3422. https://doi.org/10.1007/s13369-020-05105-1
[13] Nilashi, M., Ahmadi, H., Manaf, A. A., Rashid, T. A., Samad, S., Shahmoradi, L., Aljojo, N., Akbari, E. (2020). Coronary heart disease diagnosis through self-organizing map and fuzzy support vector machine with incremental updates. International Journal of Fuzzy Systems, 22(4): 1376-1388. https://doi.org/10.1007/s40815-020-00828-7
[14] Princy, R.J.P., Parthasarathy, S., Jose, P.S.H., Lakshminarayanan, A.R., Jeganathan, S. (2020). Prediction of cardiac disease using supervised machine learning algorithms. In 2020 4th International Conference on Intelligent Computing and Control Systems (ICICCS), Madurai, India, pp. 570-575. https://doi.org/10.1109/ICICCS48265.2020.9121169
[15] Rani, P., Kumar, R., Ahmed, N.M.O.S., Jain, A. (2021). A decision support system for heart disease prediction based upon machine learning. Journal of Reliable Intelligent Environments, 7(3): 263-275. https://doi.org/10.1007/s40860-021-00133-6
[16] Reddy, G.T., Reddy, M.P.K., Lakshmanna, K., Rajput, D.S., Kaluri, R., Srivastava, G. (2020). Hybrid genetic algorithm and a fuzzy logic classifier for heart disease diagnosis. Evolutionary Intelligence, 13(2): 185-196. https://doi.org/10.1007/s12065-019-00327-1
[17] Guruprasad, S., Mathias, V.L., Dcunha, W. (2020). Heart disease prediction using machine learning techniques. In 2020 2nd International Conference on Advances in Computing, Communication Control and Networking (ICACCCN), Greater Noida, India, pp. 177-181. https://doi.org/10.1109/ICEECCOT52851.2021.9707966
[18] Singh, A., Kumar, R. (2020). Heart disease prediction using machine learning algorithms. In 2020 International Conference on Electrical and Electronics Engineering (ICE3) Gorakhpur, India, pp. 452-457. https://doi.org/10.1109/AIC55036.2022.9848885
[19] Tougui, L., Jilbab, A., Mhamd, J. El. (2020). Heart disease classification using data mining tools and machine Learning Techniques. Health and Technology, 10: 1137-1144. https://doi.org/10.1088/1742-6596/1937/1/012047