Engin Obucic*![]() | Mersid Poturak
| Mersid Poturak![]() | Dino Keco
| Dino Keco![]()
© 2023 IIETA. This article is published by IIETA and is licensed under the CC BY 4.0 license (http://creativecommons.org/licenses/by/4.0/).
OPEN ACCESS
The objective of this study is to utilise machine learning for predicting user engagement with Facebook post images from universities, aiming to provide strategic guidance for their social media content. A comprehensive analysis was performed on a dataset comprising 1,200 images from 24 prominent universities in the United States, the United Kingdom, and Australia. The open-source machine learning software WEKA 3.8.5 was utilised, with three of its classifiers - J48, Sequential Minimal Optimisation (SMO), and Random Forest (RF) - chosen for their proven efficiency with high-dimensional data. These classifiers were trained using a unique mix of features from the Google Cloud Vision API and attributes derived from relevant literature. Cross-validation techniques were employed to assess the accuracy of the models. A robust performance was exhibited by all models: J48 yielded an accuracy of 90.92%, SMO 94.85%, and RF 97.08%. Even under 66/34 and 90/10 data splits, the high accuracy was sustained. These findings underscore the efficacy of machine learning models in predicting user engagement with Facebook post images for leading universities. Such techniques can be leveraged by universities to optimise their Facebook user engagement strategies, thereby informing the creation of content that aligns with their target audience preferences. This study illuminates promising directions for updating social media strategies in response to evolving communication trends.
machine learning, user engagement, Facebook posts, image analysis, universities, WEKA 3.8.5., social media strategy, social media communication trends
The employment of social media platforms in higher education institutions is becoming an increasingly common strategy because it allows institutions to connect, participate in student learning and foster a sense of community with their target audiences [1]. Due to their global reach and ubiquitous usage, social media platforms such as Facebook make it possible for institutions to increase user engagement and interactivity response [1].
While the significance of textual content in facilitating engagement on social media has been studied systematically, visual content, specifically images, received less attention. Studies show that images used in social media increase anticipated rates of user engagement (likes) [2]. Images can help to draw attention to messages and encourage communicative responses. Visually appealing representations can be very successful at motivating and even predicting user engagement [2]. “Images appear to be potent attractors that also motivate behavior in the form of communication responses. Among social media content competing for attention, use of imagery could be useful in both drawing focus to messages and encouraging these communication responses” [2].
In the context of universities, the user engagement of Facebook post images can play a significant role in connecting with the target audience. However, predicting the user engagement based on social media images remains a challenge. This can be ascribed to the difficulty of image analysis and image interpretation to an adequate level for the application of tools that have been used in science primarily for academic purposes.
This research represents a contribution to the field of social media user engagement analysis in higher education institutions. Its novelty resides in its specific focus on predicting user engagement of university Facebook post images, which is a field requiring further exploration. Uniquely combining preselected features from the Google Cloud Vision API with features derived from scholarly literature, the research forms comprehensive and robust predictive models.
The research demonstrates how Facebook post images can be effectively utilised to advance university marketing strategies. In particular, building on the user engagement prediction background and social media image analysis, this paper informs by applying machine learning techniques to the prediction of user engagement in university Facebook post images.
Specifically, the prediction of user engagement on university Facebook post images is based on the combination of the dataset collected from the 24 leading universities in the US, the UK and Australia, the application of the Google Cloud Vision API predefined image features and features manually derived from graphic design and photography literature [3]. The study presents a novel method for predicting user engagement of university Facebook post images using machine learning techniques conducted in WEKA 3.8.5. [4].
Furthermore, this study utilises a methodologically rigorous approach, employing three distinct WEKA 3.8.5. classifiers - J48, Sequential Minimal Optimisation, and Random Forest - to ensure the reliability and validity of the predictive results.
Utilising scientific methodology in database generation and image analysis, machine learning techniques provide a viable solution in addressing this challenge. In analysing datasets consisting of social media images, machine learning techniques rely on handcrafted feature approaches for predictive model development and algorithm classification across disciplines. In order to demonstrate the importance of applying machine learning techniques to social media images, this paper focuses on predicting the user engagement of leading university Facebook post images using solely scientific tools and methods.
In addition, the study makes a contribution by including social media images from leading universities in the United States, the United Kingdom, and Australia, adding a cross-continental dimension that permits wider testing and conclusions that can be generalisable within the framework of the study.
Finally, it is safe to say that this research goes beyond simple predictive analytics by translating complex machine learning outcomes into actionable university marketing intelligence. The study thereby provides universities with a tool that allows for tailored strategic approaches that enhance their social media content and user engagement strategies, effectively responding to dynamic social media communication requirements and university stakeholder expectations.
Machine learning has found diverse applications beyond IT, including marketing [5], medical image analysis [6], radiology [7], digital pathology [8], cell image analysis [9], breast cancer diagnosis [10], cervical cancer screening [11], agricultural landscape analysis [12], and many more, indicating its increasing significance across a wide range of fields [13].
Peruta and Shields [14] conducted a study to help higher education institutions comprehend the present social media ecosystem. The authors examined 66 major US colleges’ and universities' Facebook images and how their constituents responded. The results demonstrate considerable disparities in participation across institutional types. Engagement is influenced by the media type and posting frequency. This study showed how university social media administrators could better manage their content to maximise engagement and reach [14].
Kaiser et al. [15] introduced a sample of 44,765 Facebook images captured by 503 Facebook users from the United States and Germany. The sample was used to determine the extent to which images played a vital role in social media communication. Using machine learning techniques, this study found that uploading brand images (i.e., photos that contain the brand name or logo) is associated with brand love, brand loyalty, and word-of-mouth (WOM) endorsement of a particular brand in question.
Salinas and Mendez [16] used machine learning to automate the prediction of Facebook posts featuring the Montemorelos University's Facebook page as a case study. The authors developed a web application that allows users to upload datasets on their Facebook page and predict the impact of new posts. Four classification models were trained using four different machine-learning algorithms with the Decision Tree algorithm, achieving an 86% accuracy rate. The selected model accurately predicted the impact of new posts, demonstrating the effectiveness of machine learning in automating social media marketing for businesses.
Celli et al. [17] analysed personality recognition and interaction styles using profile pictures on Facebook. The authors collected a dataset of profile pictures and labelled them with self-assessed personality and interaction style. They used a bag-of-visual-words technique to extract features from pictures and tested different machine learning approaches to predict features. Their results show that profile pictures contain significant information about a user and are linked to impression creation and identity management.
Schmokel and Bossetta [18] introduced a methodological workflow that utilises two open science tools that they developed: FBAdLibrian, which collects images from the Facebook Ad Library, and Pykognition, which simplifies facial and emotion detection in images using computer vision. Using this workflow, they analysed the 2020 US primary elections and found that only a small fraction of overall ads (<.1%) contained unique images of campaigning candidates. They also discovered that candidates tend to display happiness and calm facial expressions and rarely attack opponents in their image-based ads. However, when opponents are attacked, they are portrayed with emotions such as anger, sadness, and fear.
Scholars would further benefit from the studies undertaken by Sheng et al. [19], Zhou et al. [20], Chang et al. [21], Kaufman et al. [22], and Murray et al. [23] for machine learning research aimed at collecting, preprocessing, and innovatively analysing large datasets comprising online images.
The purpose of this study is to look into the relationship between image features and user engagement, as assessed by the number of likes on university Facebook post images. Machine learning approaches were used to help with user engagement prediction. In contrast to previous studies that applied machine learning to technical fields such as radiology, digital pathology, and medical image analysis, this work represents a departure from previous studies that applied machine learning to technical fields.
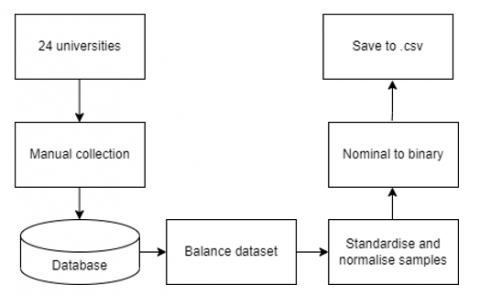
A dataset containing 1,008 images was manually compiled from 24 leading universities in the United States, the United Kingdom, and Australia. These institutions were selected because of their prestige and esteem. Data collection occurred between June and July of 2022.
Figure 1 depicts the data acquisition and transformation workflow graphically.
Figure 1. Data collection and transformation workflow
Table 1 lists 24 university Facebook pages and 1,008 images referenced during the data collection process.
Table 1. University Facebook pages referenced in the study
|
US |
UK |
Australia |
|||
|
Princeton |
42 |
Oxford |
42 |
Australian National University |
42 |
|
Columbia |
42 |
Cambridge |
42 |
Sydney |
42 |
|
Harvard |
42 |
St Andrews |
42 |
Melbourne |
42 |
|
Yale |
42 |
London School of Economics |
42 |
New South Wales |
42 |
|
Pennsylvania |
42 |
Durham |
42 |
Queensland |
42 |
|
Dartmouth College |
42 |
Warwick |
42 |
Monash |
42 |
|
Brown |
42 |
Imperial College |
42 |
Western Australia |
42 |
|
Cornell |
42 |
Bath |
42 |
Adelaide |
42 |
|
Total number of Facebook pages: 24 |
|||||
|
Total number of Facebook images: 1,008 |
|||||
Individual Facebook image features were selected with reference to the Google Cloud Vision API, photography literature, graphic design literature, and research articles predicated on machine learning research.
In this research, the Google Cloud Vision API was utilised as a key tool for image analysis. This is because the API can recognise thousands of objects within images, as well as read printed and handwritten text [3]. The Google Cloud's Vision API is a tool that allows developers to easily integrate image and video analyses into their applications. It uses machine learning to classify and identify objects, people, text, and other elements visible in images and videos [3]. In the context of this research, the Google Vision API was used to extract particular features from the dataset's images and categorise images. For example, it was used to identify objects and locations in images, such as outdoor spaces and backgrounds. It thereby provided contextual information within which the image content is situated. The facial detection feature was also used to analyse the emotional state of the individuals depicted in the images thus providing insight into the conveyed emotional tone. Significantly, the features extracted from the Google API were subsequently included in the set of features used to train WEKA machine learning classifiers.
The inclusion of academic literature on graphic design and photography in the analysis suggests an interest in understanding how the technical aspects of images might be related to the user engagement [24]. For example, composition, lighting, colour, or other visual elements of images might affect viewers’ appeal [25, 26]. By examining these elements through the lens of graphic design and photography literature [27, 28], it is possible to gain a deeper understanding of the image features that contribute to image engagement [29].
The Gourmet Photography Dataset (GPD) served as a comparison benchmark in this research [19]. The GPD dataset, which was employed in the image analysis research, contains a wide range of online images with detailed metadata. As such, the GPD functioned as a reference model for structuring and annotating a collection of university Facebook post images. The technique of annotation in the current study was meant to duplicate the structure and granularity of the GPD, thus offering a systematic and tested framework for data preparation.
To analyse the dataset and identify the characteristics that contribute to the engagement of university Facebook post images, a large number of features from a variety of sources was typically collected. By evaluating these characteristics and their interrelationships, it may be possible to uncover patterns and trends in the data that are not obvious using alternative methods. The importance of features is crucial as “user engagement” that “appears to depend on specific patterns of features suggests that optimal message transmission may be achieved through the careful design of social (...) communications using specific features to promote specific types of engagement.” [2].
Table 2 presents a list of 49 features included in the image analysis.
Table 2. 49 features used in the study
|
Features |
||||
|
Country |
Anger1 |
Roll1 |
Sorrow2 |
Headwear2 |
|
University |
Surprise1 |
Tilt1 |
Anger2 |
Roll2 |
|
Image no. |
Exposed1 |
Pan1 |
Surprise2 |
Tilt2 |
|
Joy1 |
Blurred1 |
CONFIDENCE1 |
Exposed2 |
Pan2 |
|
Sorrow1 |
Headwear1 |
Joy2 |
Blurred2 |
CONFIDENCE2 |
|
Dominant Object |
Logo (any) |
Dominant Colour |
R |
G |
|
B |
Light |
Composition |
Special moment |
Touch |
|
Colour |
Black and white |
Portrait |
Landscape |
Indoor |
|
Outdoor |
Clear |
Blurred3 |
Looks great |
Good |
|
Bad |
Skip |
Number of page followers |
Likes, as a percentage of Page Followers |
OUTPUT CLASS modelled around the percentage of likes (High, Medium, Low) |
The employment of social media platforms in higher education institutions is becoming an increasingly common strategy because it allows institutions to connect, participate in student learning and foster a sense of community with their target audiences [1]. Due to their global reach and ubiquitous usage, social media platforms such as Facebook make it possible for institutions to increase user engagement and interactivity response [1].
Data collection activity targeted university images published on Facebook. 1,008 images were annotated by assigning numeric values to each image. Each image was analysed using 49 predetermined features. WEKA was then employed to initially analyse or preprocess 1,008 images. Initial analysis of the dataset suggested that the dataset contained outliers that should be removed to prevent "overfitting.” After removing the outliers, the dataset was reduced to 936 instances. The 936 instances were then divided into an Output Class with the output values of HIGH, MEDIUM, and LOW. The value of the Output Class was based on the percentage of likes, calculated as a proportion of the total number of university page followers.
Data transformation is focused on preparing data for analysis, interpretation and decision making. The Google Vision API was used to extract image features that were subsequently transformed into binary and numeric instances effectively interpreted by WEKA classifiers. In some cases, the dataset contained missing values, which reduced the effectiveness of machine learning models. WEKA includes many filters for dealing with missing data. “ReplaceMissingValues” filter is a widely used filter which substitutes missing values in nominal and numeric features with the relevant modes and means from the training data.
Under the 'Filters' tab of the 'Preprocess' interface, WEKA additionally provides a number of data transformation filters. For example, the “NumericToBinary” filter transforms numeric features to binary by applying a threshold, whereas the “Normalise” filter adapts all numeric features to the specified range (such as 0 to 1).
Furthermore, balancing a training dataset with techniques of oversampling the minority class by duplication and undersampling the majority class is required in the case of imbalanced datasets [30, 31].
The formula to reduce the number of low-class samples from 800 to 400 while increasing the number of medium-class samples from 97 to 400 and the number of high-class samples from 57 to 400 can be expressed as follows:
NewLowClass = OldLowClass * 0.5
NewMediumClass = OldMediumClass * (400/97)
NewHighClass = OldHighClass * (400/57)
where OldLowClass, OldMediumClass, and OldHighClass are the original number of samples in each class.
This operation suggests that the number of low-class samples decreased by 50%, while the number of medium- and high-class samples increased by 400/97 and 400/57, respectively. This ratio ensures that the final dataset has an even distribution of 400 samples per class.
Note that the formula reflects a generalisation and may not apply to all cases and scenarios. The fundamental idea is to alter the size of classes to achieve a balanced dataset. As a result, different proportions may be utilised based on specific dataset requirements.
In addition, the dataset values were transformed into binary and numerical values. The values were standardised and normalised, as required. Optimal data fitting was achieved by selecting 1,200 instances, thus striking a balance between "overfitting" and "underfitting" [30].
The predictive models developed in this research represent a resource for university marketing professionals and their social media teams. The models support the development of data-driven strategies that improve the success of social media post image campaigns. These models, in particular, can help institutions create social media images that communicate with their target audience by enhancing user engagement. The models, for example, can reveal which images, such as campus background or student emotions, are more likely to stimulate interest from the target group. This approach enables universities to tailor their social media campaigns to changing trends and annual events like enrolling periods.
As part of the model development, user engagement in this study is defined as the number of Facebook post image likes measured as the percentage of the total number of university page followers.
The formula used is: Number of likes per post image / number of university Facebook page followers x 100
If a social media image received more likes, proportional to the total number of page followers, it received a higher user engagement score.
The predictive performance of the model measured against the Output Class composed of LOW, MEDIUM and HIGH classes represents the locus of the study as it predicts Facebook likes on a test dataset.
WEKA algorithms were used to build the models. The analysis was conducted using three classifier algorithms, which permitted a precise understanding of the performance of the models used in this study. Figure 2 outlines the overall classification process.
Table 3 presents the summary of the results for three classifiers used in the study.
Figure 2. Block diagram of the overall classification process
Table 3. Results summary for three classifiers: J48, SMO and RF
|
Correctly Classified Instances |
||||||
|
Classifier |
Data split 66% |
Error |
Data split 90% |
Error |
Cross-validation 10-fold |
Error |
|
J48 |
88.48 |
11.52 |
94.17 |
5.83 |
90.92 |
9.08 |
|
SMO |
94.85 |
5.15 |
96.67 |
3.33 |
94.85 |
5.15 |
|
RF |
97.06 |
2.94 |
96.67 |
3.33 |
97.08 |
2.92 |
The transformed dataset contains a mix of numerical and binary features from social media post images. The goal is to predict a class for each instance (low, medium, high). As a general rule, the higher the classification accuracy, the more accurately the classifier identifies the classes of new instances. The decision to include multiple classifiers was made because the single-classifier approach does not yield the desired results [32]. The three commonly used machine learning algorithms - J48, Sequential Minimal Optimization (SMO) and Random Forest (RF) - were chosen for their ability to classify a range of problems including datasets that contain numeric and binary features. Namely, J48 develops a decision tree and uses information theory to solve classification problems [33]. SMO and RF can be used to address both regression and classification challenges handling numerical and binary features with a high degree of accuracy. Significantly, RF enjoys the reputation of being “one of the most precise decision-making models” used in such tasks [33].
The J48 classifier performed well on two data splits. The first split, which used 66% of the data for training and 34% for testing, yielded 88.48% correct classifications. The classifier properly identified 94.17% of the data in the second split, using 90% of the data for training and 10% for testing. The classifier properly identified 90.92% of the data while using a cross-validation approach with 10 folds.
The SMO classifier performed better on two unique data splits. The first split, which used 66% of the data for training and 34% for testing, yielded 94.85% correct classifications. The classifier properly classified 96.67% of the data in the second split, using 90% of the data for training and 10% for testing. The classifier properly identified 94.85% of the data while using a cross-validation approach with 10 folds.
Across all splits and cross-validation, the RF classifier had the maximum classification accuracy, scoring 97.06% and 97.08%, respectively. This indicates that it outperformed the other two classifiers for this specific dataset. Error rate is the inverse of classification accuracy and is calculated by subtracting classification accuracy from 100%. In all divisions and cross-validation, the RF classifier had the lowest error rate, with 2.94% and 2.92%, respectively.
A greater proportion of correctly classified instances is generally desired when evaluating models, as this indicates that the classifier makes more accurate predictions. In this case, the proportion of correctly classified instances is higher on the second data division than on the first, suggesting that the classifier may be more effective at making predictions when applied to this larger dataset. Notably, error rates were comparatively low for both data splits, indicating that the classifier performs well overall.
These predictive models, however, have observable limitations in real-world settings. First, the accuracy of the models is dependent on the quality of the input data. Potential inaccuracies in the data could reduce the predictive value of the models. Furthermore, the models may fail to take into consideration a wide range of external factors, such as ongoing events, social media trends, changing user preferences, or unique platform algorithms that influence user engagement. Due to the fact that this study focuses on leading universities in three countries, the conclusions may not apply univocally to institutions with different cultural backgrounds or demographic circumstances. Because of differences in user behaviour patterns and platform algorithms, these models may not be immediately applicable to other social media platforms such as Instagram and TikTok.
The study's findings have practical implications for marketing professionals especially those in higher education institutions entrusted with engaging audiences through social media platforms. Namely, marketing professionals may now be more strategic in their content production by determining which social media images are more likely to enhance user engagement. Focusing on generating content that has been methodologically proven to engage their target audiences will help institutional marketing professionals to successfully manage social media campaigns. This data-driven strategy refines analytical approaches matching marketing strategies with target audiences' needs.
Moreover, these findings may lead to a paradigm shift in how marketers approach social media management. Instead of depending on traditional qualitative evaluations of campaign effectiveness, marketers can now use machine learning models to formulate strategy. This method offers methodological precision as marketers will be able to respond to trends. As a result, this study may stimulate a greater adoption of predictive techniques in the university marketing field, such as machine learning, that pave the way for interactive, real-time strategies.
To maximise the technical value of the ongoing analysis, the next stage of the analysis requires the application of ensemble classifiers. As in Gegic et al. [32], Ensemble Classification introduces multiple algorithms that achieve a high predictive performance by voting on the optimal output value. To obtain the results, ensemble algorithms perform a comprehensive analysis of the dataset and generate the most exhaustive results. While the ensemble method provides a comprehensive analysis, the computational resources required may be significantly greater than those for a single algorithm [32].
In an effort to further expand the scope of this study, future research needs to incorporate similar dataset features generated by marketing research undertaken on a different range of marketing platforms. In this research, we examined Facebook using a relatively small sample of university Facebook posts. Marketing researchers would profit from expanding the size of the Facebook sample and repeating the study on Instagram and TikTok platforms to expand the scope of the research models developed in this study.
Finally, as the research has been conducted in a select number of English-speaking countries, it would be instructive to test the applicability of the results in “larger samples from more international and heterogeneous populations” [34]. International and heterogeneous samples would contribute to the models’ generalisability and their application in diverse international environments.
This study's findings have numerous implications for marketing professionals, particularly university marketing managers and university administrators.
First, the results demonstrate that it is possible to accurately predict the user engagement of university Facebook posts using machine learning techniques. This can encourage marketing professionals to utilise machine learning techniques in their work.
Second, the authors intend to develop a web browser extension that will provide university professionals with a convenient prediction tool while creating scientifically informed marketing campaigns. From a managerial standpoint, the web browser extension tool must be easy to use and, to a large extent, intuitive. An intuitive user interface is specifically envisioned, which lowers the complexity of machine learning algorithms translating it into practical insights. While the product is intended to be simple to use, a basic training package could help to ensure that marketing professionals and their teams can immediately integrate the tool into their everyday workflows without committing resources to further training.
Integration with existing systems will also have to be explored. Because the solution is built with compatibility in mind, seamless integration with commonly used content management systems and social media management platforms used by marketing professionals and their teams is a basic prerequisite. This integration is intended to optimise existing workflows, increase productivity and achieve results.
This study reveals that machine learning algorithms can predict user engagement of Facebook post images with a high degree of accuracy. Specifically, in cross-validation and divisions, the RF classifier outperformed the J48 and SMO classifiers, achieving classification accuracies of 97.06% and 97.08%, respectively. This study has significant implications for university marketing professionals and their teams because it provides reliable models for predicting user engagement for universities seeking to maximise social media impact and elicit increased audience engagement.
The authors also plan to develop a web browser extension tool to assist university marketing professionals in predicting the engagement of university Facebook post images and analyse the factors that affect engagement.
Nevertheless, challenges have been anticipated in the implementation of the tool. For example, the dynamic nature of social media algorithms and user engagement patterns that differ across countries is an anticipated challenge. Because of algorithm changes and international user behaviour patterns, predictive models must be regularly updated and fine tuned in a context-specific fashion. To address this, regular monitoring and development of the tool guarantees that it remains current and effective in deployment tasks. The tool will be revised based on user feedback to ensure that it meets the high standards of marketing professionals and their teams in the higher education institutions.
Furthermore, this study has limitations that suggest directions for future research. The use of multiple classifiers and ensemble classifiers is recommended to further improve the accuracy of machine learning results. Future research could explore similar dataset features on additional marketing platforms, such as Instagram and TikTok, including different dataset collection dates. Testing the applicability of these results in larger samples from more international and heterogeneous populations would contribute to generalisable results and broad applicability of the predictive results developed in this study.
[1] Joosten, T. (2012). Social media for educators: Strategies and best practices. John Wiley & Sons.
[2] Rus, H.M., Cameron, L.D. (2016). Health communication in social media: message features predicting user engagement on diabetes-related Facebook pages. Annals of Behavioral Medicine, 50(5): 678-689. https://doi.org/10.1007/s12160-016-9793-9
[3] https://cloud.google.com/vision.
[4] Azuaje, F. (2006). Witten IH, frank E: Data mining: Practical machine learning tools and techniques 2nd edition. BioMedical Engineering OnLine, 5(1): 51. https://doi.org/10.1186/1475-925X-5-51
[5] Ma, L., Sun, B. (2020). Machine learning and AI in marketing-Connecting computing power to human insights. International Journal of Research in Marketing, 37(3): 481-504. https://doi.org/10.1016/j.ijresmar.2020.04.005
[6] De Bruijne, M. (2016). Machine learning approaches in medical image analysis: From detection to diagnosis. Medical Image Analysis, 33: 94-97. https://doi.org/10.1016/j.media.2016.06.032
[7] Wang, S., Summers, R.M. (2012). Machine learning and radiology. Medical Image Analysis, 16(5): 933-951. https://doi.org/10.1016/j.media.2012.02.005
[8] Madabhushi, A., Lee, G. (2016). Image analysis and machine learning in digital pathology: Challenges and opportunities. Medical Image Analysis, 33: 170-175. https://doi.org/10.1016/j.media.2016.06.037
[9] Kan, A. (2017). Machine learning applications in cell image analysis. Immunology and Cell Biology, 95(6): 525-530. https://doi.org/10.1038/icb.2017.16
[10] Wolberg, W.H., Street, W.N., Mangasarian, O.L. (1995). Image analysis and machine learning applied to breast cancer diagnosis and prognosis. Analytical and Quantitative cytology and Histology, 17(2): 77-87.
[11] William, W., Ware, A., Basaza-Ejiri, A.H., Obungoloch, J. (2018). A review of image analysis and machine learning techniques for automated cervical cancer screening from pap-smear images. Computer Methods and Programs in Biomedicine, 164: 15-22. https://doi.org/10.1016/j.cmpb.2018.05.034
[12] Duro, D.C., Franklin, S.E., Dubé, M.G. (2012). A comparison of pixel-based and object-based image analysis with selected machine learning algorithms for the classification of agricultural landscapes using SPOT-5 HRG imagery. Remote Sensing of Environment, 118: 259-272. https://doi.org/10.1016/j.rse.2011.11.020
[13] Angra, S., Ahuja, S. (2017). Machine learning and its applications: A review. In 2017 International Conference on Big Data Analytics and Computational Intelligence (ICBDAC), Chirala, Andhra Pradesh, India, pp. 57-60. https://doi.org/10.1109/ICBDACI.2017.8070809
[14] Peruta, A., Shields, A.B. (2017). Social media in higher education: understanding how colleges and universities use Facebook. Journal of Marketing for Higher Education, 27(1): 131-143. https://doi.org/10.1080/08841241.2016.1212451
[15] Kaiser, C., Ahuvia, A., Rauschnabel, P.A., Wimble, M. (2020). Social media monitoring: What can marketers learn from Facebook brand photos? Journal of Business Research, 117: 707-717. https://www.sciencedirect.com/science/article/abs/pii/S0148296319305429.
[16] Salinas, G.H.A., Méndez, A.S.L. (2020). Prediction of the impact of Facebook posts with machine learning. Anuario2020, 1(1): 84-91.
[17] Celli, F., Bruni, E., Lepri, B. (2014). Automatic personality and interaction style recognition from facebook profile pictures. In Proceedings of the 22nd ACM International Conference on Multimedia, Orlando Florida USA, pp. 1101-1104. https://doi.org/10.1145/2647868.2654977
[18] Schmøkel, R., Bossetta, M. (2022). FBAdLibrarian and Pykognition: open science tools for the collection and emotion detection of images in Facebook political ads with computer vision. Journal of Information Technology & Politics, 19(1): 118-128. https://doi.org/10.1080/19331681.2021.1928579
[19] Sheng, K., Dong, W., Huang, H., Ma, C., Hu, B.G. (2018). Gourmet photography dataset for aesthetic assessment of food images. In SIGGRAPH Asia 2018 technical briefs, Tokyo, Japan, pp. 1–4. https://doi.org/10.1145/3283254.3283260
[20] Zhou, B., Lapedriza, A., Khosla, A., Oliva, A., Torralba, A. (2017). Places: A 10 million image database for scene recognition. IEEE Transactions on Pattern Analysis and Machine Intelligence, 40(6): 1452-1464. https://doi.org/10.1109/TPAMI.2017.2723009
[21] Chang, H., Yu, F., Wang, J., Ashley, D., Finkelstein, A. (2016). Automatic triage for a photo series. ACM Transactions on Graphics (TOG), 35(4): 1-10. https://doi.org/10.1145/2897824.2925908
[22] Kaufman, L., Lischinski, D., Werman, M. (2012). Content-aware automatic photo enhancement. Computer Graphics Forum, 31(8): 2528–2540. https://doi.org/10.1111/j.1467-8659.2012.03225.x
[23] Murray, N., Marchesotti, L., Perronnin, F. (2012). AVA: A large-scale database for aesthetic visual analysis. In 2012 IEEE Conference on Computer Vision and Pattern Recognition, pp. 2408-2415.
[24] Schriver, K.A. (2010). Visual language for designers: Principles for creating graphics that people Understand. Information Design Journal, 18(1): 84-87. https://doi.org/10.1075/idj.18.1.12sch
[25] AL-Ayash, A., Kane, R.T., Smith, D., Green-Armytage, P. (2016). The influence of color on student emotion, heart rate, and performance in learning environments. Color Research & Application, 41(2): 196-205. https://doi.org/10.1002/col.21949
[26] Singh, S. (2006). Impact of color on marketing. Management Decision, 44(6): 783-789. https://doi.org/10.1108/00251740610673332
[27] Bohn, K. (2006). 50 Principles of Composition in Photography: A Practical Guide to Seeing Photographically Through the Eyes of a Master Photographer. CCB Publishing.
[28] Präkel, D. (2012). Composition. Routledge. https://www.taylorfrancis.com/books/mono/10.4324/9781003103356/composition-david-prakel
[29] Li, Y., Xie, Y. (2020). Is a picture worth a thousand words? An empirical study of image content and social media engagement. Journal of Marketing Research, 57(1): 1-19. https://doi.org/10.1177/0022243719881113
[30] https://www.ibm.com/cloud/learn/underfitting.
[31] Bardenet, R., Brendel, M., Kégl, B., Sebag, M. (2013). Collaborative hyperparameter tuning. Proceedings of the 30th International Conference on Machine Learning, PMLR, 28(2): 199-207.
[32] Gegic, E., Isakovic, B., Keco, D., Masetic, Z., Kevric, J. (2019). Car price prediction using machine learning techniques. TEM Journal, 8(1): 113-118.
[33] Shaari, H., Kevrić, J., Jukić, S. (2022). Machine learning algorithms: Practical case studies.
[34] Caers, R., De Feyter, T., De Couck, M., Stough, T., Vigna, C., Du Bois, C. (2013). Facebook: A literature review. New Media & Society, 15(6): 982-1002. https://doi.org/10.1177/1461444813488061