Lubna Taranum Mazar Pasha*![]() | Jangam Siddamallaiah Rajashekar
| Jangam Siddamallaiah Rajashekar![]()
© 2023 IIETA. This article is published by IIETA and is licensed under the CC BY 4.0 license (http://creativecommons.org/licenses/by/4.0/).
OPEN ACCESS
As one of the most common causes of blindness, Diabetic Retinopathy (DR) is a devastating disease of the retina. Doctors utilize optical coherence tomography (OCT) and fundus photography to examine the retina's thickness, grade, structure, and edoema, as well as to detect scarring. To categorize and stage the disease, deep learning algorithms are usually used to analyze OCT or fundus pictures and extract unique properties for each stage of DR. Until the disease has progressed significantly, the signs and symptoms are difficult to detect. Patients with a high propensity for DR vision loss can benefit from early detection and monitoring. However, because to the intricacy of the image captured by colour fundus photography, human detection and classification of Diabetic Retinopathy is a difficult and error-prone task. DR levels have previously been detected and classified using machine learning techniques armed with several feature extraction techniques. This research presents a Resemblance Pixel Vector Set with Convolution Neural Network (RPVS-CNN) model for accurate detection of severity detection of DR using MR images. Diabetic Retinopathy can be objectively diagnosed and graded using the suggested method, eliminating the necessity for a retina specialist and increasing the number of people who can receive retinal care. A network with CNN architecture and data augmentation is developed that can identify the intricate aspects of the classification task including micro-aneurysms, exudate and haemorrhages on the retina and subsequently deliver a diagnosis automatically and without input from the end-user. The proposed model is compared with the traditional models and the results illustrate that the proposed model performance is enhanced.
Diabetic Retinopathy, Convolution Neural Network, deep learning, resemblance pixel set
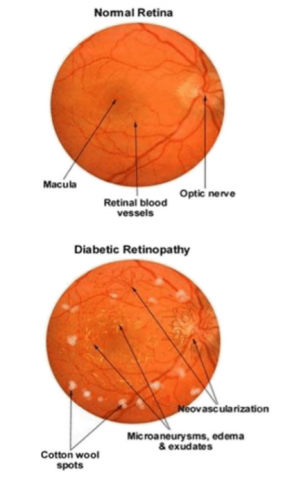
In the last few decades, diabetes has become a worldwide epidemic. Diabetic consequences include, but are not limited to, abnormal metabolic processes, kidney failure, neurological abnormalities, and retinopathy [1]. This is due mostly to the body's inability to properly use insulin or high blood sugar levels [2]. Retinopathy is a serious disorder of the eyes that causes irreversible loss of vision [3]. Diabetes is more likely to strike persons with a history of the disease than people without a history of the disease, whether they are type 1 or type 2 diabetics [4]. World Health Organization describes DR as a serious eye condition that require immediate international attention [5]. For every 75 million diabetics in India, there are approximately 23,000 ophthalmologists. The overwhelming number of sufferers is a direct outcome of a fact that so many people are unaware that they are struggling from this disease [6]. They also display a lack of empathy and caution when it comes to this disease. Diabetics have a 25-fold greater chance of developing diabetes-related complications than those who are otherwise healthy [7]. It is hard to diagnose this condition at the beginning because it is symptomatic or presents extremely mild symptoms, which leaves a patient in oblivion and gradually results in eyesight impairment [8]. As a result, early detection of DR is critical to preventing the disorder's complications. The diagnosis of this ailment necessitates the use of highly effective technology and procedures by medical professionals and specialists in order to aid in the advancement of the prognosis of this disease [9]. The Figure 1 indicates the normal retina image and DR image.
It's estimated that about 80% of diabetics will acquire DR within the first twenty years of diagnosis [10]. Laser treatment or intravitreal injection of generally pro endothelial protein called or steroids might delay or avoid the development of sight-threatening consequences of DR [11]. In order to be successful, many treatment techniques require timely detection, especially so when disease has progressed to the point where intervention is needed. In spite of this problem's importance, requiring experts and trained optometrists results in a costly and time treatment. To make matters more complicated, skilled clinical interpretation is frequently required to assign a degree of severity to DRs and to detect the disease in its early stages [12].
Using preprocessing, the fundus images image can be made clearer and more contrasted by removing noise and variance [13]. Image normalisation and non-uniform intensity correction, in addition to data augmentation and noise reduction, can be employed in the preprocessing step to reduce visual artefacts and improve process precision [14]. In addition, fundus images are used to locate, extract, and segment features for use in pre-trained models. In this research, image enhancing techniques is used, such as contrast enhancement and lighting correction [15], to improve the aesthetic and information value of the original photos before processing. Enhancement of contrast: Images can be improved by using adaptive histogram equalization. The Figure 2 and Figure 3 represents the resized image and retinal fundus image used for analysis.
Figure 1. Normal retina image and Diabetic Retinopathy
Figure 2. Resized image
Figures 2 and 3 depict a normal retina and a retina affected by Diabetic Retinopathy, respectively. DR severity must be classified and circumvented by an autonomous detection system that is unerring [16]. While most DR research has relied on machine learning algorithms for feature extraction, an issue with manual feature extraction motivated researchers to look deeper into the subject [17]. Data mining, image analysis, machine learning, and deep learning all got their start because of advances in medical research [18]. Since its introduction in many sectors like sentiment analysis, handwriting identification, stock market prediction [19], and medical picture analysis, Deep learning has been gaining a lot of attention. When it comes to picture categorization, CNN in deep learning has a good track record. Figure 4 depicts the CNN's layer-by-layer structure [20].
Figure 3. Retinal fundus image
Figure 4. CNN architecture
For the identification of multiparametric images on severity level, the current study utilizes deep learning methodology, particularly CNN [21]. An Indian-based database called Indian Eye Disease Image Dataset was used to supply the retinal fundus image for the ISBI 2018 challenge. Due to differences in pixels between datasets and real-time images [22], an image's total pixels must be adjusted by image scaling. This increases or decreases the classification speed. There are various ways to reduce the size of the medical images, such as by using the values of the pixels 256x256, 512x512 and 1024x1024.
Diabetic Optic neuritis has been accurately diagnosed and detected in recent years using a new method. Instead of the older model diagnosis of DR [23], a modern automated procedure is used in this new strategy. One of the most essential screening tools for early diagnosis of retinal disease is analysis of fundus images pictures [24]. With this innovative strategy, users can save a lot of money and time while simultaneously getting more trustworthy and accurate results [25]. Retinopathy is a disorder that produces abnormalities in the retina, which can lead to complete blindness in extreme cases. There is a classification technique that analyses retinal fundus images and identifies whether or not an individual is experiencing (DR) and at what stage he/she currently is indicating the severity level. In addition, the focus of this study is on recognizing and utilizing DR distinct characteristics and qualities for optimal classification precision. This research presents a Resemblance Pixel Vector Set with Convolution Neural Network (RPVS-CNN) model for accurate detection of severity detection of DR using MR images. Diabetic Retinopathy can be objectively diagnosed and graded using the suggested method, eliminating the necessity for a retina specialist and increasing the number of people who can receive retinal care.
DR is among the most serious health issues that has gripped the planet. In order to establish the best options for timely identification of this condition, thereby preventing premature changes in vision, researchers are focusing their attention on this disease. In an effort to improve the lifestyles of both doctors and patients, several research have been undertaken and continue to be conducted.
Based on the DCNN architecture of Alyoubi et al. [1], a DCNN-based four-class classification algorithm was developed. Fractional max-pooling layers were used in place of the traditional max-pooling layers in this investigation. A picture collection from the Kaggle provided the researchers with 35000 retinal images for their investigation. Their model, on the other hand, achieved a classification accuracy of 85 percent, making it suitable for practical usage. Utilizing the Singaporeans National Diabetes Retinal Detachments Screening (SIDRP) dataset of 76,370 retinal pictures, Mahmud and Bhattacharjee [3] suggested and validated a CNN-based DR classifier using an additional 4504 images obtained from metropolitan areas in Zambia's Copperbelt province. Aside from accuracy, the model's sensitivity and specificity were also supplied, with values of 92 percent and 89 percent.
Using the EyePACS dataset, Cisneros-Guzman et al. [5] developed a deep learn model based on 140,000 retinal pictures. As part of their research, they wanted to find out how computer-assisted DR classification methods affected physician readers. With sensitivity and specificity being above 90%, they classified 88% of the samples correctly. Using 28,000 pictures from the EyePACS dataset, Orlando et al. [6] developed the Binocular Siamese-like CNN-based approach. However, their model's sensitivity was only 82% and specificity was just 70%, so it's safe to say it didn't do well.
Using the Grading System of Eye Disease (GSDR), Sadda et al. [8] described an automated DR identification and grading system. External validation was done after training on 3500 DR images. Both the sensitivity and specificity of their model are more than 94%. Each neuron's output score is divided into two different components by the CNN's architecture, which makes it unique. In light of the method's sensitivity and specificity ratings of around 90%, as well as the fact that no external validation has been performed, concerns can be raised about its performance. Using 88,000 retinal pictures from two Kaggle datasets, Amin et al. [9] devised a multi-class DR-classification approach using multiple CNNs. For this concept to be implemented in cellphones, they had to consider the tradeoff between efficiency and efficacy.
Local Binary Patterns (LBP) was employed for extraction of features and Machine Learning were used for classification in the study of Chetoui et al. [11]. The random forest surpassed the SVM in terms of accuracy, coming in at 97%. With 95 photos, the dataset utilized in this research was somewhat limited. This is a departure from previous studies, which relied on manual extracting features for the detection of DR in various computer-based systems. Sadek.et al. [12] utilised characteristics such as blood vessels, neovascularization, exudates, and internal bleeding from 350 fundus pictures using SVM with just an accuracy of much more than 85%. The SVM classifier suggested by Doshi et al. [14] can be used to automatically detect DR by recognising exudates from fundus. For DR, some researchers have attempted to combine manual and learning techniques feature extraction techniques. The author used Big Data and machine learning to forecast several diabetic-related ailments, such as heart problems and skin cancer, while taking into account both advantages and downsides.
Type 2 diabetes called diabetes mellitus (DM) is on the rise around the world, with epidemic proportions. By 2030, more than 390 million people are expected to be affected by DM. The severity of DR must be classified, and staged in order to develop an appropriate treatment plan. More than 90% of cases of vision loss can be avoided with proper management. Patients with diabetes have microvascular abnormalities, which cause retinal ischemia, the formation of new blood vessels and swelling of the macular area.
It is possible for patients with DR to lose their vision if they do not receive treatment. One of the primary causes of blindness in working-age people in industrialized nations is DR, which has a significant financial impact on society, particularly on healthcare systems. It is critical to diagnose, classify, and stage the DR severity in order to develop appropriate therapy, given that careful diagnosis and management with DR can avoid more than 90% of cases of vision loss. Communicating across medical disciplines is especially important in disorders like DM, which necessitate a multidisciplinary treatment.
A wide range of sectors in science and engineering have been significantly impacted by recent advances in machine learning and artificial intelligence. In the medical field, advancements in technology have had a significant impact. Researchers were able to automate the diagnosis of numerous diseases with enhanced machine learning algorithms. Researchers are also attempting to do this for the diagnosis of DRs. In this regard, a number of effective strategies have been presented and put into action thus far. Images of the retina obtained through the method known as Fundus Photography are used to make a practical diagnosis of DR.
This phenomenon, known as the curse of dimensionality, is unique to high-dimensional settings, such as the analysis and organisation of data, and does not arise in low-dimensional settings, including as the three-dimensional real-world environment of everyday experience. The more features you have, the more room there is for error, which is what the curse of dimensionality refers to. It alludes to the reality that algorithms have an execution duration that grows exponentially with the number of dimensions, making their design more challenging.
The retina and its contents are captured in exquisite detail in these photos. For clean DR pictures, Convolutional Neural Network (CNN) based state-of-the-art algorithms work quite well. Numerous factors influence the current DR detection procedures. These include the retinal images' origins, image preprocessing techniques used, the features retrieved from retinal images, and the machine learning algorithms employed. The vast majority of researchers working with retinal image datasets employ deep learning techniques. The framework of the proposed model is shown in Figure 5.
Data in a high-dimensional space are more dense and include more information on each sample, but the samples themselves are more sparse and spread out, making it more difficult for learning algorithms to create decision boundaries. There is a phenomena called the curse of dimensionality that has a significant impact on machine learning algorithms that will be avoided in the proposed model. The working of the proposed Resemblance Pixel Vector Set with Convolution Neural Network is discussed clearly in the algorithm.
Figure 5.Proposed model architecture
Algorithm RPVS-CNN
{
Step-1. The image from the considered dataset is loaded. The image need to be converted into numerical format for detection of DR in the features considered. The image consideration and analysis is performed as
$\begin{aligned} {ImageV}(i)=\sum_{i=1}^N & { imageID }(i) +{getImage}( { DRImageSet }[N]) \in { DRImageSet }\end{aligned}$
${ImageV}$$(i)=\sum_{i=1} \theta(x, y)+\cos (T h)$
Here ɵ is the initial angle of the image and cos function is used to perform cosine transformation on the image.
Step-2. The loaded image will undergo image quality enhancement by performing enhanced histogram equalization operations. The image quality can be enhanced as
$\begin{aligned} & { IQ }({ImageV}(i)) =\sum_{i=1}^N { getIntensity }(x, y)-\delta(x, y) +\tau(\max{ Intensity }-\lambda)\end{aligned}$
$I Q V[M]=\sum_{i=1}^M\left[I Q(i)+\frac{\| \max \text { Intensity }^{(I Q(i)))^T\,\quad}}{2}\right]+\tau(\lambda)$
Here $\delta$ is the model used for extracting pixels of poor intensity and $\tau$ is the model used to add intensity for the poor quality pixels and $\lambda$ is the intensity of maximum range.
Step-3. The pixel extraction is performed on the image by considering the image boundaries. The pixel extraction process is performed on the Image as
$\begin{aligned} {PixelSet}(\Omega(f))^M=\sum_{i=1}^M & {\left[\left(\sum_{(x, y) \in \Omega} \max {Intensity }(x, y)+I Q(x)\right) * \omega\right] } + \frac{I Q}{4} y^{(x-1)}+x^{(y-1)}-\lambda\end{aligned}$
Step-4. The similarity check will be performed on the extracted pixels from the image. The values of similar kind are clustered and they are used for processing the severity levels. The similarity check is performed as
$\begin{aligned} & { SimPix }({ PixelSet }(i) =\frac{\sum_{i \in I Q_i}{getIntensity }(\max (x+1, y+1))}{\sum_{i \in { PixelSet }(i)_M}\,\, \| \min G { rayValue }(x, y) \|+\lambda_i}\end{aligned}$
Step-5. The Resemblance Pixel Vector Set is generated from the extracted pixel set. The CNN model is applied for the resemblance check so that hidden layers will process the data for accurate detection of the severity levels of the DR disease. The resemblance pixel vector set is generated as
$R {Set}({SimPix}(i))=\frac{{Max}({Sim} P i x(x, y))\,\,\,\,}{2}\left[\frac{\left(\omega+x^y+y^x\right)^2}{\left(\tau-x^y+y^x\right)}+\lambda\right]$
Step-6. The Severity levels are detected from the resemblance pixel vector set. The detection process is performed using the representation as
$\begin{aligned} { SeveritySet }[M]= & \sum_{i=1}^M {Sim}{Pix}({Rset}(i))-\tau +\sum_{i=1}^M \frac{\min ({Rset}(x, y)-\omega}{\operatorname{sizeof}(\text { Rset })}\end{aligned}$
}
Patients with a high propensity for DR vision loss can benefit from early detection and monitoring. It is difficult and error-prone for a human to diagnose and classify Diabetic Retinopathy due to the intricacy of the images captured by colour fundus photography. DR levels have previously been detected and classified using deep learning techniques armed with feature extraction techniques. Typical DR lesions and normal retinal structures are included in the dataset. The data reveals information on the patient's disease stage and severity. The proposed model is implemented in python and executed in Google Colab. The dataset is considered from the link https://www.kaggle.com/competitions/diabetic-retinopathy-detection/data. The proposed Resemblance Pixel Vector Set with Convolution Neural Network (RPVS-CNN) model is compared with the existing CNN512-YOLOv3 Model and the results are represented clearly.
Image Enhancement is the practice of enhancing images so that they can be better understood by humans and used as input for other automatic image processing methods. An image's ability to convey information to humans and to other computerized image processing systems can be improved by "enhancing" images. With Image Enhancement, it's the goal to alter an image's properties so that it is better suited for the intended use and the intended audience. The image quality enhancement accuracy levels are represented in Figure 6.
Image Segmentation is a technique for dividing up a digital image into smaller groups of pixels called Image Objects, which makes it easier to examine the image. Boundaries can be defined and lines drawn to separate the most important elements of an image from those that are less critical. The proposed model performs image segmentation for accurate severity detection. The image segmentation accuracy levels are shown in Figure 7.
When many pixels are placed together, they form a pixel-based graphic. Pixels are minute colored dots on a screen. Mathematical formulae determine the relative positions of the shapes' edges on the page to create vector graphics. The proposed model generates a pixel vector set that holds the pixels of the relevant object. The pixel vector set generation time levels are shown in Figure 8.
Pixel values are the numbers that make up an image's matrix in a computer's memory. The strength of each pixel is represented by these pixel values. There are two values for black and white: 0 and 255. The pixel vector set is used to extract the features and then detect the DR severity. The pixel vector set generation accuracy levels are shown in Figure 9.
After generating the pixel vector set from the image segments, the similarity check will be performed on the segment pixels. The resemblance pixel vector set is generated for accurate prediction of DR severity. The Figure 10 indicates the Resemblance Pixel Vector Set Generation Accuracy Levels of the traditional and proposed models.
To develop a model from beginning and train it is a tedious operation requiring a significant volume of images. This shortcoming of the DL methods can be patched up by utilizing another method to a task termed transfer learning. In this, a CNN model is trained on pixel vector set, and to learn features it was used thousands of classes from the DR fundus photos. This enables specialists to construct models identifying and classifying unseen images into a correct grade or level with better accuracy. The DR severity detection accuracy levels of the proposed models are shown in Figure 11.
Figure 6. Image quality enhancement accuracy levels
Figure 7. Image segmentation accuracy levels
Figure 8. Pixel vector set generation time level
Figure 9. Pixel vector set accuracy levels
Figure 10. Resemblance pixel vector set generation accuracy levels
Figure 11. DR severity detection accuracy levels
Proliferative DR (PDR) is the last and most advanced stage of DR, which is characterized by blurred vision. DR becomes proliferative once it reaches the third stage, resulting in permanent loss of vision. In PDR, defective retinal blood vessels are replaced by new blood vessels. In addition to the retinal detachment, new-formed blood vessels might burst in the retina, resulting in irreversible blindness, as a result of PDR. Deep Learning's added benefit is the ability to selectively recognize between different categories through automatic recognition. For the purpose of evaluating the system's robustness and responsiveness in real-world circumstances, the researchers combined data from multiple sources. Allows for the standardization of labor-intensive eye screening processes and serves as an auxiliary diagnostic reference, whilst avoiding human subjectivity.A Resemblance Pixel Vector Set with Convolution Neural Network model is proposed in this research for accurate detection of DR and the severity levels are clearly represented. The proposed model achieves 98% accuracy in detecting the DR and the severity levels. In future, optimization models can be integrated with the deep learning models for reducing the feature set and increasing the detection levels.
[1] Alyoubi, W.L., Abulkhair, M.F., Shalash, W.M. (2021). Diabetic Retinopathy fundus image classification and lesions localization system using deep learning. Sensors, 21(11): 3704. https://doi.org/10.3390/s21113704
[2] Bajwa A, Nosheen N, Talpur K.I., Akram, S. (2023). A prospective study on diabetic retinopathy detection based on modify convolutional neural network using fundus images at Sindh Institute of Ophthalmology & Visual Sciences. Diagnostics (Basel), 13(3): 393. https://doi.org/10.3390/diagnostics13030393
[3] Mahmud, T., Bhattacharjee, I. (2020). Diabetic Retinopathy classification from retinal images using machine learning approaches. Department of Computer Science and Engineering, Khulna University of Engineering & Technology. Bangladesh, Khulna-9203.
[4] Kumar, S., Kumar, B. (2018). Diabetic Retinopathy detection by extracting area and number of microaneurysm from colour fundus image. In 2018 5th International Conference on Signal Processing and Integrated Networks (SPIN), pp. 359-364. https://doi.org/10.1109/SPIN.2018.8474264
[5] Cisneros-Guzmán, F., Tovar-Arriaga, S., Pedraza, C., González-Gutierrez, A. (2019). Classification of Diabetic Retinopathy based on hard exudates patterns, using images processing and SVM. In 2019 IEEE Colombian Conference on Applications in Computational Intelligence (ColCACI), pp. 1-5. https://doi.org/10.1109/ColCACI.2019.8781802
[6] Orlando, J.I., Prokofyeva, E., Del Fresno, M., Blaschko, M.B. (2018). An ensemble deep learning based approach for red lesion detection in fundus images. Computer Methods and Programs in Biomedicine, 153: 115-127. https://doi.org/10.1016/j.cmpb.2017.10.017
[7] Preetha, S., Chandan, N., Darshan, N.K., Gowrav, P.B. (2020). Diabetes disease prediction using machine learning. International Journal of Recent Trends in Engineering & Research (IJRTER), 6(5). https://doi.org/10.23883/IJRTER.2020.6029.65Q5H
[8] Sadda, S.R., Nittala, M.G., Taweebanjongsin, W., Verma, A., Velaga, S.B., Alagorie, A.R.,Sears,C.M.,Silva, P.S., Aiello, L.P. (2020). Quantitative assessment of the severity of Diabetic Retinopathy. American Journal of Ophthalmology, 218: 342-352. https://doi.org/10.1016/j.ajo.2020.05.021
[9] Amin, J., Sharif, M., Yasmin, M. (2016). A review on recent developments for detection of Diabetic Retinopathy. Scientifica, 2016. https://doi.org/10.1155/2016/6838976
[10] Kumaran, Y., Patil, C.M. (2018). A brief review of the detection of Diabetic Retinopathy in human eyes using pre-processing & segmentation techniques. International Journal of Recent Technology and Engineering, 7(4): 310-320.
[11] Chetoui, M., Akhloufi, M.A., Kardouchi, M. (2018). Diabetic Retinopathy detection using machine learning and texture features. In2018 IEEE Canadian Conference on Electrical & Computer Engineering (CCECE), pp. 1-4. https://doi.org/10.1109/CCECE.2018.8447809
[12] Sadek, I., Elawady, M., Shabayek, A.E.R. (2017). Automatic classification of bright retinal lesions via deep network features. arXiv Preprint arXiv:1707.02022. https://doi.org/10.48550/arXiv.1707.02022
[13] Zago, G.T., Andreão, R.V., Dorizzi, B., Salles, E.O.T. (2020). Diabetic Retinopathy detection using red lesion localization and convolutional neural networks. Computers in Biology and Medicine, 116: 103537. https://doi.org/10.1016/j.compbiomed.2019.103537
[14] Doshi, D., Shenoy, A., Sidhpura, D., Gharpure, P. (2016). Diabetic retinopathy detection using deep convolutional neural networks. In 2016 International Conference on Computing, Analytics and Security Trends (CAST). IEEE, pp. 261-266. https://doi.org/10.1109/CAST.2016.7914977
[15] Kaur, P., Chatterjee, S., Singh, D. (2019). Neural network technique for Diabetic Retinopathy detection. International Journal of Engineering and Advanced Technol (IJEAT), 8(6): 440-445. https:/doi.org/10.35940/ijeat.E7835.088619
[16] Voets, M., Møllersen, K., Bongo, L.A. (2019). Reproduction study using public data of: Development and validation of a deep learning algorithm for detection of Diabetic Retinopathy in retinal fundus photographs. PloS One, 14(6): e0217541. https://doi.org/10.1371/journal.pone.0217541
[17] Zeng, X., Chen, H., Luo, Y., Ye, W. (2019). Automated diabetic retinopathy detection based on binocular siamese-like convolutional neural network. IEEE Access, 7: 30744-30753. https://doi.org/10.1109/ACCESS.2019.2903171
[18] Zhang, W., Zhong, J., Yang, S., Gao, Z., Hu, J., Chen, Y., Yi, Z. (2019). Automated identification and grading system of Diabetic Retinopathy using deep neural networks. Knowledge-Based Systems, 175: 12-25. https://doi.org/10.1016/j.knosys.2019.03.016
[19] de La Torre, J., Valls, A., Puig, D. (2020). A deep learning interpretable classifier for Diabetic Retinopathy disease grading. Neurocomputing, 396: 465-476. https://doi.org/10.1016/j.neucom.2018.07.102
[20] Pires, R., Avila, S., Wainer, J., Valle, E., Abramoff, M.D., Rocha, A. (2019). A data-driven approach to referable Diabetic Retinopathy detection. Artificial Intelligence in Medicine, 96: 93-106. https://doi.org/10.1016/j.artmed.2019.03.009
[21] Gargeya, R., Leng, T. (2017). Automated identification of Diabetic Retinopathy using deep learning. Ophthalmology, 124(7): 962-969. https://doi.org/10.1016/j.ophtha.2017.02.008
[22] Ghosh, R., Ghosh, K., Maitra, S. (2017). Automatic detection and classification of Diabetic Retinopathy stages using CNN. In 2017 4th International Conference on Signal Processing and Integrated Networks (SPIN), pp. 550-554. https://doi.org/10.1109/SPIN.2017.8050011
[23] Gadekallu, T.R., Khare, N., Bhattacharya, S., Singh, S., Maddikunta, P.K.R., Ra, I.H., Alazab, M. (2020). Early detection of Diabetic Retinopathy using PCA-firefly based deep learning model. Electronics, 9(2): 274. https://doi.org/10.3390/electronics9020274
[24] Gangwar, A.K., Ravi, V. (2021). Diabetic Retinopathy detection using transfer learning and deep learning. Evolution in Computational Intelligence: Frontiers in Intelligent Computing: Theory and Applications (FICTA 2020), 1: 679-689. https://doi.org/10.1007/978-981-15-5788-0_64
[25] Gharaibeh, N.Y. (2020). Detection of Diabetic Retinopathy using partial swarm optimization (PSO) and Gaussian interval type-2 fuzzy membership functions (GIT2FMFS). Materials Today: Proceedings. https://doi.org/10.1016/j.matpr.2020.10.279