Haider A.A. Mohammed![]() | Israa Nazeeh
| Israa Nazeeh![]() | Wisam Ch. Alisawi
| Wisam Ch. Alisawi![]() | Qusay Kanaan Kadhim*
| Qusay Kanaan Kadhim*![]() | Shaymaa Taha Ahmed
| Shaymaa Taha Ahmed![]()
© 2023 IIETA. This article is published by IIETA and is licensed under the CC BY 4.0 license (http://creativecommons.org/licenses/by/4.0/).
OPEN ACCESS
The goal is to facilitate early disease detection. A Grey Wolf Optimizer (GWO) was implemented in the proposed method, a meta-heuristic algorithm known for its efficiency in reducing computational time for high-dimensional data. This optimization technique simplifies the problem by breaking it into manageable subsets. Following this, a filter approach, such as analysis of variance (ANOVA), was used to select informative genes from the reduced data. A Support Vector Machine (SVM) was also used as a classifier to select genes that efficiently categorize anomalous cases, serving as a fitness function-this combined approach, referred to as GWO-SVM, and aimed to reduce computational time while improving accuracy. The experimental results demonstrated that the proposed method achieved an accuracy rate of 96.46% in predicting disease detection, representing a significant improvement compared to previous methods. These findings underscore the potential of the GWO-SVM approach in advancing anomaly detection in human diseases.
grey wolf optimizer, gene expression datasets, analysis of variance, support vector machine, gene selection
The discovery of important genes linked to various diseases, which is essential for the diagnosis and treatment of these diseases, attracts biologists and life scientists. With a small number of samples, it is difficult to obtain the key genes needed for anomaly detection (classification) due to the high complexity of the dataset. It has some drawbacks, including high computing costs and early convergence [1]. Wavelet is applied to sample reduction and high frequency noise is removed in order to find susceptibility genes of composite diseases and maintain a fair balance between global search and local search. Nevertheless, it costs more to compute and needs a lot of storage. The challenge the curse of dimensionality: The number of genes in the gene expression data is very huge (containing thousands of genes). It is common that not all genes are useful; some genes are irrelevant and redundant information in the dataset. Therefore, working on this huge number of genes is difficult. As a result, a different approach to dimension reduction is adopted. Dimensional reduction is a method for extracting information from a large number of genes into a smaller set of genes of interest using the analysis of variance (ANOVA) method and optimization procedure are used to decrease the feature vector dimensions and boost discriminative power. ANOVA is used to determine if there are significant differences between groups of gene expression data. It can be used when comparing multiple groups or treatments to see if any of them have a significant effect on gene expression levels. Since it adeptly reduces the dimensionality of the data and subsequently lowers the computational cost of evaluating new data, the analysis of variance (ANOVA) is interesting [2]. Several innovative and successful methods for feature selection and optimization have been published in recent years. The Grey Wolf Optimizer (GWO) is implemented as software that has shown great success in a wide range of optimization domains. We must build a classifier after we have the features set. Several algorithms are offered throughout the classification step as well. Unsupervised classification falls under the first category, whereas supervised classification falls under the second. For example, support vector machines (SVM) classify points by letting them to fall into one of two disjoint half spaces [3]. The SVM are a popular machine learning technique used in gene expression analysis due to their ability to handle high-dimensional data, non-linearity, and noise. For linear classifiers, these half spaces are in the problem's original input space; for nonlinear classifiers, they are in a higher-dimensional feature space [4]. The SVM is used for classification since it performs and provides better accuracy than other classifiers. The suggested strategy for gene selection beats other current methods in terms of classification accuracy and limited subset of genes and attempts to speed up the learning process [5]. The proposed algorithm is broken down into various parts in this work. The grey wolf optimization technique generally reduces the operational time for higher dimensional data as the algorithm breaks down the entire complex problems into subsets. These steps are feature extraction, feature selection, and GWO-SVM model parameter optimization. ANOVA is then used for feature reduction and feature selection. The selected set of features from this phase’s output, along with the GWO-SVM model’s optimal parameters, is utilized as entries in the classification step. Gene abnormalities are divided by SVM classification following parameter optimization according to its training this technique demonstrates good ability in identifying human diseases [6]. In the final the objective in this paper we can using different dataset is collecting for using in anomaly detection of different disease. Using an enhanced Swarm intelligent approach is used for analyzing and recruits the subset of feature to satisfy the dimension reduction. Several datasets for different diseases collected. A novel approach for solving feature selection (Gen selection) based on the meta-heuristic search algorithm.
This section looks at similar works that used machine learning and meta-heuristic search techniques to analyze the gene selection problem. The comparison of the relevant studies with our paper is then discussed.
TLBOGSA [7], a novel hybrid meta-heuristics technique that combines the TLBO and GSA approaches, has been proposed as a gene selection strategy for classifying cancer types. This work used ten biological datasets to compare four different classifiers, including k-NN, NB, SVM, and DT. In this study, the NB classifier performs well regarding classification accuracy across practically all datasets. For the chosen top 50 genes, the dataset was reduced. The power level of classification as statistically significant was determined for this investigation using the Friedman test. The study only focused on a few genes and there remain others that have not been studied.
A hybrid filter/wrapper gene selection method called rMRMR-MBA [8] has been presented. It is based on the rMRMR approach (robust Minimum Redundancy Maximum Relevance) and modified bat algorithm (MBA). In order to make the BA in the wrapper strategy more effective and appropriate given the difficulty of the challenge of gene selection search space, it is modified. In order to better optimize its search process, examine accessing and navigating the most promising search space regions, and the interaction of genes, the suggested method combines TRIZ creative solutions with fundamental BA. Due to the smaller sample sizes and unstable nature of the given method.
A deep neural network (DNN) [9] was utilized as deep learning to increase the accuracy level of cancer identification from three datasets, including STAD (Stomach adenocarcinoma), LUAD (lung adenocarcinoma), and BRCA. The grey wolf technique was employed to extract significant characteristics in the pre-processing step (breast invasive carcinoma). For these three datasets, the proposed methodology produced the best accuracy. Accuracy close to 94 was attained using the suggested strategy. The limitation was unproven data with missing values
Gao et al. [10] used a Deep Neural Network (DNN) method for categorizing binary class microarray datasets. In order to find the best subset of genes and solve the dimensionality issues, gene selection is done using the Principal Component Analysis (PCA) approach. They employed eight common microarray cancer datasets in their investigation, including those for CNS, Colon, Prostate, Leukemia, Ovarian, and Lung-Harvard2, Lung-Michigan, and Breast cancers. According to the findings, the accuracy of the aforementioned model for the eight datasets was (0.93), (0.90), and (0.88), respectively. The limitation this takes a lot of time to locate the best features for given budget range.
Hameed et al. [11] applied the Mutual Information gene selection method to select important genes from the original gene expression data. The genes that have high mutual information value are selected as informative genes. They used in their study two microarray datasets: Colon and Lymphoma. The results indicated that the accuracy of the above two datasets using the classification model (SVM) as follows: (0.677) and (0.977) respectively.
Deshpande and Ragha [12] proposed a mutual information-based feature selection algorithm (FSMI). The informative genes are chosen as a candidate genes subset using the mutual information method. Five open microarray datasets, including those for colon, prostate, lymphoma, leukemia, and lung, were used in this work. An effective categorization model is Random Forest. The average accuracy was, successively, 86.52, 93.31, 96.43, 95.85, and 99.46.
In this section, we introduce a novel method for anomaly detection using GWO. The overall framework of the proposed method is shown in Figure 1. The proposed system architecture includes four main phases (data preprocessing, gene selection, prediction, and evaluation) for achieving the goal of this paper. A general view of these phases is provided here. First, the data preprocessing phase includes normalization. Second, the gene selection phase involves the use of analysis of variance, and the grey wolf algorithm. These methods help to reduce the number of genes and identify the most important ones used in the prediction phase.
Third, the prediction model was built and performed using SVM. Finally, the findings of the proposed model were evaluated based on different methods to estimate the predicted error.
Figure 1. Proposed model
3.1 Preprocessing of the dataset
Preprocessing is the initial stage of the proposed system, which intends to transform the raw dataset in an easy and efficient format. Therefore, it is a significant process which the main objective of obtaining a dataset that can be considered credible and helpful for machine learning techniques prediction models [13]. Here, this stage is performed by using normalization method. The normalization method was performed for all values of numeric genes that would be the input for the machine learning algorithms. It has been implemented on dataset to avoid genes with large values that control the calculation results. All genes values are normalized to the same or fixed range between zero and one using the Min-Max normalization method [14].
3.2 Gene selection
The gene selection a technique was used on the dataset choose crucial genes for the prediction process in order to decrease the dimensionality of the gene space, to increase the prediction's precision [15]. The results of this step are selecting a subset of the most informative genes. The conventional gene selection techniques were used initially. However, because a very high level of accuracy was not obtained, a Sequential Gene Selection (SGS) A technique to lower the number of genes and boost prediction accuracy was put forth. In fact, this thesis has faced a great challenge which is the curse of dimensionality because the dataset has a vast number of genes, so the main contribution is in the gene selection stage.
3.2.1 Analysis of variance method
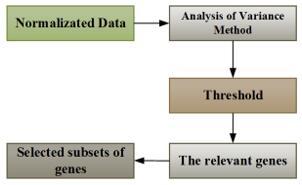
Analysis of variance method is used to select the relevant genes from the original dataset. Each gene has been subjected to it, and the related p-value serves as a gauge of how well it can distinguish between classes. All weak genes are removed by estimating the ANOVA method according to the predefined threshold. In this thesis, a threshold of 0.05 for p-value is used. According to the ANOVA method, any gene having a weight more than the threshold has been neglected. Generally, ANOVA method uses the p-values to rank the relevant genes with small values in ascending order [16]. Consequently, the selected genes are used for further processing. Figure 2 explains a process of choosing a subset of genes accordance with the ANOVA method.
Figure 2. Block diagram of the analysis of variance method [17]
This statistical method considers two hypotheses, null hypothesis and alternate hypothesis. The alternative hypothesis (H 1) states that there is some substantial difference between the classes, contrary to the null hypothesis (H (0)), which implies that the means of the classes are equal and there is no significant variation between the proprieties of different classes. The null hypothesis means that the genes have no influence on the outcome of the prediction. As a result, such genes may be eliminated [18]. The alternative theory, in contrast, contends that genes differ significantly in their properties. Thus, they are acceptable. As a result, the null hypothesis will be rejected and the alternative hypothesis will be accepted if any value is lower than the threshold [19].
3.2.2 Performing GWO for gene selection
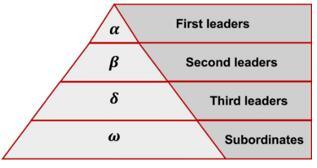
The four types of wolves-Alpha, Beta, Delta, and Omega-represent the wolves' internal leadership system, with the best wolf, second-best wolf, and third-best wolf being designated as alpha, beta, and delta, and the remaining wolfs as omega [20]. In the GWO, alpha, beta, and delta take the lead in optimization or hunting. They direct the other wolves toward the ideal regions or areas for searching. The likely location of prey during the iterative search process is evaluated by the alpha, beta, and delta wolves.
The GWO puts the searching, social hierarchy and hunting behavior of grey wolves into consideration [21]. Due to reduced randomness and differing numbers of individuals allocated in both global and local procedures of searching, the GWO algorithm can be easy to use and it undergoes rapid convergence [22]. Evidence shows that it has higher efficiency when compared to the PSO algorithm as well as other bionic algorithms. Greater focus has been given to its applications because of its better performance [23]. There have been efforts in the selection of features and bands, automatic control, parameter approximation, power dispatching, multi-objective optimization, and shop scheduling. Nevertheless, the standard GWO algorithm was developed with the equivalent significance of the positions of the grey wolves which does not have any strict consistency with their social hierarchy [23].
Current developments in the GWO algorithms, which include the binary GWO algorithm and the multi-objective GWO algorithm, tend to mix with others and when combined with their applications, they keep it unchanged. In case the search and hunt positions taken by the grey wolves also conform to the social hierarchy, then, the GWO algorithm can probably be enhanced [23], see Figure 3.
Figure 3. Hierarchy of grey wolf [24]
To add to the social hierarchy of wolves, they also have another exciting social behavior exhibited by grey wolves.
3.3 Building prediction model using SVM
The Support Vector Machine (SVM) the process of creating algorithms for a priori determined categories is known as supervised classification, often known as prediction or discrimination. To assess the correctness of algorithms, they are often constructed on a training dataset and then tested on a separate test dataset. The SVM are a collection of associated supervised learning techniques used for regression and classification tasks [25].
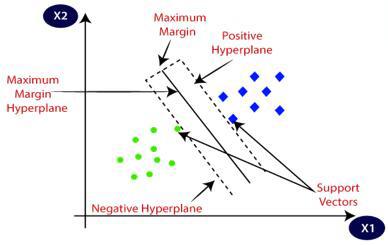
SVM maps data to a high-dimensional feature space, which enables the categorization of data even when the data cannot be separated in a linear way. A separator between the various categories is identified and then the data is transformed in a manner that the separator can be drawn as a hyperplane. SVM selects the extreme vectors or points that assist in the creation of the hyperplane [26]. These extreme cases are known as support vectors and therefore the algorithm is called the SVM. In Figure 4, there are two separate categories that are grouped on the basis of a decision boundary hyperplane.
Figure 4. The hyperplane source [26]
SVM is popular machine learning algorithm for both classification and regression tasks and has found application in many fields such as in solving various real-world problems, text categorization, image identification, and handwriting recognition [27].
3.4 The evaluation of prediction model
There are numerous different evaluation metrics that are used to rate various elements of recommendation quality and performance. One of the most commonly used metrics to evaluate any algorithm is defined as follows:
3.4.1 Confusion matrix
This measure's calculation is based on calculating the confusion matrix. This matrix lists how many occurrences a prediction model correctly or incorrectly predicted, as shown in the Table 1 [28].
Table 1. Confusion matrix
|
Predicted Actual |
Positive |
Negative |
|
Positive |
TP |
FN |
|
Negative |
FP |
TN |
(1) True Positive (TP): The positive examples which are properly classified.
(2) False Negative (FN): The positive examples which are wrongly classified.
(3) False Positive (FP): The negative examples which are wrongly classified.
(4) True Negative (TN): The negative examples which are properly classified.
3.4.2 Accuracy
A percentage of positive detection of all data cases in the following Equation [29].
Accuracy $=\frac{T P+T N}{T P+F N+F P+T N}$ (1)
3.4.3 Precision
Is calculated as the sum of the true positives and the false positives, divided by the numberof true positives in the following Equation [29].
Precision $=\frac{T P}{T P+F P}$ (2)
3.4.4 Recall
Is the sum of the true positives and false negatives equal to the number of true positives in the following Equation [29].
Recall $=\frac{T P}{T P+F N}$ (3)
3.4.5 F – measure
The accuracy is measured using a formula that combines recall and precision, as shown in the following Equation [29].
$F-$ measure $=2 \times \frac{\text { precision } \times \text { Recall }}{\text { Precision }+ \text { Recall }}$ (4)
The experimental findings are detailed and discussed in this section. A proposed system was implemented using Python development environment, the version used is Python 3.6 with PyCharm 2020 IDE. The system settings are windows 10 environment, 64 bits. The processor manufacturer is Intel with Core i7 running at 3.00 GHz. The capacity of RAM is 8 GB. The capacity of storage is 300 GB. The dataset used here is from Gene Expression Omnibus (GEO) from two datasets (GSE63060 and GSE63061). This dataset is become Public in 2015 and provided from the AddNeuroMed Cohort. It contains 16382 genes and 569 samples that are composed of 245 patients, 142 MCIs and 182 CTLs. The first row (sample) contains an identifier for each column (gene). Each row has a label that describes the patients' status whether a patient. The remaining values in the dataset represent the gene expression levels. This study aims to discover diseases in humans through different stages, highlighting the most beneficial genes, and investigating the effect of these genes on the performance of the prediction model. A dataset contains many genes, but not all of these genes are suitable for the prediction process as some of them decreased the accuracy of the prediction model and increased the temporal complexity. For this reason, a gene selection process is used in this study.
4.1 Results of data preprocessing
Normalization is a significant step that has been implemented on the dataset in order to avoid the differences in large values that dominate the results. The method of min-max normalization has been used to range the gene values between zero and one. The data preprocessing step on a small sample of the dataset.
4.2 Results of the analysis of variance method
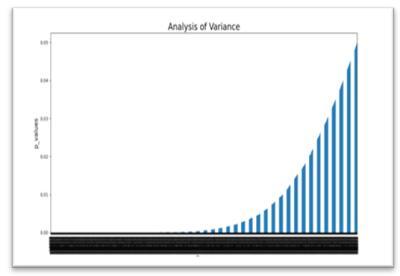
In this thesis, the analysis of variance method is adopted to reduce the high data dimensionality by selecting the informative genes. This method is applied to identify the most important genes affecting human disease. In this method, the p-value is set at 0.05, any value lesser than 0.05 is effective, while any value greater than this value is non-significant. Thus, sorting these genes according to their p-values helps to identify the genes with strong representation. By using the ANOVA method as a gene selector, (16382) genes of the dataset decreased to (9829) genes and are passing as input to another method for further analysis. Figure 5 highlights the most effective genes that are selected after applying the analysis of variance method.
Figure 5. The relevant genes selected through analysis of variance method
4.3 Results of GWO for SVM
Any newly created or modified algorithm's performance must be compared and evaluated against that of other already existing algorithms utilizing a good set of test functions. Particularly when optimization functions are involved, the majority of academics prefer to test the effectiveness of their algorithms on a sizable test set. The superiority of one algorithm over another, though, cannot be exclusively attributed to the way it handles issues that are either overly complex or devoid of a variety of features. Identification of the types of issues where an algorithm performed better than others is necessary for evaluating that method. This will make it easier to identify the kinds of issues the algorithm can handle. The proposed for the GWO algorithm has been evaluated in handling different difficult numerical optimization problems. It had a superior performance when compared to several well-known optimization algorithms, including the original GWO algorithm.The main aim for enhancing the performance of GWO is to design and develop a training algorithm for tuning the main hyperparameters of SVM. This subsection presents and discusses the results of GWO with SVM based on the main datasets. The GWO-SVM is compared with several other machine learning models including SVM with default parameters’ values. These models are Random Forest (RF), K-Nearest Nighbour (KNN), Gradient Boosting (GB), and AdaBoost. Table 2 below presents the default parameters used for executing the other models. It is important to mention that the experiments are executed based on datasets.
Table 2. Parameters settings for classification models
|
Model |
Parameter |
Value |
|
RF |
No. of Trees |
50 |
|
Limit Depth |
5 |
|
|
KNN |
K |
5 |
|
GB |
No. of Trees |
100 |
|
Learning rate |
0.3 |
|
|
Lambda |
10 |
|
|
AdaBoost |
No. of Estimators |
50 |
|
Learning rate |
1.0 |
|
|
SVM |
C |
1000 |
In this subsection, the performance of GWO-SVM is compared against several well-known machine learning models. Table 3 below presents a full comparison between the models. It is clear that our proposed model have attained better classification accuracy as compared to other models while maintaining other metrics such as recall and precision, which means GWO, helps SVM to find better values, and decreases the chances of over-fitting.
4.4 Evaluating the proposed model
Both accuracy and loss are used to evaluate the prediction model proposed. The performance of the prediction model SVM has been evaluated [30]. Generally, all the genes that appeared as influencing genes are taken. Actually, the accuracy is dramatically increased after using the selected genes. Since the process of identifying the informative genes which passed through several stages and most of gene selection techniques are used, the results of the ANOVA method have been satisfactory in the prediction model [31, 32]. It can be shown that the ANOVA method performs well especially when its comparison with raw dataset without techniques of gene selection methods [33]. The comparative results of accuracy and loss for the SVM model before and after applying the ANOVA method is illustrated in Table 4. Figure 6 illustrates the bar chart of the accuracy.
Table 3. The adopted measurement criteria for performance evaluation
|
Dataset |
Model |
Accuracy |
Recall |
Precision |
F1 |
|
GSE63060 and GSE63061 |
RF |
88.1% |
81.1% |
80.5% |
80.3% |
|
KNN |
85.7% |
77.4% |
76.6% |
74.1% |
|
|
GB |
89.3% |
83.3% |
82.6% |
80.2% |
|
|
AdaBoost |
69.7% |
68.7% |
67.5% |
66.5% |
|
|
SVM |
74.4% |
72.6% |
72.1% |
71.5% |
|
|
GWO-SVM |
96.49% |
85.7% |
85.2% |
82.3% |
Table 4. The comparative results of accuracy and loss for the SVM model
|
The Method |
Accuracy |
Loss |
Used Genes |
|
Raw Data + SVM |
0.422 |
1.077 |
16382 |
|
ANOVA + SVM |
0.964 |
0.079 |
150 |
Figure 6. Accuracy and Loss across the SVM model
The conclusions are presented during the design and implementation of the proposed methodology and achieving its results. The preprocessing step was an essential stage in the proposed system because it helped make the dataset in a suitable format for the machine learning algorithms. Analysis of variance (ANOVA) gene selection method has effectively proved to identify the relevant genes (the best genes) and remove irrelevant those that have adverse or zero effects based on the dataset nature to such an extent that the results are satisfactory in the prediction model. The other significant reduction of the genes has been performed with (GWO) for reducing the redundant genes; the optimal features were selected using the GWO algorithm. The suggested prediction method, performed via the SVM model, can derive the best prediction performance from many aspects compared to typical machine learning algorithms. In future, the suggested method will be tested on other joint training datasets to guarantee its good performance. Also, the training dataset should automatically determine the studied parameter's value to improve its adaptability and flexibility. Enhancing the clustering and detector radius optimization processes should also reduce the time it takes to generate a detector, which will, as we predicted, improve processing time overall.
[1] Ahmed, S.T., Kadhem, S.M. (2023). Optimizing Alzheimer's disease prediction using the nomadic people algorithm. International Journal of Electrical and Computer Engineering, 13(2): 2052-2067. https://doi.org/10.11591/ijece.v13i2.pp2052-2067
[2] Ahmed, S.T., Kadhem, S.M. (2022). Early Alzheimer's disease detection using different techniques based on microarray data: A review. International Journal of Online & Biomedical Engineering, 16(4): 106-126. https://doi.org/10.3991/ijoe.v18i04.27133
[3] Ahmed, S.T., Kadhim, Q.K., Mahdi, H.S., Abd Almahdy, W.S. (2021). Applying the MCMSI for online educational systems using the two-factor authentication. International Journal of Interactive Mobile Technologies (IJIM), 15(13): 162-171. https://doi.org/10.3991/ijim.v15i13.23227
[4] Alanni, R., Hou, J., Azzawi, H., Xiang, Y. (2019). Deep gene selection method to select genes from microarray datasets for cancer classification. BMC bioinformatics, 20(1): 1-15. https://doi.org/10.1186/s12859-019-3161-2
[5] Alirezanejad, M., Enayatifar, R., Motameni, H., Nematzadeh, H. (2020). Heuristic filter feature selection methods for medical datasets. Genomics, 112(2): 1173-1181. https://doi.org/10.1016/j.ygeno.2019.07.002
[6] Dashtban, M., Balafar, M. (2017). Gene selection for microarray cancer classification using a new evolutionary method employing artificial intelligence concepts. Genomics, 109(2): 91-107. https://doi.org/10.1016/j.ygeno.2017.01.004
[7] Vanitha, C.D.A., Devaraj, D., Venkatesulu, I. (2015). Gene expression data classification using support vector machine and mutual information-based gene selection. Procedia Computer Science, 47: 13-21. https://doi.org/10.1016/j.procs.2015.03.178
[8] Dey, A.K., Gupta, G.P., Sahu, S.P. (2023). Hybrid meta-heuristic based feature selection mechanism for cyber-attack detection in IoT-enabled networks. Procedia Computer Science, 218: 318-327. https://doi.org/10.1016/j.procs.2023.01.014
[9] Dhahi, S.H., Dhahi, E.H., Jawad, B., Ahmed, S.T. (2023). Using support vector machine regression to reduce cloud security risks in developing countries. Indonesian Journal of Electrical Engineering and Computer Science, 30(2): 1159. http://dx.doi.org/10.11591/ijeecs.v30.i2.pp1159-1166
[10] Gao, Z.M., Zhao, J. (2019). An improved grey wolf optimization algorithm with variable weights. Computational Intelligence and Neuroscience, 2019: 2981282. https://doi.org/10.1155/2019/2981282
[11] Hameed, E.M., Hussein, I.S., Altameemi, H.G., Kadhim, Q.K. (2022). Liver disease detection and prediction using SVM techniques. In 2022 3rd Information Technology to Enhance E-Learning and other Application (IT-ELA), Baghdad, Iraq, pp. 61-66. https://doi.org/10.1109/IT-ELA57378.2022.10107961
[12] Deshpande, H.S., Ragha, L. (2023). A hybrid random forest-based feature selection model using mutual information and F-score for preterm birth classification. International Journal of Medical Engineering and Informatics, 15(1): 84-96. https://doi.org/10.1504/IJMEI.2023.127257
[13] Louk, M.H.L., Tama, B.A. (2022). PSO-driven feature selection and hybrid ensemble for network anomaly detection. Big Data and Cognitive Computing, 6(4): 137. https://doi.org/10.3390/bdcc6040137
[14] Nazeeh, I., Hadi, T.H., Mohammed, Z.Q., Ahmed, S.T., Kadhim, Q.K. (2023). Optimizing blockchain technology using a data sharing model. Indonesian Journal of Electrical Engineering and Computer Science, 29(1): 431-440. https://doi.org/10.11591/ijeecs.v29.i1.pp431-440
[15] Jothi, N., Husain, W., Rashid, N.A., Syed-Mohamad, S. (2019). Feature selection method using genetic algorithm for medical dataset. International Journal on Advanced Science Engineering Information Technology, 9(6): 1907-1912.
[16] Kadhim, Q.K. (2017). Classification of human skin diseases using data mining. International Journal of Advanced Engineering Research and Science, 4(1): 237008. https://dx.doi.org/10.22161/ijaers.4.1.25
[17] Khadhim, B.J., Kadhim, Q.K., Shams, W.K., Ahmed, S.T., Wahab Alsiadi, W.A. (2023). Diagnose COVID-19 by using hybrid CNN-RNN for chest X-ray. Indonesian Journal of Electrical Engineering and Computer Science, 29(2): 852-860. https://doi.org/10.11591/ijeecs.v29.i2.pp852-860
[18] Rosett, C.M., Hagerty, A. (2021). Introducing Machine Learning. In: Introducing HR Analytics with Machine Learning. Springer, Cham. https://doi.org/10.1007/978-3-030-67626-1_8
[19] Long, W., Cai, S., Jiao, J., Tang, M. (2020). An efficient and robust grey wolf optimizer algorithm for large-scale numerical optimization. Soft Computing, 24(2): 997-1026. https://doi.org/10.1007/s00500-019-03939-y
[20] Mirjalili, S., Mirjalili, S.M., Lewis, A. (2014). Grey wolf optimizer. Advances in Engineering Software, 69: 46-61. https://doi.org/10.1016/j.advengsoft.2013.12.007
[21] Muszyński, M., Osowski, S. (2014). Data mining methods for gene selection on the basis of gene expression arrays. International Journal of Applied Mathematics and Computer Science, 24(3): 657-668. https://doi.org/10.2478/amcs-2014-0048
[22] Nakariyakul, S. (2019). A hybrid gene selection algorithm based on interaction information for microarray-based cancer classification. PloS One, 14(2): e0212333. https://doi.org/10.1371/journal.pone.0212333
[23] Pan, C., Si, Z., Du, X., Lv, Y. (2021). A four-step decision-making grey wolf optimization algorithm. Soft Computing, 25: 14375-14391. https://doi.org/10.1007/s00500-021-06194-2
[24] Patro, S., Sahu, K.K. (2015). Normalization: A preprocessing stage. arXiv preprint arXiv:1503.06462. https://doi.org/10.48550/arXiv.1503.06462
[25] Poornima, K.M., Jayakumari, S.T. (2015). Neural network based technique for Parkinson’s disease classification using ANOVA as feature selection model. International Journal of Engineering Research & Technology, 3(27): 1-5.
[26] Gorunescu, F. (2011). Introduction to data mining. In: Data Mining. Intelligent Systems Reference Library, vol 12. Springer, Berlin, Heidelberg. https://doi.org/10.1007/978-3-642-19721-5_1
[27] Sun, L., Kong, X., Xu, J., Xue, Z.A., Zhai, R., Zhang, S. (2019). A hybrid gene selection method based on ReliefF and ant colony optimization algorithm for tumor classification. Scientific Reports, 9(1): 8978. https://doi.org/10.1038/s41598-019-45223-x
[28] Tian, Y., Qi, Z. (2014). Review on: Twin support vector machines. Annals of Data Science, 1: 253-277. https://doi.org/10.1007/s40745-014-0018-4
[29] Wang, J.S., Li, S.X. (2019). An improved grey wolf optimizer based on differential evolution and elimination mechanism. Scientific Reports, 9(1): 7181. https://doi.org/10.1038/s41598-019-43546-3
[30] Zhongxin, W., Gang, S., Jing, Z., Jia, Z. (2016). Feature selection algorithm based on mutual information and lasso for microarray data. The Open Biotechnology Journal, 10(1). https://doi.org/10.2174/1874070701610010278
[31] Jadhav, A.D., Chobe, S.V. (2022). Risk assessment of cardiovascular diseases using kNN and decision tree classifier. Revue d’Intelligence Artificielle, 36(1): 155-161. https://doi.org/10.18280/RIA.360118
[32] Noola, D.A., Basavaraju, D.R. (2021). Corn leaf disease detection with pertinent feature selection model using machine learning technique with efficient spot tagging model. Revue d’Intelligence Artificielle, 35(6): 477-482. https://doi.org/10.18280/ria.350605
[33] Mukkapati, N., Anbarasi, M.S. (2022). Brain tumor classification based on enhanced CNN model. Revue d’Intelligence Artificielle, 36(1): 125-130. https://doi.org/10.18280/ria.360114