Bakyalakshmi Venkatachalam*![]() | Kanchana Sivanraju
| Kanchana Sivanraju![]()
© 2023 IIETA. This article is published by IIETA and is licensed under the CC BY 4.0 license (http://creativecommons.org/licenses/by/4.0/).
OPEN ACCESS
Early prediction of students' academic performance is a critical research topic in educational data mining. ML models have been developed to predict academic performance, but it has become difficult to extract high-quality handcrafted attributes due to the large dataset. To solve this issue, a Deep Neural Network (DNN) was presented to automatically extract attributes from students' multi-source data. However, it didn’t deal with the student’s mental health and their mood changes (i.e., physiological attributes), which were also essential to increase the prediction performance. Thus, this article proposes a Student Accomplishment prediction using the Distinctive Deep Learning (SADDL) model. First, the student’s academic and demographic attributes are collected along with the posts shared by them about academic performance on online social networks. A Latent Dirichlet Allocation (LDA) is applied to extract the physiological attributes from the online posts data. Then, all the attributes of students’ data are given to the SADDL network, which comprises three modules: (i) a Long Short-Term Memory (LSTM) module to learn the temporal dependency; (ii) a multidimensional Deep Convolutional Neural Network (DCNN) module to learn the correlation attributes and (iii) a Multi-Layer Perceptron (MLP) module to predict the students’ academic performance. Finally, the experimental results show that the SADDL can predict students’ academic performance with an accuracy of 91.71% while using 80% training and 20% test dataset, which is 9.91% improved than the existing ML models. Similarly, the SADDL has 89.3% while using 70% training and 30% test dataset, which is 10.36% higher than the existing ML models.
educational data mining, student performance, academic achievement, social media, mental health, linguistics, deep learning
Learning achievement is a crucial metric for assessing learning performance. Research has revealed that students who achieve poor grades are more likely to experience stress and hopelessness, and their probability of self-immolation [1] is significantly greater than that of students who perform well academically [2, 3]. Academies must recognize students at risk promptly to motivate their academic performance and provide early assistance [4, 5]. Teachers can recognize students who require extra classes, assignments, or encouragement to prevent undesirable behaviors [6, 7]. Educational data mining has been used to predict a student's learning performance [8].
Early identification of students with poor academic performance creates opportunities for research to improve those students' academic performance and guarantee their achievement [9]. High school students are the ideal target group for this research field due to their academic achievement having an impact on their future educational opportunities [10]. The dataset gathered from high school students contains socioeconomic and educational data about the students [11]. However, determining the academic achievement of all students is an extremely challenging task due to the large number of students and inadequate resources [12]. To solve this problem, numerous scholars have claimed in the literature that different types of ML models have been utilized to predict students' academic success [13-16].
Yağcı [17] presented a novel system based on ML models to predict students' final exam grades by considering their midterm exam grades as the source data. A Multi-Layer Perceptron Neural Network (MLPNN) was used by Hamadneh et al. [18] to predict students’ performance in blended learning and reduce academic failure rates. In the study [19], the authors aimed to predict a student's performance and provide support for academic guidance using a supervised ML.
Mostly, these studies demonstrated the strong correlation between different behavior factors and academic performance to offer guidance for teachers and enhance students’ academic achievements. But the manual extraction of attributes has difficulty while considering large-scale datasets. The quality and number of attributes directly influence the model training. They cannot completely define the temporal dependency of the time-series data of students. Also, a correlation among multi-source data needs to be further extracted. So, Li et al. [20] developed an end-to-end DNN model that automatically extracts attributes from students’ multi-source data to predict academic achievement. But they did not consider other factors such as the physiological factors of students to predict their academic achievements.
Hence, in this paper, the SADDL model is proposed by using diverse attributes of students, including physiological attributes (mental health and mood changes from the previous day), demographic attributes, and academic attributes. The main contributions of this study are the following:
The remaining article is prepared as follows: Section 2 presents the studies associated with the prediction of student learning achievement using ML models. Section 3 discusses the proposed algorithm and Section 4 shows its performance compared to the existing models. Section 5 concludes this study and suggests future enhancements.
One of the foremost essential problems in higher education is predicting students’ learning achievements. To tackle this problem, many scholars have employed educational data mining applications in decision-making and predicting learning performance. This section reviews the related works from the aspects of predicting students’ performance and early identification of students with high risk using ML and deep learning models.
2.1 Student performance prediction using ML and deep learning models
The studies based on ML and deep learning models typically formulate the academic performance prediction problem as a classification process, intended at predicting students’ performance. Several studies were developed for predicting students’ performance using different data sources and models. Some of them are the following:
Chui et al. [21] presented an Improved Conditional Generative Adversarial Network-based Deep Support Vector Machine (ICGAN-DSVM) system for predicting students' performance. But accuracy was less for large-scale datasets since the DSVM performed only well in a low-data volume scenario. Alshanqiti and Namoun [22] presented an intelligent hybrid model by combining cooperative filtering, fuzzy set rules, and Lasso linear regression methods to predict student academic grades and their influential factors. But the model's reliability was not guaranteed because a publicly available, limited dataset did not contain every possible factor that may influence student accomplishments.
Li et al. [23] designed a combined Density-Based Spatial Clustering of Applications with Noise (DBSCAN) and K-means models to find the correlation between students’ behavioral patterns and performance grades. But it was complex to apply this model to high-dimensional multisource behavior characteristics. Also, additional meaningful factors were needed to enhance the prediction performance.
Abdelkader et al. [24] presented the K-Nearest Neighbor (KNN) and SVM classifications to assess satisfaction levels with online learning for higher education students during COVID-19. But the KNN's performance was degraded due to the slow training and the SVM has a high degree of complexity. Saidani et al. [25] suggested Extreme Gradient Boosting (XGBoost), Category Boosting (CatBoost) and Light Gradient Boosted Machine (LightGBM) to predict students’ performance. But other relevant student characteristics, like socio-demographic features and grades achieved in registered courses, were needed to improve the prediction accuracy.
Bujang et al. [26] suggested a multiclass prediction framework to predict students’ performance grades using J48, KNN, Naive Bayes (NB), SVM, Linear Regression (LR) and Random Forest (RF). But it could be analyzed with an ensemble or deep learning models to evaluate the efficiency of the prediction framework. Li and Liu [27] presented DNN to extract informative features with corresponding weights in predicting students’ performance. But accuracy was not effective due to the use of less number of features. Hussain et al. [28] designed a regression model to predict the student’s academic performance utilizing deep learning. But it only considered the academic records of the students who had already completed their course, whereas other factors related to students’ behavior were essential to improve the accuracy.
Pu et al. [29] developed a graph convolutional network to predict students’ performance in the following semester according to their past final exam results. But the accuracy was very low because of the vague correlation in the graph or adjacency matrix, i.e., the correlation between relevant courses was poor. Poudyal et al. [30] developed a hybrid 2D CNN by integrating two distinct 2D CNN models to predict academic performance. But it did not analyze the influence of every attribute on the student’s performance. Also, the accuracy was less due to the small dataset. Yousafzai et al. [31] presented an attention-based bidirectional LSTM network to predict student performance from historical data. But it considered only significant features, whereas students’ demographic attributes, physiological factors, etc., may increase the prediction accuracy.
2.2 Early identification of at-risk student using ML and deep learning models
The student performance prediction can be also utilized to identify at-risk students, i.e., determine whether a student belongs to a low-performance group. It might be quite useful for early warning and feedback to be delivered to at-risk students before their final exam weeks. Many studies were developed for identifying at-risk students earlier with the aid of multiple data sources and models.
Chui et al. [32] developed a Reduced Training Vector-based SVM (RTV-SVM) to predict at-risk and marginal students. But accuracy was less and also needed to predict students’ performance. Sahlaoui et al. [33] applied ensemble methods such as extra trees and XGBoost with Shapley additive explanations to predict students' performance and identify at-risk students. But the performance could be enhanced by using datasets with more attributes.
Adnan et al. [34] presented a predictive framework based on RF, SVM, KNN, extra tree, AdaBoost, gradient boosting and Artificial Neural Network (ANN) to characterize students' learning behaviors, predict their performance scores and identify at-risk students. But additional textual attributes related to the student’s feedback were needed to increase prediction accuracy.
Zhao et al. [35] developed a framework called Augmented Education (AugmentED) to predict academic performance depending on the multisource and multi-feature behavior data of students. First, the characteristics defining dynamic changes in temporal life patterns were mined by the LSTM. Then, the RF, Gradient Boost Regression Tree (GBRT), KNN, SVM, and XGBoost were used to forecast academic performance. But it needs additional attributes about the student’s activities for effective prediction.
Nabil et al. [36] developed the DNN-based predictive model using the database gathered from an open 4-year university for students' learning achievement prediction in new subjects according to their grades in earlier subjects and at-risk students’ identification. But it could be integrated with more semester data to increase the model's efficiency. Yang et al. [37] presented the CNN to predict at-risk students by transforming students’ course involvements into images. But it did not consider more complex factors that impact the prediction accuracy.
The above-discussed works predict students’ learning achievements based on different ML and deep learning models. But they have considered only specific kinds of attributes, whereas additional attributes are needed to enhance the prediction performance. Also, the prediction efficiencies mostly depend on the number of attributes mined manually by skilled experts, which makes the ML models difficult to perform when using a large-scale dataset with various kinds of student attributes. On the other hand, deep learning models did not learn temporal dependency among various attributes. So, this study focuses on developing a novel deep learning algorithm to automatically extract temporal dependency and correlation attributes among different kinds of attributes from the large-scale dataset for students’ performance prediction.
This section explains the SADDL model for student performance prediction, which involves four major modules, as portrayed in Figure 1: data acquisition, pre-processing, feature extraction, and deploying a deep learner for prediction.
Figure 1. Block diagram of the proposed study
3.1 Data acquisition
In this study, the student records from the government and self-financed engineering colleges around Coimbatore, Tamil Nadu, are collected as a dataset. These records include academic and demographic attributes of the students who studied in the period from June 2022 to December 2022. The academic attributes include student number, course name, college category (i.e., government or self-financed), grades in each subject, study materials (i.e., lecture notes & book materials), way of teaching, the number of students in a course, an allowance of smartphones, etc. The demographic attributes are students’ name, age, sex, home place (i.e., rural, urban, or semi-urban), family category (i.e., nuclear or joint), career, academic skills of family aspirants, the guidance of parents for homework, the number of friends, time spent on watching TV, internet access at home, etc. This dataset contains 126 attributes (i.e., columns), 5000 instances (rows) and 1 class attribute (i.e., either distinction, pass, high-distinction, or fail). After obtaining this dataset, preprocessing is used to convert the textual/categorical data into numeric form using one-hot encoding. Using this dataset, the academic and demographic attributes of the students are directly extracted.
In addition to this dataset, the number of conversations and posts shared by the students about their academic experiences on Twitter, Facebook and Instagram are acquired as a students’ social media dataset. This dataset is preprocessed and used to extract the students’ physiological attributes, which are described in the following section.
3.2 Students’ physiological attribute extraction
3.2.1 Pre-processing
The post and conversation information in the students’ social media dataset is preprocessed using the following NLP techniques.
These preprocessing steps can reduce the total amount of information in the student’s social media dataset by removing redundant data. This preprocessed dataset is used to extract the students’ physiological attributes.
3.2.2 LDA feature extraction
LDA is the other feature extraction scheme utilized to create topic models by allocating a topic of each word after extracting it in a dataset. It is a probabilistic model that extracts latent topics from a group of documents. The major aim is that the student database is defined as an arbitrary combination of latent topics, which are represented by a distribution over words (e.g., physiological terms often used by the students). For a given dataset D containing M documents, with document d having Nd words (d∈1, …, M), the LDA models D based on the below generation procedure.
- Choose a topic Zn from ϕd;
- Select Wn from $\varphi_{Z_n}$;
According to this generation procedure, words in documents are only observed variables, whereas others are latent variables (φ, ϕ) and hyperparameters (α, β). To infer these variables, the probability of the observed data D is calculated and improved by
$P(D \mid \alpha, \beta)$$=\prod_{d=1}^M \int p\left(\phi_d \mid \alpha\right)\left(\prod_{n=1}^{N_d} \sum_{Z_{d n}} p\left(Z_{d n} \mid \phi_d\right) p\left(W_{d n} \mid Z_{d n}, \beta\right)\right) d \phi_d$ (1)
α parameters of the topic Dirichlet prior and the distribution of words over topics, which are obtained from the Dirichlet distribution and provided by β. Here, N denotes the size of vocabulary. The Dirichlet multinomial pair for dataset-level topic distributions (α, β) is taken. The Dirichlet multinomial pair for topic-word distributions is provided by β and φ. Variables ϕd are the document-level variables. Zdn and Wdn are the word-level variables, which are samples for all words in all documents.
Figure 2 illustrates an example of LDA-based physiological feature extraction. It is noted that the LDA provides the words in the topics with their distribution using Dirichlet distribution. A topic is defined as a weighted list of words (i.e., students’ physiological attributes). Thus, the LDA scheme is performed to extract the physiological attributes related to the student’s mental health and mood changes from the student social media database.
Figure 2. Example of LDA for students’ physiological feature extraction
3.3 SADDL model for prediction
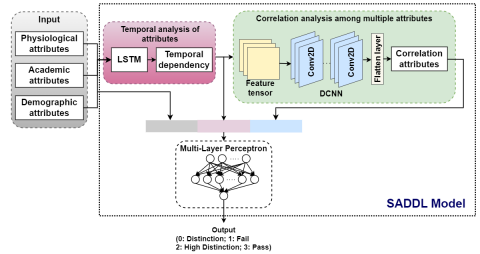
As illustrated in Figure 3, the SADDL-based prediction model comprises four major stages: (i) Input: different attributes of student physiological, academic, and demographic data are the input of the DDL model; (ii) Temporal analysis: the LSTM is applied to independently model each category of the attribute to learn their temporal dependency; (iii) Correlation analysis: a multidimensional DCNN is applied on the tensor converted from the temporal dependency of each data type to learn the correlation among multiple attributes; (iv) Output: the student’s physiological, academic, demographic, temporal, and correlation attributes are fused as the input of the MLP classifier for predicting learning achievements.
Figure 3. Structure of SADDL for student’s performance prediction
3.3.1 Input
This network model considers the different kinds of student information such as academic background, demographic data and physiological data. Each kind of student’s data is a time-series, i.e., all records have a timestamp, yet different students hold distinct attributes. Here, $X_i=\left(X_{i 1}, \ldots, X_{i j}, \ldots, X_{i N}\right)$ is the N categories of multi-source attributes of student i, $X_{i j}=\left[x_{i j}^1, \ldots, x_{i j}^t, \ldots, x_{i j}^{T_{i j}}\right]$ is the jth attribute of student $i, x_{i j}^t\left(1 \leq t \leq T_{i j}\right)$ is the vector defining single event record information at period t, including single consumption record, single gateway login record, where Tij is the length of the jth attribute of student i.
3.3.2 Temporal analysis of attributes using LSTM network
LSTM is a kind of recurrent network, which is used to process a sequence of values. It can efficiently diminish the complexity of extracting long-term dependencies from long-range sequences. To extract temporal dependency in each attribute from the students’ data, the LSTM is applied.
The LSTM network layer comprises the input gate, forget gate and output gate. The forget gate is used to calculate a degree of forgetting a feature preceded by the current LSTM unit as Eq. (2):
$f_t=\sigma\left(W_f \cdot\left[h_{t-1}, x_t\right]+b_f\right)$ (2)
In Eq. (2), Wf, bf are the weight vector and bias value of the forget layer, respectively. σ is the sigmoid activation function, xt is the input feature in the input gate, ft is the forget gate, and ht-1 is the result of a previous hidden state.
The input gate is used to determine how much present feature is contained in the image as Eqs. (3), and (4):
$i_t=\sigma\left(W_i \cdot\left[h_{t-1}, x_t\right]+b_i\right)$ (3)
$\tilde{C}_t=\tanh \left(W_C \cdot\left[h_{t-1}, x_t\right]+b_C\right)$ (4)
Here, Wi, Wc are the weight vector of the input gate and neuron condition vector, respectively. bi, bc are the bias values of the input gate and neuron condition vector, respectively. tanh is the hyperbolic tangent activation function, it, $\tilde{C}_t$ are the input gate, and the updated new cell state, respectively.
Once the features traverse via the input and forget gates, the LSTM fine-tunes their units to determine the outcome of the current LSTM unit and pass it to the consecutive LSTM unit as Eq. (5):
$C_t=f_t * C_{t-1}+i_t * \tilde{C}_t$ (5)
In Eq. (5), Ct is the current cell state, and Ct-1 is the old cell state. The output gate merges the present input and LSTM unit to compute the result of the present LSTM unit as:
$o_t=\sigma\left(W_o \cdot\left[h_{t-1}, x_t\right]+b_o\right)$ (6)
$h_t=o_t * \tanh \left(C_t\right)$ (7)
In Eqs. (6) and (7), ht represent the hidden state that serves as the solution of the block over t, ot is the output gate, Wo and bo are the weight vector and bias value of the output gate, respectively.
3.3.3 Correlation analysis of attributes using DCNN
Since multi-source performance information is from a similar student, a relationship among various attributes should exist. To learn the correlation among multiple attributes, a tensor approach is applied to convert the temporal dependency vector of every attribute into a 2D DCNN is adopted to extract the correlation among multiple attributes. This DCNN is utilized to mine image characteristics, where an image is defined by a tensor (ω,h,c), where ω, h and c denote the width, height and number of channels, respectively. As depicted in Figure 2, the temporal dependency vectors of N kinds of attributes are converted into a 2D tensor, where ω*h=N, c=M, M is the dimension of the temporal dependency vector. Based on the tensor, the 2D DCNN is performed.
3.3.4 Output or Multi-Layer Perceptron (MLP) classifier
In this study, the learning performance prediction is modeled as a categorization process, the network result is $y \in$$\{0:$ Distinction, 1: Fail, 2: High Distinction, 3: Pass $\}$, and the grading process can be performed as follows:
A student’s academic performance is typically measured by Grade Point Average (GPA) of continuous numerical values. This work defines the prediction of academic performance as the classification task, i.e., estimating whether the student’s performance is a distinction, fail, high distinction, or pass. So, the GPA is split into discrete academic grades. First, each student in the database is ranked based on the GPA in descending manner, then the top k% of students’ achievements such as 85-100% are defined as high distinction and the bottom k% of students’ achievements such as 0-49% are defined as failure. The other student’s achievements such as 75-84% are defined as distinction, and 50-64% are defined as pass.
The MLP classifier is trained by fusing the students’ academic, demographic, physiological, temporal, correlation and demographic attributes to provide the learning grade. In the MLP classifier (as shown in Figure 4), the input layer has n neurons representing the number of attributes. The second layer is the hidden layer, in which the number of neurons should be less than twice the size of the input layer. The Rectified Linear Unit (ReLU) activation function is used for both input and hidden layers. The final layer is the output layer, which comprises the softmax activation for final prediction.
Figure 4. Structure of MLP classifier
The Softmax (P(y,b)) is a probability of attributes belonging to a given grade y. It is determined by Eq. (8).
$P(y, b)=\frac{P(b, y) \times P(y)}{\sum_{N=1}^y(N) \times P(b, N)}$ (8)
In Eq. (8), P(y) is grade probability, y is the total number of grades. Eq. (8) is rewritten as Eq. (9):
softmax $=P(y, b)=\frac{e^{\beta^y[b]}}{\sum_{N=1}^y e^{\beta^N[b]}}$ (9)
Where $\beta^y[b]=\ln [P(b, y) \times P(y)]$ (10)
Figure 5 presents a flow chart of the SADDL model for students’ performance prediction, which helps to understand how the model works.
Figure 5. Flow chart of SADDL model for students’ performance prediction
3.3.5 Model configuration
Table 1 presents an entire configuration of the SADDL model. The initial layer denotes the input containing N kinds of attributes, where Ti and Fi are the data sequence length and attribute number of ith student. The second layer applies the LSTM on all kinds of attributes and provides a vector having 32 attributes. In the 3rd, 4th and 5th layers, the concatenation, reshape and permute layers are used to translate the temporal dependency of N types of attributes into a tensor of (ω,h,32). Because there are only some kinds of physiological behaviors, more 2D convolutional layers may tend to overfit; so, only 2 convolutional layers are configured in the 6th and 7th layers, with the kernel number of 32 and 64, respectively. The kernel sizes of (2,2) and the step sizes of (1,1), as well as, the 6th layer use filling mode to maintain the tensor size unchanged.
The tenth layer considers the students’ academic, demographic and physiological attributes as input. In the 11th layer, such attributes are concatenated with the temporal dependency and correlation attributes, where L7, L8 and L1 denote the lengths of the output vectors in the 7th, 8th and first layers, respectively. The concatenated attribute vector is given as input to the MLP classifier in the 12th layer, where 4 denotes the grades of academic performance and the activation function is softmax. The dropout layer is assigned before the MLP layer to prevent overfitting and the dropout rate is set to 0.5.
3.3.6 Handling class imbalance problem using weighted cross-entropy error
To handle class imbalance problems, under-sampling, over-sampling and weighted loss functions are available. On the other hand, under-sampling may reduce the number of samples, which degrades the efficiency of SADDL training and over-sampling is computationally inefficient for high-dimensional datasets. Compared to these schemes, the weighted loss function needs fewer computing resources to handle class imbalance problems. As a result, the weighted cross-entropy error is considered as the loss function in this paper. The weighted cross-entropy error is defined as follows:
loss $=\frac{1}{N} \sum_{k=1}^N \sum_{c=1}^M w_c y_c^k \log \left(p_c^k\right)$ (11)
Where $w_C=\frac{N}{M * N_C}$ (12)
In Eqs. (11) and (12), wc is the weight of label c, N indicates the total amount of student data instances, Nc denotes the amount of student data instances belonging to c, M denotes the amount of class labels, $y_c^k$ indicates the actual grade of kth data instances belonging to c, and $p_i^k$ defines the estimated grade probability.
3.3.7 Preventing overfitting issue
A huge gap between the number of model parameters and the number of student data made the SADDL model prone to overfitting. To prevent overfitting, this study applies early stipping and dropout during the model training. If the error value is less than 0.001 for 40 consecutive epochs, the training is terminated and the parameter setting of dropout is given in Table 1.
Table 1. Entire configuration of SADDL model
|
Layer |
Kernel Value |
Kernel Dimension |
Result Size |
Activation |
Linked Layer |
|
Input |
- |
- |
(Ti,Fi )*N |
- |
- |
|
LSTM |
- |
- |
(32,1)*N |
- |
1 |
|
Concatenate |
- |
- |
(32,N) |
- |
2 |
|
Reshape |
- |
- |
$\left(\begin{array}{c}32, \omega, h\end{array}\right)$ |
- |
3 |
|
Permute |
- |
- |
$\left(\begin{array}{c}\omega, h, 32\end{array}\right)$ |
- |
4 |
|
Conv2D |
32 |
$(2,2)$ |
$\left(\begin{array}{c}\omega, h, 32\end{array}\right)$ |
ReLU |
5 |
|
Conv2D |
64 |
$(2,2)$ |
(ω-1,h-1,64) |
ReLU |
6 |
|
Flatten |
- |
- |
((ω-1)*(h-1)*64) |
- |
4 |
|
Flatten |
- |
- |
(32*N) |
- |
8 |
|
Concatenate |
- |
- |
(L7+L8+L1) |
- |
1, 7, 8 |
|
Dropout (0.5) |
- |
- |
(L7+L8+L1) |
- |
9 |
|
MLP |
- |
- |
4 |
Softmax |
|
The effectiveness of the SADDL model is measured and evaluated with the existing ML models using the considered student dataset (discussed in Section 3.1) in MATLAB 2019b. For performance analysis, two different data split ratios are used:
(i) 4000 (i.e., 80%) data instances (1000 from each class) are used for training and 1000 (i.e., 20%) data instances (250 from each class) are used for testing.
(ii) 3500 (i.e., 70%) data instances (875 from each class) are used for training and 1500 (i.e., 30%) data instances (375 from each class) are used for testing.
The existing models considered for performance analysis are SVM [24], LightGBM [25], RF [26], DNN [27] and GBRT [35].
4.1 Parameter settings
Table 2 lists the parameters settings for proposed SADDL and existing models: SVM [24], LightGBM [25], RF [26], DNN [27] and GBRT [35] to compare the efficieny of academic performance prediction.
Table 2. Parameter settings for existing and proposed models
|
Models |
Parameters |
Range |
|
|
GBRT [22] |
Number of trees |
60 |
|
|
Learning rate |
0.1 |
||
|
Maximum tree depth |
6 |
||
|
Minimum Split gain |
0 |
||
|
Minimum Leaf weight |
2.5 |
||
|
Row sampling |
1.0 |
||
|
Column sampling |
1.0 |
||
|
RF [24] |
Number of trees in the forest |
50 |
|
|
Maximum tree depth |
8 |
||
|
DNN [26] |
Number of hidden layers |
3 |
|
|
Number of neurons at kth hidden layer |
32 |
||
|
Number of neurons at output layer |
4 |
||
|
Batch size |
65 |
||
|
Learning rate |
0.001 |
||
|
Activation function |
ReLU |
||
|
Optimizer |
Adam |
||
|
Number of epochs |
100 |
||
|
Loss function |
Cross-entropy |
||
|
Weight regularization |
0.001 |
||
|
SVM [27] |
Kernel type |
Linear |
|
|
Kernel degree |
2 |
||
|
Penalty |
0.1 |
||
|
Gamma |
0.01 |
||
|
LightGBM [29] |
Number of boosted trees to fit |
100 |
|
|
Minimum sum of instance weight |
4.1 |
||
|
Maximum tree depth |
10 |
||
|
Minimum loss reduction |
0.05 |
||
|
$L_1$ -regularization on weights |
2.5 |
||
|
$L_2$ -regularization on weights |
4.2 |
||
|
Learning rate |
0.02 |
||
|
Proposed SADDL |
LSTM |
Learning rate |
0.0001 |
|
Batch size |
64 |
||
|
Loss function |
Weighted cross-entropy |
||
|
Number of LSTM units |
12 |
||
|
Number of epochs |
120 |
||
|
Optimizer |
Adam |
||
|
Dropout |
0.1 |
||
|
DCNN |
Learning rate |
0.001 |
|
|
Dropout |
0.5 |
||
|
Weight decay |
0.0001 |
||
|
Momentum |
0.9 |
||
|
Batch size |
64 |
||
|
Number of epochs |
120 |
||
|
Activation function |
ReLU |
||
|
Loss function |
Weighted cross-entropy |
||
|
MLP |
Number of hidden layers |
1 |
|
|
Number of neurons in hidden layer |
20 |
||
|
Activation function |
Softmax |
||
|
Number of neurons in output layer |
4 |
||
|
Batch size |
25 |
||
|
Learning rate |
0.01 |
||
|
Maximum iteration |
100 |
||
|
Momentum |
0.9 |
||
|
Dropout |
0.5 |
||
|
Optimizer |
Adam |
||
4.2 Performance metrics
The accuracy, precision, recall and f-measure provide better insights into the prediction compared to the other metrics. It helps to understand the efficiency of prediction models when considering new unlabeled data. So, this study considers these metrics for performance analysis. The performance metrics used to evaluate the proposed and existing models are described below:
Accuracy$=\frac{\text { True Positive }(T P)+\text { True Negative }(T N)}{T P+T N+\text { False Positive }(F P)+\text { False Negative }(F N)}$ (13)
TP refers to the amount of positive data that are predicted as positive, TN refers to the amount of negative data that are predicted as negative, FP refers to the amount of negative data that are predicted as positive, and FN refers to the amount of positive data that are predicted as negative.
Precision $=\frac{T P}{T P+F P}$ (14)
Recall $=\frac{T P}{T P+F N}$ (15)
$F-$ measure $=2 \times \frac{\text { Precision } \cdot \text { Recall }}{\text { Precision }+ \text { Recall }}$ (16)
$R M S E=\sqrt{\sum\left(y_g-p_g\right)^2 / N}$ (17)
In Eq. (17), N is the total number of instances.
Table 3 demonstrates the confusion matrix of the SADDL for student academic performance prediction using 20% test dataset. It is a most well-known representation of the prediction model performance. It illustrates the number of correctly and incorrectly predicted grades, compared to the acutal outcomes (target result) in the test data. Using this matrix, TP, FP, FN and TN values for each class are measured, which are given in Table 4. So, Table 4 is used to calculate the accuracy, precision, recall and f-measure values of SADDL model using 20% test dataset.
Table 3. Confusion matrix for SADDL model using 80% training and 20% test dataset
|
Actual |
|||||
|
Predicted |
Class |
Distinction |
Fail |
High-distinction |
Pass |
|
Distinction |
229 |
7 |
6 |
8 |
|
|
Fail |
7 |
230 |
8 |
5 |
|
|
High-distinction |
6 |
7 |
229 |
8 |
|
|
Pass |
8 |
6 |
7 |
229 |
|
Table 4. Detailed statistics by each class for SADDL using 80% training and 20% test dataset
|
Class |
TP |
FP |
FN |
TN |
|
Distinction |
229 |
21 |
21 |
729 |
|
Fail |
230 |
20 |
20 |
730 |
|
High-distinction |
229 |
21 |
21 |
729 |
|
Pass |
229 |
21 |
21 |
729 |
Table 5 demonstrates the confusion matrix of the SADDL for student academic performance prediction using 30% test dataset. Using this matrix, TP, FP, FN and TN values for each class are measured, which are given in Table 6. So, Table 6 is used to calculate the accuracy, precision, recall and f-measure values of SADDL model using 30% test dataset.
Table 5. Confusion matrix for SADDL model using 70% training and 30% test dataset
|
Actual |
|||||
|
Predicted |
Class |
Distinction |
Fail |
High-distinction |
Pass |
|
Distinction |
333 |
12 |
15 |
15 |
|
|
Fail |
15 |
331 |
18 |
11 |
|
|
High-distinction |
15 |
15 |
336 |
9 |
|
|
Pass |
12 |
17 |
6 |
340 |
|
Table 6. Detailed statistics by each class for SADDL using 70% training and 30% test dataset
|
Class |
TP |
FP |
FN |
TN |
|
Distinction |
333 |
42 |
42 |
1083 |
|
Fail |
331 |
44 |
44 |
1081 |
|
High-distinction |
336 |
39 |
39 |
1086 |
|
Pass |
340 |
35 |
35 |
1090 |
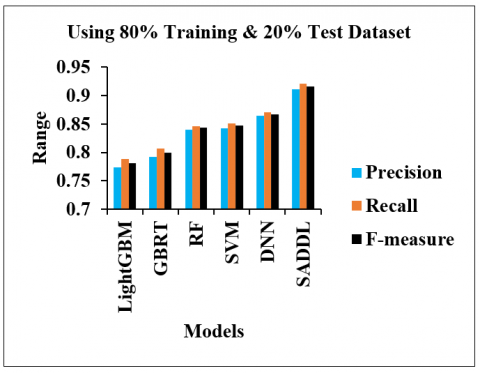
Figure 6. Analysis of precision, recall, and f-measure for different models using 80% training and 20% test dataset
Figure 6 plots the precision, recall, and f-measure of different students’ academic performance prediction models on the 80% training and 20% test dataset. It notices that the SADDL achieves greater precision, recall, and f-measure compared to the other ML models due to the use of various attributes, which are learned automatically and without difficulty. The SADDL increases the precision by 17.7%, 15%, 8.5%, 8.1%, and 5.3%, in contrast with the LightGBM, GBRT, RF, SVM, and DNN, respectively. The recall of the SADDL is maximized by 16.9%, 14.1%, 8.8%, 8.3%, and 5.9% compared to the LightGBM, GBRT, RF, SVM, and DNN models, respectively. Also, the SADDL enhances the f-measure values by 17.2%, 14.5%, 8.6%, 8.1%, and 5.6% compared to the LightGBM, GBRT, RF, SVM, and DNN, respectively.
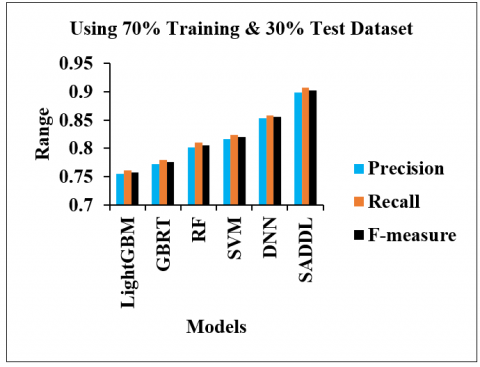
Figure 7. Analysis of precision, recall, and f-measure for different models using 70% training and 30% test dataset
Figure 7 illustrates the precision, recall, and f-measure of different students’ academic performance prediction models on the 70% training and 30% test dataset. The precision of the SADDL is increased by 19.1%, 16.45%, 12.18%, 10.17% and 5.36% compared to the LightGBM, GBRT, RF, SVM and DNN, respectively. The recall of the SADDL is increased up to 19.19%, 16.42%, 11.98%, 10.07% and 5.71% compared to the LightGBM, GBRT, RF, SVM and DNN models, respectively. The f-measure of the SADDL is enhanced by 19.15%, 16.43%, 12.08%, 10.12% and 5.53% compared to the LightGBM, GBRT, RF, SVM and DNN, respectively.
From Figures 6 and 7, it is observed that the prediction model achieves better performance while considering more training data, i.e., when using 80% training data, the SADDL can be trained efficiently and predicted the students’ performance with better accuracy, compared to the use of 70% data for training.
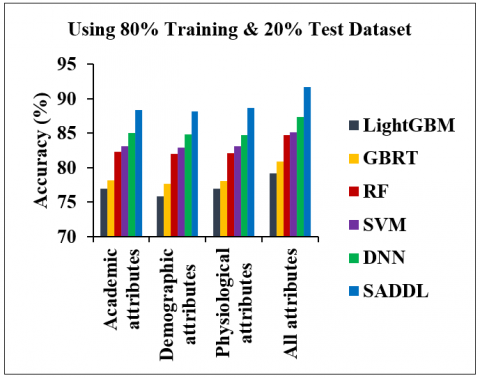
Figure 8. Comparison of accuracy for different prediction models based on the impact of each attribute category using the 80% training and 20% test dataset
In Figure 8, the impact of each category of attribute using the 80% training and 20% test dataset is drawn in terms of prediction accuracy. Even though each attribute contributes good accuracy in predicting students’ performance independently, they are not sufficient to satisfy the prediction efficiency. Because each attribute defines particular characteristics of students, e.g., academic attributes define the students’ learning behavior, demographic attributes define the students’ family background and personal behavior, whereas physiological attributes define the students’ mental health about academic activities. Usually, students’ academic performance depends on all these attributes. So, the proposed SADDL considered all attributes about students’ academic, demographic and physiological information for prediction process. It is noted that the SADDL effectively maximizes the accuracy of predicting student academic performance by considering all categories of attributes, compared to the use of each attribute separately in the previous ML models. On average, the SADDL using all attributes increases the accuracy by 15.9%, 13.4%, 8.2%, 7.7% and 5%, in contrast with the LightGBM, GBRT, RF, SVM and DNN models, respectively.
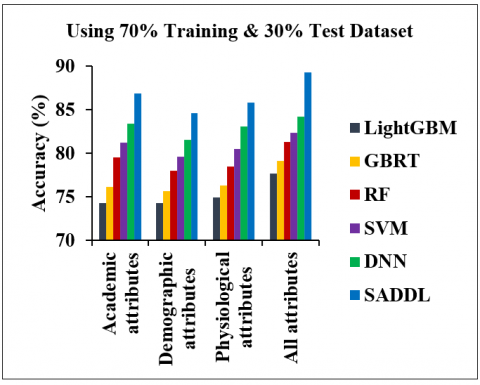
Figure 9 demonstrates the impact of each attribute category using the 70% training and 30% test dataset in terms of prediction accuracy. It is observed that the accuracy of the SADDL model on the combined attributes is increased by 15.02%, 12.92%, 9.8%, 8.45% and 6.06% compared to the LightGBM, GBRT, RF, SVM and DNN models, respectively. Thus, it is inferred that more training instances can train the model well for the prediction process compared to the less training instances.
Table 7 portrays the RMSE values obtained by the different models for predicting students' academic performance using all kinds of attributes. It is shown that the SADDL using 20% test dataset can decrease the RMSE by 36.99%, 34.07%, 26.35%, 25.36% and 18.52%, respectively, compared to the LightGBM, GBRT, RF, SVM and DNN models. Also, the RMSE of the SADDL using 30% test dataset is reduced by 28.61%, 25.97%, 22.88%, 14.14% and 10.55% compared to the LightGBM, GBRT, RF, SVM and DNN models, respectively. Thus, it is concluded that the SADDL enhances the prediction performance by using more training instances including all kinds of students’ attributes in contrast with the existing LightGBM, GBRT, RF, SVM and DNN models.
Figure 9. Comparison of accuracy for different prediction models based on the impact of each attribute category using the 70% training and 30% test dataset
Table 7. Comparison of RMSE
|
Training: 80% & Test: 20% |
|||
|
Models |
Observed Data |
Correctly Predicted Data |
RMSE |
|
LightGBM |
1000 |
791 |
0.4572 |
|
GBRT |
1000 |
809 |
0.4370 |
|
RF |
1000 |
847 |
0.3912 |
|
SVM |
1000 |
851 |
0.3860 |
|
DNN |
1000 |
875 |
0.3536 |
|
SADDL |
1000 |
917 |
0.2881 |
|
Training: 70% & Test: 30% |
|||
|
Models |
Observed Data |
Correctly Predicted Data |
RMSE |
|
LightGBM |
1500 |
1186 |
0.4575 |
|
GBRT |
1500 |
1208 |
0.4412 |
|
RF |
1500 |
1231 |
0.4235 |
|
SVM |
1500 |
1283 |
0.3804 |
|
DNN |
1500 |
1300 |
0.3651 |
|
SADDL |
1500 |
1340 |
0.3266 |
In this paper, the SADDL model was developed for students’ learning achievement prediction. This model considered the students’ physiological attributes extracted from their posts or interactions in social media using the Latent Dirichlet Allocation (LDA). Such attributes along with the student’s academic and demographic attributes were then learned by the SADDL model to efficiently predict the academic performance grades. At last, the experimental results proved that the SADDL on the students’ dataset has 91.71% accuracy while using 80% training and 20% test dataset, whereas it has 89.3% accuracy when using 70% training and 30% test dataset having all attributes rather than individual attributes compared to the LightGBM, GBRT, RF, SVM and DNN models.
Thus, this model can be helpful for teachers to early predict at-risk students in specific courses and provide proper guidance to reduce academic failure rates. On the other hand, the dataset was limited. Also, the dataset acquisition was time-consuming, labor-intensive and expensive. To improve the performance of SADDL, a large-scale dataset is essential. So, future work will focus on developing a deep generative network model to augment the number of students’ data without complexity and increase the academic performance prediction accuracy.
[1] Sörberg Wallin, A., Zeebari, Z., Lager, A., Gunnell, D., Allebeck, P., Falkstedt, D. (2018). Suicide attempt predicted by academic performance and childhood IQ: A cohort study of 26000 children. Acta Psychiatrica Scandinavica, 137(4): 277-286. https://doi.org/10.1111/acps.12817
[2] Albulescu, I., Labar, A.V., Manea, A.D., Stan, C. (2023). The mediating role of anxiety between parenting styles and academic performance among primary school students in the context of sustainable education. Sustainability, 15(2): 1539. https://doi.org/10.3390/su15021539
[3] Al-Maskari, A., Al-Riyami, T., Kunjumuhammed, S.K. (2022). Students academic and social concerns during COVID-19 pandemic. Education and Information Technologies, 27: 1-21. https://doi.org/10.1007/s10639-021-10592-2
[4] Mofatteh, M. (2021). Risk factors associated with stress, anxiety, and depression among university undergraduate students. AIMS Public Health, 8(1): 36-65. https://doi.org/10.3934/publichealth.2021004
[5] Sharif, S., Guirguis, A., Fergus, S., Schifano, F. (2021). The use and impact of cognitive enhancers among university students: A systematic review. Brain Sciences, 11(3): 355. https://doi.org/10.3390/brainsci11030355
[6] Mahoney, J.L., Weissberg, R.P., Greenberg, M.T., Dusenbury, L., Jagers, R.J., Niemi, K., Yoder, N. (2021). Systemic social and emotional learning: promoting educational success for all preschool to high school students. American Psychologist, 76(7): 1128. http://dx.doi.org/10.1037/amp0000701
[7] Ramsdal, G.H., Wynn, R. (2022). Theoretical basis for a group intervention aimed at preventing high school dropout: the case of ‘Guttas Campus’. International Journal of Environmental Research and Public Health, 19(24): 17025. https://doi.org/10.3390/ijerph192417025
[8] Rodrigues, L.S., dos Santos, M., Costa, I., Moreira, M.A.L. (2022). Student performance prediction on primary and secondary schools – a systematic literature review. Procedia Computer Science, 214: 680-687. https://doi.org/10.1016/j.procs.2022.11.229
[9] Yan, Z., Wang, X., Boud, D., Lao, H. (2023). The effect of self-assessment on academic performance and the role of explicitness: a meta-analysis. Assessment & Evaluation in Higher Education, 48(1): 1-15. https://doi.org/10.1080/02602938.2021.2012644
[10] Sobaih, A.E.E., Hasanein, A., Elshaer, I.A. (2022). Higher education in and after COVID-19: the impact of using social network applications for e-learning on students’ academic performance. Sustainability, 14(9): 5195. https://doi.org/10.3390/su14095195
[11] Baashar, Y., Hamed, Y., Alkawsi, G., Capretz, L.F., Alhussian, H., Alwadain, A., Al-amri, R. (2022). Evaluation of postgraduate academic performance using artificial intelligence models. Alexandria Engineering Journal, 61(12): 9867-9878. https://doi.org/10.1016/j.aej.2022.03.021
[12] Pek, R.Z., Özyer, S.T., Elhage, T., ÖZYER, T., Alhajj, R. (2022). The role of machine learning in identifying students at-risk and minimizing failure. IEEE Access, 11: 1224-1243. https://doi.org/10.1109/ACCESS.2022.3232984
[13] Alhothali, A., Albsisi, M., Assalahi, H., Aldosemani, T. (2022). Predicting student outcomes in online courses using machine learning techniques: A review. Sustainability, 14(10): 6199. https://doi.org/10.3390/su14106199
[14] Çakıt, E., Dağdeviren, M. (2022). Predicting the percentage of student placement: a comparative study of machine learning algorithms. Education and Information Technologies, 27(1): 997-1022. https://doi.org/10.1007/s10639-021-10655-4
[15] Pilotti, M.A.E., Nazeeruddin, E., Nazeeruddin, M., Daqqa, I., Abdelsalam, H., Abdullah, M. (2022). Is initial performance in a course informative? Machine learning algorithms as aids for the early detection of at-risk students. Electronics, 11(13): 2057. https://doi.org/10.3390/electronics11132057
[16] Fahd, K., Venkatraman, S., Miah, S.J., Ahmed, K. (2022). Application of machine learning in higher education to assess student academic performance, at-risk, and attrition: a meta-analysis of literature. Education and Information Technologies, 27(3): 3743-3775. https://doi.org/10.1007/s10639-021-10741-7
[17] Yağcı, M. (2022). Educational data mining: prediction of students' academic performance using machine learning algorithms. Smart Learning Environments, 9(1): 11. https://doi.org/10.1186/s40561-022-00192-z
[18] Hamadneh, N.N., Atawneh, S., Khan, W.A., Almejalli, K.A., Alhomoud, A. (2022). Using artificial intelligence to predict students’ academic performance in blended learning. Sustainability, 14(18): 11642. https://doi.org/10.3390/su141811642
[19] El Mrabet, H., Ait Moussa, A. (2022). A framework for predicting academic orientation using supervised machine learning. Journal of Ambient Intelligence and Humanized Computing, 1-11. https://doi.org/10.1007/s12652-022-03909-7
[20] Li, X.Y., Zhang, Y., Cheng, H.M., Li, M.R., Yin, B.C. (2022). Student achievement prediction using deep neural network from multi-source campus data. Complex & Intelligent Systems, 8(6): 5143-5156. https://doi.org/10.1007/s40747-022-00731-8
[21] Chui, K.T., Liu, R.W., Zhao, M., De Pablos, P.O. (2020). Predicting students’ performance with school and family tutoring using generative adversarial network-based deep support vector machine. IEEE Access, 8: 86745-86752. https://doi.org/10.1109/ACCESS.2020.2992869
[22] Alshanqiti, A., Namoun, A. (2020). Predicting student performance and its influential factors using hybrid regression and multi-label classification. IEEE Access, 8: 203827-203844. https://doi.org/10.1109/ACCESS.2020.3036572
[23] Li, X.Y., Zhang, Y., Cheng, H.M., Zhou, F.F., Yin, B.C. (2021). An unsupervised ensemble clustering approach for the analysis of student behavioral patterns. IEEE Access, 9: 7076-7091. https://doi.org/10.1109/ACCESS.2021.3049157
[24] Abdelkader, H.E., Gad, A.G., Abohany, A.A., Sorour, S.E. (2022). An efficient data mining technique for assessing satisfaction level with online learning for higher education students during the COVID-19. IEEE Access, 10: 6286-6303. https://doi.org/10.1109/ACCESS.2022.3143035
[25] Saidani, O., Menzli, L.J., Ksibi, A., Alturki, N., Alluhaidan, A.S. (2022). Predicting student employability through the internship context using gradient boosting models. IEEE Access, 10: 46472-46489. https://doi.org/10.1109/ACCESS.2022.3170421
[26] Bujang, S.D.A., Selamat, A., Ibrahim, R., Krejcar, O., Herrera-Viedma, E., Fujita, H., Ghani, N.A.M. (2021). Multiclass prediction model for student grade prediction using machine learning. IEEE Access, 9: 95608-95621. https://doi.org/10.1109/ACCESS.2021.3093563
[27] Li, S.P., Liu, T.T. (2021). Performance prediction for higher education students using deep learning. Complexity, 2021: 1-10. https://doi.org/10.1155/2021/9958203
[28] Hussain, S., Gaftandzhieva, S., Maniruzzaman, M., Doneva, R., Muhsin, Z.F. (2021). Regression analysis of student academic performance using deep learning. Education and Information Technologies, 26: 783-798. https://doi.org/10.1007/s10639-020-10241-0
[29] Pu, H.T., Fan, M.Q., Zhang, H.B., You, B.Z., Lin, J.J., Liu, C.F., Zhao, Y.Z., Song, R. (2021). Predicting academic performance of students in Chinese-foreign cooperation in running schools with graph convolutional network. Neural Computing and Applications, 33: 637-645. https://doi.org/10.1007/s00521-020-05045-9
[30] Poudyal, S., Mohammadi-Aragh, M.J., Ball, J.E. (2022). Prediction of student academic performance using a hybrid 2D CNN model. Electronics, 11(7): 1005. https://doi.org/10.3390/electronics11071005
[31] Yousafzai, B.K., Khan, S.A., Rahman, T., Khan, I., Ullah, I., Ur Rehman, A., Baz, M., Hamam, H., Cheikhrouhou, O. (2021). Student-performulator: student academic performance using hybrid deep neural network. Sustainability, 13(17): 9775. https://doi.org/10.3390/su13179775
[32] Chui, K.T., Fung, D.C.L., Lytras, M.D., Lam, T.M. (2020). Predicting at-risk university students in a virtual learning environment via a machine learning algorithm. Computers in Human Behavior, 107: 105584. https://doi.org/10.1016/j.chb.2018.06.032
[33] Sahlaoui, H., Nayyar, A., Agoujil, S., Jaber, M.M. (2021). Predicting and interpreting student performance using ensemble models and Shapley additive explanations. IEEE Access, 9: 152688-152703. https://doi.org/10.1109/ACCESS.2021.3124270
[34] Adnan, M., Habib, A., Ashraf, J., Mussadiq, S., Raza, A.A., Abid, M., Khan, S.U. (2021). Predicting at-risk students at different percentages of course length for early intervention using machine learning models. IEEE Access, 9: 7519-7539. https://doi.org/10.1109/ACCESS.2021.3049446
[35] Zhao, L., Chen, K., Song, J., Zhu, X.L., Sun, J.W., Caulfield, B., Mac Namee, B. (2020). Academic performance prediction based on multisource, multifeature behavioral data. IEEE Access, 9: 5453-5465. https://doi.org/10.1109/ACCESS.2020.3002791
[36] Nabil, A., Seyam, M., Abou-Elfetouh, A. (2021). Prediction of students’ academic performance based on courses’ grades using deep neural networks. IEEE Access, 9: 140731-140746. https://doi.org/10.1109/ACCESS.2021.3119596
[37] Yang, Z.K., Yang, J., Rice, K., Hung, J.L., Du, X. (2020). Using convolutional neural network to recognize learning images for early warning of at-risk students. IEEE Transactions on Learning Technologies, 13(3): 617-630. https://doi.org/10.1109/TLT.2020.2988253