Pallavi Malavath*![]() | Nagaraju Devarakonda
| Nagaraju Devarakonda![]()
© 2023 IIETA. This article is published by IIETA and is licensed under the CC BY 4.0 license (http://creativecommons.org/licenses/by/4.0/).
OPEN ACCESS
The human body's temporal fluctuation is referred to as human activity. The preservation of cultural heritage, the development of video recommendation systems, the support of learners via tutoring systems will benefit from the capture and evaluation of dance-related multimedia content. Because of its detailed hand gesture, Indian classical dance (ICD) classification is still an enthralling field of study. This provides a framework for analyzing various computer vision and deep learning ideas. Automated teaching solutions across all disciplines, from traditional to online forums, become unavoidable through changes in learning habits. ICD also becomes a crucial component of a thriving culture and heritage that must be updated and preserved at all costs. The dance involves complex positions like self-hands-occlusion and full-body rotation. The main objective of this study is, in the Bharatanatyam dancing style we proposed a framework for categorizing hasta mudras. Our Convolution Neural Network - Long Short Term Memory (CNN-LSTM) deep knowledge architecture for Indian Classical Dancing (ICD) categorization now includes a new hand posture signature. By guessing where people's hands would be, we rated dance performances. This architecture assesses hand poses using information and information pruning, while a dance instructor application assesses the time and accuracy of student dances. 252 YouTube videos of the Bharatanatyam dance form has been used to make up the dataset used in our research.This study offers a methodology with three-phase deep learning techniques. Then, using the pre-trained paradigm TensorFlow EfficientNet –UNet, which aids us in determining any hand position within the frame, we extracted the appropriate joint locations of the hands from each video frame. Then, cosine similarity was used to identify or correlate the indicated action factors. Finally, using key details from the hand pose, we categorized it and trained the Convolution Neural Network - Long Short Term Memory (CNN-LSTM) network structure using the classification system's training dataset. Regarding factors like accuracy, F1-score, AUC curve, recall and precision, the proposed CNN-LSTM structure for classifying hand mudras is compared with Convolutional LSTM Long Term Recurrent Convolutional Network(LRCN), Multilayer Perceptron (MLP), LSTM and 3D Convolutional Layer (CONV3D). As a result, it was found that throughout the examination process, the proposed CNN-LSTM classification structure achieved 98.53% accuracy, 99.04% precision, 98.49% recall, 99.12% AUC score, and 98.74% F1-score. This achieves 94.03% accuracy, 93.13% precision, 94.76% recall, 96.06% AUC score, and 93.53% F1-score during the training method.
deep learning, hand pose estimation, Indian classical dance, video classification, convolutional LSTM, multilayer perceptron, accuracy, recall
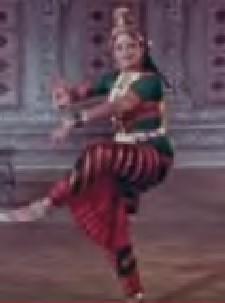
Indian classical dance has been practiced and performed all over the world for more than 5000 years. But only the expert can fully comprehend the explication of the dancing movements and hand gestures, in addition of sophisticated steps accompanied by music and poetry recitation. According to "Natya Shastra – Indian Classical Dance Form”, these traditional dance styles are known as "Natya Rasa." There are 108 karanas (gestures), which refer to actions of the hands, feet, and body, according to Natya Shastra [1]. These hand gestures represent a variety of bodily associations with god, nature, and behaviours. In Figure 1, a few hasta mudras [2] are displayed. The postures of the well-known classical dance style Bharatnatyam have been maintained in the Chidambaram temple located in Tamil Nadu, which is where temples from ancient and mediaeval India show sculptures with detailed details of beautiful dance postures. The Natya Shastra is the most well-known and thorough treatise on dance, theatre, and music performance. It contains precise instructions detailing the language and principles related to classical dance, music, and almost every facet of drama, and is usually thought to be 2000 years old.
The fundamental principles described in Natya Shastra have been interpreted differently over time by numerous artists from various art and dance schools. However, the original Natya Shastra, which is preserved at the Chidambaram temple [1] and was built about the 12th century A.D., has a set of 108 dancing positions known as Karanas (gestures). Even now, Bharatnatyam dancers still portray these stances, as seen in Figure 1.
Figure 2(a) depicts a dancer striking the Nataraj posture, while Figure 2(b) depicts the matching sculpture (b). Vartita Karana from the Bharatnatyam dance style is shown being performed by a performer in Figure 2(c). The same Karana from Figure 2 is depicted in a sculpture on the walls of a 25th-century temple (c). The litany of a poem or song performed by music goes together with the dancer's use of body positions and different hand gestures to express semantic meaning.
Figure 1. Asamyuktha Hasta Mudras (Single Hand Gestures) and Samyuktha Hasta Mudras (Double Hand Gestures)
(a)
(b)
(c)
(d)
Figure 2. (a) The posture of Nataraj [1]; (b) A sculpture delineating Nataraj pose; (c) The vartita Karana [1]; (d) A sculpture portraying the same Karana
In addition to observing hand position, it is important to read hasta mudras to understand the denotation of the different dance forms. The Natya Shastra mentions 28 Asamyukta (Single hand gestures) Hasta Mudras: Tripathaka, Kartarimukha, Pataaka, Ardhapataka, Mayuram, Araalam, Ardhachandram, Mushti, Shukatunda, Kapitta, Shikara, Suchi, Padmakosha, Chadrakala, Sarpashika, Mrigashirsha, Kangula, Simhamukha, Chatura, Alapadma, Bhramara, Hansapakshika, Hamsasye, Mukula, Sandamsha, Trishula, Tamrachuda.
Moreover, four new hasta mudras( Hand Gestures—Kataka, Vyagraha, Ardhasuchi, and Palli—were added to this collection over time. Samyuktha Hasta mudras (Double Hand Gestures) in contrast to these one-handed gestures, call for the employment of 60 both hands to communicate a message or specific sense. There are 24 (Samyuktha Hasta Mudras) double hand gestures recorded in the Natya Shastra: Karkata, Kapota, Anjali, Swastika, Utsanga, Piushpaputa, Shivalinga, Kartariswastika, Kataka-vardhana, Shakata, Pasha, Shankha,Chakra, Kilaka, Samputa, Kiurma, Matsya, Varaha, Nagabandha, Garuda, Khatava, Avhitta, Bhairunda. The dancer employs both single and 65 double hand movements to illustrate the significance of the poem or song that is being performed. Bailey and co-authors' study [4] looks at how studies on dance is impacted by recently established e-Science technologies. The study focuses on the outcomes of the e-Dance project, a two-year interdisciplinary research initiative that explores the integration of choreography, advanced video conferencing, and human-computer interaction analysis through the use of hypermedia and non-linear annotations for recording and documentation [3, 4]. Deep learning has recently become a potent paradigm for challenging (machine learning) ML tasks including handwritten character recognition object/image recognition, etc. We are directed to adopt (deep learning) DL algorithms because they are excellent at extracting the relevant details from images for categorization.
The earlier methods fit the deep figure using a flexible hand model, which is computationally difficult but allows the intermediate frame to be used as the initial value for the subsequent frame. However, multiple frames should be taken into account at once because the inaccuracy will increase over time. Due to the variety of appearances generated by posture changes and movements, including occlusion, illumination, and other factors, estimating hand position directions is particularly challenging in reality. To deal with these problems, multiple approaches have been developed over time. The hand gestures continue to differ from our typical daily tasks. For computer vision researchers, automatic pose estimation. It can be challenging to identify spatial patterns of specific hand postures in movies. The advent of diverse algorithms that may explore through video clips for certain human emotions of yearning was spurred by an increase in internet streaming video over the previous ten years. The difficulty still resides in extracting a hand posture, recognizing it, and annotating it with a trained CNN feature map. The study's objective is to eliminates hand posture feature maps from both online and offline sources that are seen in traditional Indian dance. Constraints include things like video quality, frame rate, background lighting, scene change speed, and blurring. Since many users upload videos of poor quality, which highlight all of the restrictions as a barrier to the computerization of video categorization and segmentation, the evaluation of online content continues to be a complex procedure. Hence, it is difficult to easily extract human hand dance characteristics from the dance video chain online due to a number of constraints. Automatic dance movement extraction still requires complex poses and actions to be done at various speeds while coordinating music and vocal sounds, making it difficult to comprehend. The hand mudra prediction paradigm uses an approach developed by dance professionals, which starts with the dancer's hand pose sequence, combines joint replacement sub-sequences with dance motions, and then predicts the hand gesture from the sequences of joint "movements". The following list of factors illustrates the significance of CNN-LSTM: As the size of the picture datasets grows, this demands a deeper and larger CNN-LSTM. Also, there hasn't been much research done on deep CNN-LSTM classification of hand mudras. It is appropriate for providing answers to difficult situations involving a large amount of data.
The key contribution of the proposed method is follows:
·The first step was to collect several classical dancing videos from YouTube, after which the proper pre-processing procedures, such resizing and scaling were used.
·To evaluate the hand gesture using cosine similarity to compare it to student and dancer poses, the Tensorflow EfficientNet-Unet Architecture was developed.
·In the feature extraction segment, EfficientNet-UNet salient features are simultaneously extracted.
·Finally, CNN-LSTM is utilized to estimate the hand gestures.
·Use any real-time dancing video to detect the position and classify the hand mudras using the suggested approach.
·Comparing the outcomes of the proposed technique with results obtained using the most recent technology.
The other sections of the study are organized as follows: Segment 2 examines some current research investigations, Segment 3 illustrates the proposed technique and methodologies, Segment 4 displays the results of the experiment and discussion, and Segment 5 come to an end with the conclusion and future research.
A key zone in the discipline of computer vision during the last two decades has been the detection of human action from video. This topic has already been studied by other researchers. However, a dynamical key point extractor is required for the detection of human action. For difficult applications of machine learning (ML), like image/object identification, deep learning has recently shown to be an effective strategy [5, 6]. The living legacy of Indian classical dance is being preserved through a multimedia DB retrieval system, according to the study [7]. They do not, however, discern body stances or hand gestures to explicationally comprehend the specific dance, in contrast to our study. A sparse representation based dictionary learning strategy is suggested in the study [8] for the classifying ICD. Folk dance classification is attempted in teh study [9]. A dataset from Greek traditional dance was used to test the bag of words strategy for activity recognition [10]. Only a few significant papers address the problem of body posture recognition in ICD, however there is a significant amount of study on general pose recognition of individuals. The initial 2D pose estimation methods for images and movies can be found in the study [11, 12]. Based on the framework for pictorial structures, Andriluka et al. [13] provide a general method for human detection and pose estimation. According to the study [14], visual words should be learned adversarially for 3D human pose assessment. A approach for detecting and identifying the hand region was proposed by Pisharady et al. [15] and uses a Bayesian model of visual attention to produce a outstanding map. A recent attempt at hand gesture detection using CNNs can be found in the study [15]. We categorize seven different grip types using a straightforward five-layer CNN as suggested in the study [16]. Nevertheless, neither [15] nor dropout [17] utilize transfer learning. With no prior knowledge of the hand istance, the method [18] simultaneously manages initialization, tracking, and recovery of hand motion. Hariharan et al. [19] suggest a scale, translation, and rotation-invariant method for identifying different single hand movements made by a dancer. The issue of measuring the dancer's position, however, is not addressed in the study. By using an image dataset of hand mudras from several traditional dance formats, the authors [20] provide another initiative grant specifically for recognizing traditional dances and various hasta mudras. The histogram of oriented (HOG) attributes are used as the input for the Support Vector Machine (SVM) classifier. Moreover, transfer learning using various CNN frameworks is best used to address various categorization issue statements. Using gathered videos and photographs, the authors [21] created a bottom-up method for multi-person posture detection, simultaneously refining part affinity fields and part detection during the training stage. The Mobilenet architecture is used to build this model, which makes run-time analysis easier.
A procedure for calculating 3Dimensional hand poses was proposed by Malavath et al. [22]. By using this method, the uncertainty brought on by insufficient depth information in images is removed. This network offers a 3D hand pose estimate by identifying critical hand points. Bandaragoda et al. [23] put out an event-driven computer behavioural model to comprehend various traffic-related behaviours. The suggested approach [24] uses travel trajectory analysis and traffic flow profiling to identify various commuter behavioural profiles as well as fluctuating and regular patterns. for multi-scene video processing makes use of the expanding self-organization map's divisive hierarchical clustering capacity utilizing a two-step top-down hierarchical technique. A U-shaped fully convolutional network design was presented by Olaf Ronneberger et al. [25] in which features maps from various encoder layers and decoder layers were upsampled and concatenated. By comparing the best approaches, it was determined that the little variations in posture for a given dance style, which are trivially described by hand gestures ( hand mudras), make the competition over hand pose evaluation in Indian classical dance styles more obvious. Moreover, the background noise present in the input frames hinders the process of feature extraction and classification. The proposed study's focuses on the outcomes of the collaborative e-Dance project, which investigates the fusion of choreography, modern video conferencing, and human-computer interaction study. The fact that paradigm-based techniques are expensive in terms of computational expenses is another important problem. The proposed TensorFlow EfficientNet-Unet based hand position evaluation with (CNN-LSTM)-based classification is used as a result to surpass this.
The recommended (CNN-LSTM) Convolutional Neural Network-Long-Short Term Memory Network for classification of hand gesture assessment is shown in detail in Figure 3. Images of Bharatanatyam dance performed by a teacher and student are used from YouTube videos for the given shloka (poem). Initially image should be pre-processed using the conventional scalar methodology after the input dataset has first been learned. Pre-processing involves rescaling the image, first extracting the noise, and then clearing the image. By constructing the Tensorflow EfficientNet-UNet framework, this noise-extracted image is given to the hand mudra pose evaluation mode with a feature extraction segment. In contrast, key points are extracted using a similarity index methodology. Finally, using the classification system's training dataset, we trained the CNN-LSTM framework. The proposed system's training accuracy and loss are noted for each epoch. A few evaluation criteria, including the, accuracy, confusion matrix, recall, precision, f1-score, AUC curve, and of the suggested system, are used to determine the execution.
3.1 Dataset explanation
The mudra estimation approach uses a number of preprocessing procedures, such as data preprocessing, data augmentation, feature extraction, estimation, and classification modules, to achieve robustness. The acquired dataset's raw data is first preprocessed. The exact position of the bharatanatyam images are cut from the ground truth image and entered into the pose estimate network. Each input preprocessed image is then enhanced. The data is increased for each input image by rotating the original image at various angles.252 YouTube videos of the Bharatanatyam dance form has been used to make up the dataset used in our research. This was done to ensure that the dance films would still be visible and effective with little background activity. There are a total of 25 video clips with a 400A-U350 maximum resolution and a 25 s maximum runtime. With the YouTube dance class video as a reference, we enhanced the content. Our device also chopped video segments into five to six second chunks of the casing while dispensing information, yielding a maximum of 150 frames. The ratio of 7:3 was selected as the train to examine for assessment. The result dataset presented numerous challenges, including variations in lighting, dancers shading on the dais, uniform dance positions, etc. This dataset is made more difficult by the fragmentary hand portions missing in a few sequences and the less accurate skeletal cooperative synchronizing. 252 videos altogether were considered for the experiment.
Figure 3. Flow chart of proposed system
3.2 Information pre-processing using common scalar techniques
Contemplate that for every input image 1<I<I, an input image of specific format {wi, yi, Xi} is not-ed in which ‘yi’ denotes the scalar outcome, wi denotes the scalar covariates vectorization, and Xi de-notes the image predictor calculated upon a network. The definition of the scalar-on-image degrada-tion paradigm is:
$v i=w i T \Omega+X_I \beta+\mu i$ (1)
where, Ω denotes the fixed vector, and β denotes a collection regarding regression coefficients that are delineated using the same trellis as an image forecaster, Xi.β symbolizes the dot product of β and Xi. We seek to evaluate the coefficient input image β taking into account that:
a) Indicator is scarce and divided into spatially continuous zones.
b) In non-zero regions, the indication remains smooth.
As a result, we also gave a picture of the dormant binary indicator, which categorizes position of images as neither predict nor non-predict. By considering l and l in terms of notation as the image position of the images l and l, respectively, and l and l as the images l and l having the l th position extracted. Con-sider l as the locale of all image positions that share a face with position l but have no corner; l can comprise up to 4 components on a typical lattice in dimensions. XTl=[X1, l, ..., XI, l] is obtained by considering Xl as a length I vector of picture values at position l beyond subjects. Similarly, think of X(l) as the collection of photos with the lth place removed. We assume that images have been deteriorated if the mean of each XTl stays 0. By taking into account X as the length I vector, we can see that it consists of the dot product of each image predictor Xi along with: (X) T =[X1, ..., XI]. Finally, we define ‘w’ as the matrix with equivalent rows to wiT. With the noise and redundancy removed, the in-formation is now available for feature extraction.
3.3 Similarity index methodology for feature extraction
The methodology of similarity index for feature extraction is a technique employed to evaluate the similarity or dissimilarity between data points or samples within a dataset. Its objective is to capture the fundamental characteristics or features of the data by quantifying the associations among individual samples. Depending on the characteristics of the data and the specific problem at hand, several similarity index measures can be utilized for feature extraction. Cosine Similarity method has been used in this proposed approach.
Cosine similarity is a metric that measures the cosine of the angle between two non-zero vectors. It is commonly applied in the comparison of documents or text data. Unlike magnitude, cosine similarity primarily focuses on the orientation of the vectors. Cosine similarity is predominantly employed in vector comparisons, making it less directly applicable to images. However, there are strategies to leverage cosine similarity in image analysis by converting images into vector representations.
A popular approach involves utilizing image embedding’s or deep learning models like convolutional neural networks (CNNs) to extract significant image features. CNNs excel at capturing hierarchical representations of image content, producing vector embedding’s that can be compared using cosine similarity.Here is a general procedure for applying cosine similarity to images:
(1) Image preprocessing: Begin by resizing the images to a consistent size and implementing any required preprocessing steps, such as normalization or cropping.
(2) Extracting image features: Utilize a pre-trained CNN (EffiecientNet-UNet in this study) model to extract features from the images. The CNN will convert each image into a high-dimensional vector representation.
(3) Compute cosine similarity: Calculate the cosine similarity between the vector representations of the images using the previously mentioned formula.
By comparing the cosine similarities among various image vectors, tasks such as image retrieval, image clustering, or content-based image recommendation can be performed. Cosine similarity aids in identifying similar image content based on their vector representations, facilitating effective image analysis and retrieval.
The architecture of encoder and decoder will be briefly discussed in this part, including EfficientNet, which serves as the encoder's feature extractor while UNet, serves as the decoder.
4.1 Encoder-Decoder building design
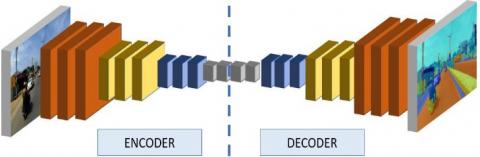
For semantic segmentation, Figure 4 shows a simple encoder-decoder network.
Figure 4. Framework of Encoder-Decoder type semantic segmentation framework based on CNN
In the encoder-decoder module, the initial step involves using a CNN-based encoder to extract image features. In order to capture intricate details within the image, the module gradually decreases the image size while also reducing the resolution of the feature map. Modern CNN’s like MobileNet, ResNet, Inception and ResNetV2 etc. are used for this. To produce the final feature map, these CNN architectures often gradually decrease the resolution of the image. Generating a segmentation map for a larger original input image from a smaller feature map is a difficult task. To overcome this challenge, the decoder module is designed with several layers that can up sample the encoder's feature map and retrieve spatial information.
4.2 Tensorflow EfficientNet-UNet framework
Figure 5. The EfficientNetB7 architecture employs MBConv as its fundamental building blocks. MBConv, short for mobile inverted bottleneck convolution, is used to create each block of the network. The filter size and activation function used in each MBConvX block are shown, where X can be either 1 or 6, representing the standard ReLU and ReLU6 activation functions, correspondingly
CNN architectures are developed based on the available resources and scaled up to enhance their performance when resources increase. For instance, ResNet18 can be upgraded to ResNet101 by adding more layers. Traditionally, models were scaled by increasing the CNN's width, depth, or input image resolution. However, this practice was arbitrary, involved time-consuming manual tuning, and occasionally resulted in suboptimal performance. In their research, Tan et al. [26] introduced a new approach to scaling neural networks, which involves uniformly increasing the network depth, width, and resolution for better performance using a set of fixed scaling factors. They first designed a baseline architecture called EfficientNetB0, which was then scaled up using the compound scaling method to create a family of EfficientNet. This approach led to the development of eight EfficientNet variants, ranging from EfficientNetB0 to EfficientNetB7. The systematic scaling of the network improves its performance by balancing all the compound coefficients of the architecture width, depth, and image resolution.
Figure 6. MBConv: Elemental EfficientNet building block
Figure 7. Framework for semantic segmentation using the suggested Eff-UNet and EfficientNetB7 architecture. Figure 5 displays the specifics of Block1-7. To create the segmentation map, a series of upconvolution and concatenation layers make up the decoder
The top model, Efficient- NetB7, performs better on ImageNet in terms of accuracy than previous state-of-the-art CNNs [26] and is also 8.4 smaller and 6.1 better and faster. Figure 5 depicts the network design of EfficientNetB7. The mobile inverted bottleneck convolution (MBConv) [27] with squeeze and excitation optimization is the fundamental component of the EfficientNet design. Figure 6 depicts the concept of MBConv. The total number of these MBConv blocks varies depending on EfficientNet network family, EfficientNetB7 exhibits an in-crease in depth, model size, width, resolution compared to EfficientNetB0. Moreover, there is an improvement in accuracy along with these advancements [26]. According to the size of the filter, striding, and total number of channels, it can be separated into seven blocks. In our study, we employed Efficient- NetB5 & EfficientNetB7 as encoders with UNet as the decoder, and EfficientNetB7 had the best performance.
The UNet is a convolutional neural network that has a symmetric U shape and was originally designed for bio-medical image segmentation. It has two pathways - an encoder and a decoder. The encoder, which is made up of a series of convolutional, activation, and pooling layers, is responsible for extracting context from the input image. The decoder or expansion pathway in the UNet gradually increases the size of the output obtained from the encoder, which is initially smaller than the input. This is achieved through the use of transposed convolutions that enable precise localization. As part of the expansion pathway, the feature maps from the contracting pathway are concatenated with high-level features and spatial information, and these are then fed through a series of up convolutions. When dealing with intricate scenes that involve various objects and their respective placements, it is necessary to combine the intermediate low-level feature maps from Efficient-Net with the intermediate high-level feature maps from the UNet decoder. The reason for this is that the encoder's low-level feature maps contain precise spatial information that is particularly helpful in these circumstances. The up sampling component of the network has a large number of feature channels that allow for the transmission of context information to higher resolution layers. Unlike the traditional UNet where the expansion and contraction paths are almost symmetrical, in this case, the EfficientNet is proposed as an encoder for the contracting path. Instead of using the standard set of convolution layers, this approach is suggested to enhance the performance of the network. The decoder module of the proposed architecture has similarities with the original UNet. Specific details of the architecture are shown in Figure 7. Prior to processing, the images were resized from their original size of 320x227 to 320x224. Figure 5 provides information on the number of channels, levels, and resolution for each feature map, while Figure 6 illustrates the detailed block architecture of the encoder. To recreate the segmentation map with the same size as the input image, the feature map from the final logit of the encoder is bilinearly upsampled by a factor of two and then combined with the feature map from the encoder that has the same spatial resolution. Following this, 3x3 convolution layers are added, and another upsampling by a factor of two is performed. This process is repeated until the segmentation map is recreated with the input image of same size. Unlike the original UNet, the proposed architecture is asymmetrical, with a shallower expansion path than the contraction path. When a powerful CNN encoder like EfficientNet is used, the overall performance of the method is improved.
4.3 Extraction of hand keypoints
For image point matching, the proposed Scale Invariant Feature Transformation approach (SIFT), which produces a reliable keypoint estimator. The features recovered from SIFT are constant to image scale and rotation and are shown to provide reliable matching over a wide range of affine distortion, variation in three-dimensional viewpoint, inclusion of noise, and lighting modification. To extract the Keypoints from the blob, use the Laplacian of Gaussian (LoG) with various. With the help of orientation and gradient magnitude across all key points, this estimator generates a vector containing the values of all the appearances in the orientation histogram. The height HN and width WN of the featured image are:
$W N=W B B \times 0.5+50, H N=H B B \times 3.5+1$ (2)
In Eq. (2) HBB and WBB delineates sizes of specific object’s bounding box. The normalized image includes a frame of 1-pixel width to prevent local maxima from being extracted outside of the borders. Then, distance transform (DT) is used to create a grayscale image in which each backdrop pixel's concentration corresponds to its L1 expanse from the closest forefront pixel. The local maximum is then located on the DT image using a k x k square window. It generates linked components with comparable pixel intensities. Keypoints are then extracted as the focal point of the accumulation of connected items. Every DT picture pixel has a k X k square window, which is used to identify local maxima. Quantity of local maxima that are extracted is affected by criterion k. Less important keypoints are recognized as k grows larger. Since some of the keypoints in the excerpt may have been produced by noise and contour disturbances, they might not be entirely necessary. Key-points which maintains the riveted positions when local image deformation is applied stay more distinct than keypoints that shift while local image deformation is applied. Scale-space filtering is used in the phase as part of the key-point filtering technique [17]. This process produces a series of blurred images using a Gaussian filter, with the s function being represented by Eq (3).
$g(x, y, \alpha)=\frac{1}{2 \pi \alpha^2} e^{-(x+y)^2} / 2 \alpha$ (3)
where, $\alpha$ stands for the scale-managing smoothing criteria, and x and y stand for X and y pixel synchronization. Then, Otsu's technique is used to binarize the filtered images. The method is used to create N images that are progressively more distorted, which are then used to extract key points. The use of a cosine similarity index is then used to determine similarity. The relevant rotating matrix models are created for the posture estimate based on the pitch angle, roll angle and yaw angle. The rotating benchmark Keypoints can remain near to the Keypoints with the indeterminate pose relative to the objective function. Together with the three rotation angles and the depth, additional considerations include scaling and shifting. To make the formula simpler, the Keypoints of the various stance images are taken to be the same. Hence, there are six unknown variables in the posture vector. The model is formulated as:
$\begin{aligned} c(\alpha, \beta, \gamma, z, C, t) & =\min \left\{\sum_{i=1}^n \| q i C \cdot\left[R(\alpha, \beta, \gamma) \cdot p_i\right.\right. \left.+t] \|^2\right\}\end{aligned}$ (4)
In this context, 'qi' represents the coordinate data of the image, whereas 'pi' refers to the 3D coordinate point of the frontal key-points of the joint. The variables 'α', 'β', and 'γ' correspond to the rotational angles, while 'z' pertains to the depth of the front. Additionally, 'C' represents the scaling factor, and 't' denotes the shifting factor. The rotations that are carried out by subsequent joints in relation to a given reference pose are what the hand pose configuration requirements are concerned with. Local coordinate systems are used to indicate rotations. As a result, the most obvious way to define similarity between two postures, P1 and P2, is to look at the total distance travelled by associated skeletal joints as a whole.
$\begin{aligned} & d(P 1, P 2) ={ }_{\text {joint }}^{\Sigma} d(\text { rotation }(P 1(\text { joint }) \cdot P 2(\text { joint }))\end{aligned}$ (5)
As a result, the major challenge still lies in choosing the correct distance function rotation to handle the estimation of the difference between the two rotations. By definition, rotations are represented by the 3 Euler angles (α, β, γ ). Such details consist underlying rotations carried out around local coordinate system axes. Hence, any traditional vector space distance function could be used for cosine metrics.
$\Delta(\alpha 1, \alpha 2)=\Pi-\| \alpha 1-\alpha 2 \mid-\Pi$ (6)
Quaternions provide a diverse, effective, and succinct representation of rotations. These are developments related to complex numbers with a three-dimensional section:
$Q=a+i . b+j \cdot c+k \cdot d$ (7)
Calculations are performed for the imaginary vector sections (b, c, and d) and the quaternion's scalar section (a=cos(2)) in the scenario of rotation with an angle of along the axis, which is expressed by a unit length vector u. Another method would define its cosine as a nonlinear conversion of geodesic distance in place of the raw angle.
$d_{\text {cosine }}(q 1, q 2)=\frac{1-(q 1, q 2)}{2}$ (8)
The posture similarity of the hand progression between the student and the teacher is used to calculate the pose precision.
$\begin{aligned} & \mathrm{S}(\mathrm{p}) =\frac{1}{\mathrm{Te}(\mathrm{t})-\mathrm{Tt}(\mathrm{s})+1} \sum_{\mathrm{i}=\mathrm{T}_{\mathrm{t}}(\mathrm{t})}^{\mathrm{T}_{\mathrm{i}}} \exp \left(-\frac{\mathrm{fi}(\mathrm{t})-\mathrm{f}(\mathrm{t})}{\beta}\right)\end{aligned}$ (9)
in which, the ith frame's vectors fi t and f′ t, respectively, indicate the hand gesture characteristics of the student and tutor, and the symbol stands for a criterion that regulates the amount of deviations from the instructor's hand gesture. The total biased scores of timing and pose accuracy are used to define the dance series between the student and teacher as:
$\mathrm{S}=\frac{1}{\mathrm{~N}} \sum_{\mathrm{i}=1}^{\mathrm{N}} \operatorname{Sj}(t) \operatorname{Sj}(p)$ (10)
where, N stands for the number of hand gesture sequences that a student will perform, and Sj(t)Sj(p) stands for the appropriateness of time and posture in the jth sequence.
4.4 CNN-LSTM classification of hand mudras
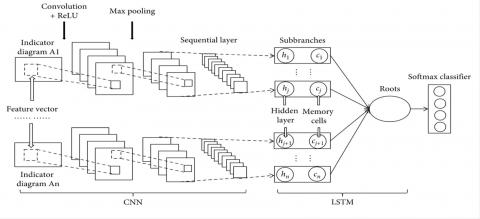
The CNN Long Short-Term Memory Network, sometimes known as CNN LSTM for short, is an LSTM architecture created especially for issues involving the sequence prediction of inputs having a spatial component, such as images or videos. Convolutional Neural Network (CNN) layers are used in the CNN LSTM architecture to extract features from input data, and LSTMs are used to assist sequence prediction. The classifier CNN-LSTM is trained using the retrieved features. The CNN and LSTM structures are incorporated in the CNN-LSTM. The needed details have been learned in the classifier and the feature data has been taught in the CNN-LSTM deep learning structure, as shown in the architectural diagram in Figure 8. The Hybrid design The suggested methodology uses CNN-LSTM as both the classifier and the forecasting network structure. The benefit of the suggested methodology is that it addresses accuracy. CNN-LSTM has a higher accuracy value thanks to the hybrid structure's pose-estimated key locations. With CNN-LSTM, categorization is done after the key points have been extracted.
First, the input representation with the essential points excised is convolved using convolutional level C-1 with 3x3 kernal in addition to ReLU rectifier. Every feature vector produced by the layer has a constant size of 32 x 32. There are two more levels, C-2 and C-3, which are positioned successively. A pooling level named P-1 with a kernel dimension of 2x2 is shown after layer C-3. The output of P-1 produces a 16 x16 kernel when the pooling layer uses a 2x2 kernel. After the P-1 layer, the dense layer, which produces 512 neurons, is displayed. The layer's output is used as the input layer for the LSTM.
Figure 8. CNN-LSTM Architecture for mudra classification
Figure 9. Building blocks of the CNN-LSTM classifier in the EfficientNet-UNet architecture
We converted the data into a time sequence when the layer included a unidimensional vector. All TS information that we produced, ranging from x1 to xs, includes an ID of dimension q, similar to c1 to cb, where s is b 432. After a drop-out of 25% of the information, a dense level with 54 neurons is located succeeding the LSTM level. The decision layer is then placed, as shown in Figure 9, to distinguish between the many styles of hand gestures focused on stance. The mathematical formula for the layer-l convolution procedure is shown as:
$C_j=f_{m i E M} \stackrel{\Sigma}{m i} \times k j+b j$ (11)
The activation function is represented by f, the convolution kernel dimension is represented by F1, and Kj (j = 1, 2, F1) denotes the ConV bias, kernal of the j-th ConV kernel. One may create F1 feature maps using F1 convolution kernels. The layer l pooling operation is displayed as:
$\mathrm{Sj}=\beta \mathrm{j} \operatorname{down}(\mathrm{cj})+\mathrm{bj}$ (12)
where, down(cj) stands for the subsampling technique, and bj stands for bias. j βj (j 1, 2, F1) denotes multiplicative bias of j-th pooling. The CNN paradigm's loss function uses mean squared error with an L2 normal distribution as well as observed values and fitted CNN values at the appropriate time stamps (tk) for the input image I. M continues to be the number of training data to prevent overfitting, an L2 regularization constraint is used. The state of the cell, which contains the information to be remembered and passed to the following cell, is the more important component. The short-term states (ht) and long-term states (Ct) are divided into two categories. Finally, three control gates (forget, input, and output gates) are added to the state route to control and prepare the cell states.
Determining how many data from the input image details X(t) and the previous output h (t — 1) should be excluded from the LSTM cell's first phase is still necessary. A sigmoid layer known as the "forget gate layer (ft)" reliably generates this preference. This evaluates the values of h(t 1) and X(t) for creating each cell's state C(t 1) values between 0 and 1, which denotes disregarding the value and 1, which denotes having it. How to handle data extrication from the previous long-term state C is demonstrated in Eq. (13).
$\mathrm{f}(\mathrm{t})=\sigma(\mathrm{W} f[h(t-1), X(t)]+b(f))$ (13)
where, Wf and bf corresponds to weight matriX and bias in the case where stands for the sigmoid function. The current data that needs to be produced in the next state and given to the input gate for memorization in the cell state. There are two steps we should take to accomplish this: Initially, a "input gate later it" layer sigmoid. The values that need to be updated are determined by Eq. (14).
$\mathrm{I}(\mathrm{t})=\sigma(\mathrm{Wi}[\mathrm{h}(\mathrm{t}-1), \mathrm{X}(\mathrm{t})]+\mathrm{b}(\mathrm{i}))$ (14)
The creation of a vector of new values Ct for Eq. (15) that is to be considered in the state is thus the focus of a tangent hyperbolic layer. Afterwards, these elements are combined to create a state update.
$\mathrm{C}(\mathrm{t})=\tanh (\mathrm{Wc}[\mathrm{h}(\mathrm{t}-1)], \mathrm{X}(\mathrm{t})]+\mathrm{b}(\mathrm{c}))$ (15)
where, Wc and Wi represent weight matrices, and b(i) and b(c) stand for the bias terms. The final outcome gate, or final phase, decides what data was last created at the conclusion of the cell. According to Eq. (16), the final outcome gate computation is based on the cell state, and Eq. (17) describes how to update the hidden state.
$\mathrm{O}(\mathrm{t})=\beta\left(\mathrm{W}_0[\mathrm{~h}(\mathrm{t}-1), \mathrm{X}(\mathrm{t})]+\mathrm{b}(0)\right)$ (16)
$\mathrm{H}(\mathrm{t})=\mathrm{O}(\mathrm{t}) \tanh (\mathrm{C}(\mathrm{t}))$ (17)
Weight matriX and bias are represented in Eq. (16) by Wo and b(o). Block output is repeatedly connected to the input and all of the gates. The evaluation results are classified based on the probability index of the chosen class having characteristics in additional to the corresponding function by evaluating training data.
Table 1. Accuracy of current and suggested techniques for various Epochs
|
Epochs |
15 |
25 |
35 |
45 |
65 |
|
LRCN |
71.4 |
73.4 |
73.4 |
75.2 |
77.42 |
|
CONV3D |
84.4 |
83.4 |
86.5 |
86.3 |
88.58 |
|
MLP |
73.4 |
73.4 |
77.3 |
82.3 |
84.56 |
|
LSTM |
71.3 |
74.4 |
76.3 |
77.4 |
77.32 |
|
CNN-LSTM(Proposed) |
96.6 |
97.3 |
98.1 |
98.4 |
98.03 |
Table 2. Precision of current and suggested techniques for various Epochs
|
Epochs |
15 |
25 |
35 |
45 |
65 |
|
LRCN |
76.5 |
81.4 |
83.4 |
83.1 |
87.3 |
|
CONV3D |
76.2 |
77.3 |
80.5 |
82.4 |
85.3 |
|
MLP |
82.2 |
83.2 |
83.2 |
85.3 |
88.6 |
|
LSTM |
85.2 |
88.3 |
88.6 |
91.6 |
93.45 |
|
CNN-LSTM(Proposed) |
85.7 |
87.6 |
91.2 |
91.3 |
93.04 |
Table 3. Recall of current and suggested techniques for various Epochs
|
Epochs |
15 |
25 |
35 |
45 |
65 |
|
LRCN |
68.4 |
74.8 |
72.4 |
75.5 |
77.6 |
|
CONV3D |
82.3 |
88.9 |
87.5 |
86.6 |
85.3 |
|
MLP |
81.3 |
83.2 |
84.3 |
86.5 |
86.54 |
|
LSTM |
88.3 |
91.4 |
92.3 |
94.4 |
93.5 |
|
CNN-LSTM(Proposed) |
93.4 |
93.3 |
97.2 |
98.2 |
97.24 |
Table 4. AUC Scores of current and suggested techniques for various Epochs
|
Epochs |
15 |
25 |
35 |
45 |
65 |
|
LRCN |
77.4 |
81.4 |
83.4 |
83.2 |
85.5 |
|
CONV3D |
81.2 |
80.3 |
83.5 |
83.5 |
84.6 |
|
MLP |
73.2 |
75.4 |
78.2 |
80.3 |
82.46 |
|
LSTM |
73.3 |
74.6 |
77.1 |
72.3 |
77.32 |
|
CNN-LSTM(Proposed) |
94.7 |
95.3 |
96.2 |
97.3 |
98.72 |
Table 5. F1-Score of current and suggested techniques for various Epochs
|
Epochs |
15 |
25 |
35 |
45 |
65 |
|
LRCN |
71.5 |
73.2 |
75.6 |
75.3 |
77.35 |
|
CONV3D |
82.3 |
83.5 |
84.5 |
86.2 |
88.45 |
|
MLP |
73.2 |
75.2 |
78.3 |
82.3 |
82.45 |
|
LSTM |
71.6 |
74.2 |
76.2 |
77.2 |
77.32 |
|
CNN-LSTM(Proposed) |
96.6 |
95.7 |
96.45 |
97.03 |
97.36 |
Table 6. Association between current and suggested approaches for analyzing classifiers
|
Criteria |
LRCN |
CONV3D |
MLP |
LSTM |
CNN-LSTM (Proposed) |
|
Accuracy |
92.6 |
84.6 |
83.3 |
92.4 |
97.53 |
|
Precision |
77.43 |
88.2 |
82.46 |
77.32 |
98.05 |
|
Recall |
77.6 |
85.5 |
85.56 |
93.3 |
97.48 |
|
AUC Score |
85.5 |
84.6 |
88.6 |
84.3 |
98.13 |
|
F1-Score |
93.1 |
92.2 |
88.5 |
82.3 |
97.75 |
Table 7. Association between current and proposed methods for training classifiers
|
Measures |
LRCN |
CONV3D |
MLP |
LSTM |
CNN-LSTM (Proposed) |
|
Accuracy |
85.4 |
84.2 |
87.6 |
92.42 |
93.02 |
|
Precision |
77.7 |
86.5 |
93.5 |
91.5 |
92.12 |
|
Recall |
82.5 |
86.4 |
94.3 |
81.7 |
93.77 |
|
AUC Score |
87.6 |
73.6 |
88.3 |
82.4 |
95.45 |
|
F1-Score |
88.5 |
90.5 |
87.3 |
86.4 |
92.53 |
Figure 10. (a) Accuracy graph (b) Loss graph
Figure 11. Accuracy correlation between current and planned methods
Figure 12. F1-score correlation between currently used and new methods
Figure 13. Precision correlation between currently used and new methods
Figure 14. AUC specificity between currently used and newly proposed approaches is correlated
Figure 15. Recall correlation between currently used and new methods
The suggested technique was put into practise on a computer running Windows 10 using Python 3.6. The desktop computer was equipped with a 3.60 GHz Intel® Core-i7-7700[53] processor, 16 GB of RAM, and an 8 GB NVIDIA GeForce GTX 1070 graphics processing unit (GPU).
5.1 Performance analysis
There are total 252 YouTube videos of the Bharatanatyam dance form has been used to make up the dataset used in our research. There are a total of 25 video clips with a 400A-U350 maximum resolution and a 25 s maximum runtime. With the YouTube dance class video as a reference, we enhanced the content. Our device also chopped video segments into five to six second chunks of the casing while dispensing information, yielding a maximum of 150 frames. The ratio of 7:3 was selected as the train to examine for assessment. The result dataset presented numerous challenges, including variations in lighting, dancers' shading on the dais, uniform dance positions, etc. This dataset is made more difficult by the fragmentary hand portions missing in a few sequences and the less accurate skeletal cooperative synchronizing. 252 videos altogether were considered for the experiment.
Using Python software, the experimental results are analyzed based on various evaluation metrics, including the f1-score, accuracy, precision, recall, and AUC curve. The assessment is performed for four distinct techniques, namely Convolutional LSTM (LRCN), Multilayer Perceptron (MLP), LSTM, and CONV3D, in conjunction with the proposed CNN-LSTM model. The training process for Pose estimation, using the complete set of feature data, was carried out over a period of 65 epochs with batch size 4.
·Accuracy: The percentage regarding correctly classified samples during categorization is shown here.
Acuuracy rate $=\frac{\text { true positive }+ \text { true negative }}{\text { total instances }} * 100$
·Precision: This determines what proportion of information sent to the network contains intrusions. It is used to calculate the precision of the classifier.
Precision $=\frac{\text { true positive }}{\text { true positive }+ \text { false positive }}$
·Recall: It gives the proportion of correctly anticipated positive Real Positives, and it is defined as
Recall $=\frac{\text { true positive }}{\text { true positive }+ \text { false negative }}$
·F1-Score: This F1-Score displays the mean recall and accuracy values. Recall is still the instance-based determination of the keyfeature known as faulty or non-faulty, whereas precision is still the prediction of accuracy.
$f 1-$ measure $=\frac{2 \times \text { precision } \times \text { recall }}{\text { precision }+ \text { recall }}$
The accuracy of training and testing, the loss of training and testing, and 65 epochs are shown in Figures. 10(a) and (b). The proposed CNN-LSTM (proposed) technique was examined using different epochs, and the accuracy has been computed for the emerging and proposed methods. The loss gradually dropped as the number of epochs rose, demonstrating the significance of the proposed technique. The Tables 1 through 5 list the performance measures for accuracy, precision, recall, F1-Score, and AUC. The graph from Tables 6, 7 shows the association between the existing and suggested strategies, does the same. Thanks to EfficientNet-UNet and heavily processed similarity index to remove the blob at the Key points' edges, the suggested solutions are shown to be very well balanced as the number of epochs increases.
The accuracy of the suggested technique CNN-LSTM (proffered) is 85.7%, 87.6%, 91.2%, 91.3%, and 93.04% at different epochs level at 15, 25, 35, 45, and 65. It has been compared with the emerging techniques LRCN, CONV3D, MLP, and LSTM, and the results have been visually plotted in Figure 11. Also, it has been noted that the suggested procedures provide a greater level of accuracy, 93.04% at the 65 Epoch level.
The F1- Score for the proposed technique CNN-LSTM (proffered) is 96.6%, 95.7%, 96.45%, 97.03%, and 97.36% for different Epoch levels of 10, 25, 35, 45, and 65. It has been compared with the existing techniques CONV3D, LRCN, LSTM, and MLP techniques in the graph shown in Figure 12. The F1- Score for the suggested method at the 65 epochs was found to be 97.36 %.
The precision of the proposed CNN-LSTM approach (proffered) is 96.6%, 97.3%, 98.1%, 98.4%, and 98.03% at different epoch levels at 15, 25, 35, 45, and 65. It has been compared to the existing CONV3D, LRCN, LSTM, and MLP techniques, and the results are shown graphically in Figure 13. At 65 epochs, it has been determined that the proposed methodology delivers a 98.03%. For different Epochs levels of 15, 25, 35, 45, and 65, the proposed technique.
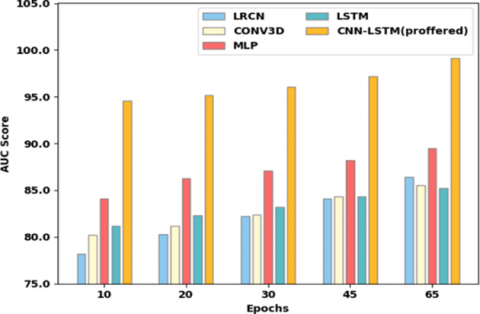
The proposed technique CNN-LSTM (proffered) achieves 94.7%, 95.3%, 96.2%, 97.3%, and 98.72% AUC Score at various Epochs levels of 15, 25, 35, 45, and 65. It has been compared with the current techniques CONV3D, LRCN, LSTM, and MLP techniques in the graph shown in Figure14. The proposed method was found to have a 98.72% AUC at the 65 epochs.
CNN-LSTM (proposed) achieves 93.4%, 93.3%, 97.2%, 98.2%, and 97.24% recall. It has been contrasted with the existing techniques CONV3D, LRCN, LSTM, and MLP in the graph shown in Figure 15. At the 65 epochs, the proposed method was determined to have a 97.24% accuracy.
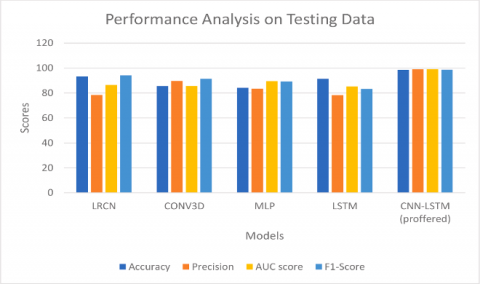
Figure 16. Examination of overall performance for testing classifiers
Figure 17. Analysis of the overall effectiveness of the suggested and used strategies
The overall collation of the proposed CNN-LSTM technique with the current ones is depicted in Figure 15, and it is clear that the suggested technique outperforms the existing ones in terms of highest classified output. To construct a stacked array for each video, we selected 48 frames at random from each movie and fed them into the Tensor flow EfficientNet-UNet pre-trained paradigm. The input dimensions of the model are the batch, feature dimensions (32, 48, 2048) and specimen, we sent the CNN-LSTM output and two completely integrated layers to the softmax layer for evaluation. The CNN-LSTM architecture yields superior outcomes when compared to the other assessed deep learning frameworks. It is clear that the suggested approaches outperform the present ones for the highest classified output. According to the highest Classifier Performance Metrics, the new techniques exceed the current way of pose estimation, as is evident visually in the aforementioned Figure 16. Results from the Tensorflow EfficientNet-UNet joined using a similarity index were slightly more refined than those combined using a hand pose signature. Figure 17 depicts an overall comparison of the proposed CNN-LSTM processes with the Established procedures. Our system distinguishes the movements of hand across a number of frames focused on its previous hand pose sequence and later predicts the hand gesture out of the action sequence.
(a)
(b)
Figure 18. Similarity checking between student and dancer to ensure right dance (a) Garuda mudra Similarity index (b) Matsya mudra similarity index
To get normalized expanse to the rest of an anchor joint, we chose mutual 7 as an orienting point. In Euclidean expanse norm, distance is used as the distance metric. In order to depict the hand gesture, we also incorporated the angles among important anchor joints. Figures 18(a) & (b) shows the method of comparing similarity between hand gestures, and is represented by an intensity value. When a learner tries to imitate a dance teacher, this result demonstrates an instant dance analysis and a dance representation of each a hand movement. Prior to being trained, the image dataset undergoes a pre-processing phase where a variety of image manipulation methods such as rescaling, thresholding, and scaling are utilized to enhance the dataset's suitability for precise fitting by the neural network.
Semantic understanding of a shloka using hand gestures
We selected a YouTube video to show how it is possible to interpret the dancer's hand gestures in order to understand the meaning of the performed dance performance. The Guru Stuti,a crucial shloka (short poem/invocation) in Hindu texts, is performed here by a dancer:
Gurur Brahma Gurur Vishnum Gurur Devo Maheshwaraha Guru Sakshat Parabrahma Tasmai Shree Gurave Namaha.
I view you as Brahma, teacher. Teacher. You are Vishnu to me. I regard you as Maheshwaraha, Guru (Shiva). You rule over all lords. I bowed before you. Using our previously trained SVM or CNN classifier, we can break down the YouTube video of the dancer reciting this shloka into individual frames and identify the hand motions. As seen in Figure 19(a), the dancer's right hand is making the Hamsasye gesture , which is associated with the phrase "Gurur Brahma" and has been successfully detected by both of our Cnn architectures. The double hand motions made by the dancer in Figure 19(b) and Figure 19(c) are accurately classified by our proposed model as Shankha and Chakra, respectively.
Figure 19. Identification of hand gestures to comprehend the meaning of a shloka (Guru Stuti)
The phrases Gurur Vishnum in the Shloka are referenced by these two hand motions. Chakra denotes a disc or a wheel in Sanskrit. The Sudarshan Chakra of Lord Vishnu is represented by this two-handed gesture. In Figure 19(d), the dancer is depicted making a single hand motion for the word "Devo" from the Shloka by Pataka. The trained model can distinguish the left hand motion, but due to a wide range in viewing angles, our model can identify the right hand gesture. Figure 19(e) depicts the word Maheshwaraha being spoken while making the Shivalinga sign with two hands. Both the SVM trained models and CNN are capable of correctly identifying this gesture. In Figure 19(f), the phrases Gurur Sakshat are shown as single-handed Pataka movements in each hand. By utilizing her left hand, the performer made this move, which the suggested model was able to recognize. The dancer is depicted in Figure 19(g) performing the word Parabrahma, which means "salutation to the Almighty”. Our model can recognize Anjali's double hand gesture in Figure 19(h). The final salutation to the teacher, Guruve Namahe, is indicated by this motion.
Previous approaches involved fitting a flexible hand model to the deep figure, which poses computational challenges. Nonetheless, this approach enables the intermediate frame to serve as the initial value for subsequent frames. However, considering multiple frames simultaneously becomes necessary to prevent increasing inaccuracies over time. Real-world challenges, such as posture variations, occlusion, illumination changes, and other factors, make hand position direction estimation particularly difficult. Consequently, numerous techniques have been developed over time to address these issues. This study presents a framework for classifying hasta mudras in the Bharatanatyam dancing style. In our Convolution Neural Network - Long Short Term Memory (CNN-LSTM) deep knowledge architecture for Indian Classical Dancing (ICD) classification, we added a new hand pose signature. We evaluated dancing performances by estimating the positions of human hands. In this architecture, hand poses are evaluated using information and information pruning, while pupil dance timing and correctness are evaluated using a dance tutor application. As a result, several pre-processing stages were carried out, including image processing, to aid in the feature extraction process. As a result, it is noted that throughout the examination process, the proposed CNN-LSTM achieves 93.04% accuracy, 98.03% precision, 97.24% recall, 98.72% AUC score, and 97.36% f1-score. This hand position estimation network was constructed using a EfficientNet-UNet architecture, which lowers the complexity of the runtime. Because it is a lightweight network, it can also be operated by CPUs. This technology is suggested for use in a number of applications, including human computer interaction systems, digital dance learning platforms, hand activity identification in videos, and game analysis. By removing occlusion issues at the pre-processing stage, the work will be expanded in the future to increase the hand posture estimation and classification accuracy.
[1] Bennink, L.P., Deekshithar, K.R., Deekshithar, J.R., Deekshithar, S.R. (2013). Shiva's Karanas in the temples of Tamil Nadu: the Natya Shastra in stone.
[2] http://natyanjali.blogspot.in/
[3] Okada, A., Buckingham Shum, S., Sherborne, T. (2008). Knowledge cartography. Software Tools and Mapping Techniques. https://doi.org/10.1007/978-1-4471-6470-8
[4] Bailey, H., Bachler, M., Buckingham Shum, S., Le Blanc, A., Popat, S., Rowley, A., Turner, M. (2009). Dancing on the grid: using e-science tools to extend choreographic research. Philosophical Transactions of the Royal Society A: Mathematical, Physical and Engineering Sciences, 367(1898): 2793-2806. https://doi.org/10.1098/rsta.2009.0048
[5] LeCun, Y., Huang, F.J., Bottou, L. (2004). Learning methods for generic object recognition with invariance to pose and lighting. In Proceedings of the 2004 IEEE Computer Society Conference on Computer Vision and Pattern Recognition, 2004. CVPR 2004, pp. II-104. https://doi.org/10.1109/CVPR.2004.1315150
[6] Krizhevsky, A., Sutskever, I., Hinton, G.E. (2012). Imagenet classification with deep convolutional neural networks. Advances in Neural Information Processing Systems, pp. 25.
[7] Mallik, A., Chaudhury, S., Ghosh, H. (2010). Preservation of intangible heritage: A case-study of indian classical dance. In Proceedings of the Second Workshop on eHeritage and Digital Art Preservation, pp. 31-36. https://doi.org/10.1145/1877922.1877932
[8] Samanta, S., Purkait, P., Chanda, B. (2012). Indian classical dance classification by learning dance pose bases. In 2012 IEEE Workshop on the Applications of Computer Vision (WACV), CO, USA, pp. 265-270. https://doi.org/10.1109/WACV.2012.6163050
[9] Kapsouras, I., Karanikolos, S., Nikolaidis, N., Tefas, A. (2013). Folk dance recognition using a bag of words approach and ISA/STIP features. In Proceedings of the 6th Balkan Conference in Informatics, Thessaloniki, Greece, pp. 71-74. https://doi.org/10.1145/2490257.2490271
[10] Kapsouras, I., Karanikolos, S., Nikolaidis, N., Tefas, A. (2013). Feature comparison and feature fusion for traditional dances recognition. In Engineering Applications of Neural Networks: 14th International Conference, EANN 2013, Halkidiki, Greece, pp. 172-181. https://doi.org/10.1007/978-3-642-41013-0_18
[11] Forsyth, D.A., Fleck, M.M. (1997). Body plans. In Proceedings of IEEE Computer Society Conference On Computer Vision And Pattern Recognition, PR, USA, pp. 678-683. https://doi.org/10.1109/CVPR.1997.609399
[12] O'rourke, J., Badler, N.I. (1980). Model-based image analysis of human motion using constraint propagation. IEEE Transactions on Pattern Analysis and Machine Intelligence, (6): 522-536. https://doi.org/10.1109/TPAMI.1980.6447699
[13] Andriluka, M., Roth, S., Schiele, B. (2009). Pictorial structures revisited: People detection and articulated pose estimation. In 2009 IEEE Conference On Computer Vision And Pattern Recognition, Miami, FL, USA, pp. 1014-1021. https://doi.org/10.1109/CVPR.2009.5206754
[14] Ning, H., Xu, W., Gong, Y., Huang, T. (2008). Discriminative learning of visual words for 3D human pose estimation. In 2008 IEEE Conference on Computer Vision and Pattern Recognition, AK, USA, pp. 1-8. https://doi.org/10.1109/CVPR.2008.4587534
[15] Pisharady, P.K., Vadakkepat, P., Loh, A.P. (2013). Attention based detection and recognition of hand postures against complex backgrounds. International Journal of Computer Vision, 101: 403-419. https://doi.org/10.1007/s11263-012-0560-5
[16] Yang, Y., Fermuller, C., Li, Y., Aloimonos, Y. (2015). Grasp type revisited: A modern perspective on a classical feature for vision. In Proceedings of the IEEE Conference On Computer Vision And Pattern Recognition, Boston, MA, USA, pp. 400-408. https://doi.org/10.1109/CVPR.2015.7298637
[17] Srivastava, N., Hinton, G., Krizhevsky, A., Sutskever, I., Salakhutdinov, R. (2014). Dropout: a simple way to prevent neural networks from overfitting. The Journal of Machine Learning Research, 15(1): 1929-1958.
[18] Stenger, B., Thayananthan, A., Torr, P.H., Cipolla, R. (2006). Model-based hand tracking using a hierarchical bayesian filter. IEEE Transactions on Pattern Analysis and Machine Intelligence, 28(9): 1372-1384. https://doi.org/10.1109/TPAMI.2006.189
[19] Hariharan, D., Acharya, T., Mitra, S. (2011). Recognizing hand gestures of a dancer. In Pattern Recognition and Machine Intelligence: 4th International Conference, PReMI 2011, Moscow, Russia, pp. 186-192. https://doi.org/10.1007/978-3-642-21786-9_32
[20] Gautam, S., Joshi, G., Garg, N. (2017). Classification of Indian classical dance steps using HOG features. published in International Journal of Advance Research in Science and Engineering (IJARSE), 6(8).
[21] Rani, C.J., Devarakonda, N., Kumari, K.N. (2021). A monadic framework for real-time 2D multi person pose detection for captured images and videos. In 2021 Fourth International Conference on Electrical, Computer and Communication Technologies (ICECCT), Erode, India, pp. 1-6. https://doi.org/10.1109/ICECCT52121.2021.9616673
[22] Malavath, P., Devarakonda, N., Polkowski, Z., rani, C. J. (2022). Assessment of 3-Dimensional hand pose by poseprior network for images. In Proceedings of Data Analytics and Management: ICDAM 2021, 2: 721-738. https://doi.org/10.1007/978-981-16-6285-0_58
[23] Bandaragoda, T., Adikari, A., Nawaratne, R., Nallaperuma, D., Luhach, A.K., Kempitiya, T., Nguyen, S., Alahakoon, D., de Silva, D., Chilamkurti, N. (2020). Artificial intelligence based commuter behaviour profiling framework using Internet of things for real-time decision-making. Neural Computing and Applications, 32: 16057-16071. https://doi.org/10.1007/s00521-020-04736-7
[24] Gunawardena, P., Amila, O., Sudarshana, H., Nawaratne, R., Luhach, A.K., Alahakoon, D., De Silva, D. (2021). Real-time automated video highlight generation with dual-stream hierarchical growing self-organizing maps. Journal of Real-Time Image Processing, 18: 1457-1475. https://doi.org/10.1007/s11554- 020-00957-0
[25] Ronneberger, O., Fischer, P., Brox, T. (2015). U- net: Convolutional networks for biomedical image segmen- tation. In Medical Image Computing and Computer-Assisted Intervention – MICCAI 2015, pp. 234-241, Cham. https://doi.org/10.48550/arXiv.1505.04597
[26] Tan, M., Le, Q. (2019). Efficientnet: Rethinking model scaling for convolutional neural networks. In International Conference on Machine Learning, pp. 6105-6114. https://arxiv.org/pdf/1905.11946v1.pdf.
[27] Sandler, M., Howard, A., Zhu, M., Zhmoginov, A., Chen, L.C. (2018). Mobilenetv2: Inverted residuals and linear bottlenecks. In Proceedings of the IEEE Conference On Computer Vision And Pattern Recognition, Salt Lake City, UT, USA, pp. 4510-4520. https://doi.org/10.1109/CVPR.2018.00474