Alif Tri Handoyo* | Gede Putra Kusuma
© 2022 IIETA. This article is published by IIETA and is licensed under the CC BY 4.0 license (http://creativecommons.org/licenses/by/4.0/).
OPEN ACCESS
Diabetic retinopathy (DR), is a complication resulting from the disease that can lead to blindness if not detected early. Recently, many classification systems for diabetic retinopathy have been developed. However, several problems were found, namely, the classification results in certain classes still have less than optimal accuracy values, the lack of in-depth analysis for the results, and the overall accuracy that can still be improved. In this work, we experiment by evaluating and combining new deep learning models such as EfficientNet, EfficientNetV2, LCNet, MobileNetV3, TinyNet, and FBNetV3 using ensemble stacking techniques with four different meta-learners: decision trees, logistic regression, ANN, and SVM to provide better accuracy in classifying the severity of diabetic retinopathy. Our work offers satisfactory classification results on the APTOS 2019 dataset with training, validation, testing, and F1 score accuracy of 96.56%, 95.33%, 84.17%, and 70.16%, respectively.
deep learning, diabetic retinopathy detection, ensemble learning, medical image analysis, model stacking
Diabetes is the most common disease in the world. According to a report by the World Health Organization (WHO), there are more than 400 million people suffering from diabetes in the world. This number is expected to increase to 552 million in 2024. WHO also reports that diabetes is a leading cause of death, blindness, and amputation. Diabetic retinopathy is one of the main causes of blindness [1]. More than 5 million people around the world with diabetes are blind. This number is expected to double by 2030 [2]. Research at a Jakarta government hospital in 2011 showed that the highest diabetes complication was neuropathy (54%) and followed by diabetic retinopathy (33.4%) in second place [3].
Recently, many classification systems for diabetic retinopathy have been developed. The diagnosis of diabetic retinopathy was made based on retinal images collected using the fundus photography procedure. A fundus photo is an image of the retina and its contents in clear detail. The existing classification systems for diabetic retinopathy differ in many aspects such as the source of the retinal image dataset, the image preprocessing method, the types of features extracted from the retinal image, and the algorithm used. Most researchers use deep learning methods. In the last 19 years, more than 425 articles have been published in journals describing various methods for the classification of diabetic retinopathy [4].
In 2021, Nida et al. [5] proposed a model to classify diabetic retinopathy grade using the Resnet50 model on the IDRiD dataset. They use a transfer learning approach to create the model. They perform various experiments and provide results with 98.5% accuracy for training and testing accuracy of 53.4%. Their experiment results clearly show signs of overfitting and should possibly be improved. Their works also lack preprocessing techniques that possibly can contribute to providing better results.
In 2020, Shaik et al. [6] use an Image thresholding-based segmentation model to detect diabetic retinopathy on high dimension dataset. They use a hybrid thresholding-based segmentation algorithm and developed a classification model to improve the efficiency of the model for disease prediction. Their experiment shows that the proposed filtered segmentation-based Bayesian deep neural network has better accuracy (5%) and runtime (ms) (3%) than the conventional models on different DR variation databases. This paper uses an interesting approach to detect diabetic retinopathy. However, the authors did not classify diabetic retinopathy according to grades, also predicting high-resolution images will likely cost in more computation.
In 2020, Bodapati et al. proposed the blended features method by combining the results of feature extraction from several deep pre-trained like VGG16-fc1, VGG16-fc2, and Xception models. Furthermore, they used the DNN (Deep Neural Network) model to train these blended features on the APTOS2019 [7] dataset and got an accuracy of 81.7% and a kappa statistic of 71.1% for the classification of the severity of diabetic retinopathy [8]. Although this blended feature improves accuracy, it introduces additional computing costs and the results are still not satisfactory.
In 2021, Yi et al. [9] proposed a new network called RA-EfficientNet, which is residual attention (RA) added to the EfficientNet architecture. The results of experiments conducted after training and evaluating the model on the APTOS2019 [7] dataset gave an accuracy of 93.55%, and a kappa score of 91.93. Adding residual attention indeed improves performance. However, further analyse of how the residual attention impacts the performance, by experimenting on different models is needed.
A recent work by Mungloo-Dilmohamud et al. in 2022, proposed a data augmentation technique to improve the generality of the transfer learning model in different CNN models which are VGG16, ResNet50, and DenseNet169. Based on the experiments conducted in APTOS2019 dataset, the Resnet50 model gives the best performance with training, validation, and testing accuracy of 99.8, 97.6, and 82% respectively [10]. These works provide a satisfactory result, although they still used outdated models and more analysis on how the augmentation impact the performance is needed. The results also show signs of overfitting.
Based on the previous research, several problems were found, namely the classification results in certain classes still have less than optimal accuracy values, and the overall accuracy results can still be improved. In this study, EfficientNet [11] was used because the architecture was proven to provide good accuracy in classifying the severity of diabetes retinopathy by previous researchers [9]. This research also uses other architectures such as EfficientNet [11], EfficientNetV2 [12], LCNet [13], MobileNetV3 [14], TinyNet [15], and FBNetV3 [16] because the architecture is proven to have better accuracy in classifying images in the ImageNet dataset. In addition, these models have not previously been used for cases of diabetic retinopathy severity classification. To further improve model performance in classification, the four models with the best validation accuracy were then combined with the ensemble stacking method using four different meta-learners namely decision trees, logistic regression, ANN, and SVM.
Based on the background that has been described, the main contributions of this research can be summarized as follows:
1. Evaluate the latest models whose architecture uses attention mechanisms in classifying the severity of diabetes retinopathy namely, EfficientNet [11], EfficientNetV2 [12], LCNet [13], MobileNetV3 [14], TinyNet [15], and FBNetV3 [16].
2. Combining the four models with the best validation accuracy using the ensemble stacking method with four different meta-learners namely decision trees, logistic regression, ANN, and SVM to further improve the model's accuracy in classifying the severity of diabetic retinopathy.
The remainder of this paper is structured as follows. Section II describes some of the related work. Section III describes in detail our experiment method. Section IV illustrates our experiments results and discussion. Section V concludes the result of this work and mentions some scope for future research.
This work used the fundus images from the Asia Pacific Tele-Opthalmology Society 2019 Blindness Detection (APTOS2019) dataset [7]. Although not the first of its kind, APTOS2019 [7] is an adequate dataset to work with, and quite popular among researchers and data science experts. Since its emergence in 2019, many research articles have been published. We present a brief discussion of the existing research involving APTOS2019 [7] dataset in the following few paragraphs.
In 2020, Dondeti et al. used NASNet for feature extraction, then t-SNE was used to reduce the dimensions of the features to prevent overfitting [17]. This t-SNE converts the Euclidean distance between data points in the higher-dimensional space into a conditional probability in the lower-dimensional space. By doing this, t-SNE can maintain local and global structures in lower dimensional representations. The proposed model used APTOS 2019 dataset [7] and trained the extracted features using v-Support Vector Machine (v-SVM) which provides an accuracy result of 77.90%. This low result in accuracy may be caused by v-SVM which is consired an old model, thus using a more recent algorithm should improve the performance. Although we still think that using the deep learning method in APTOS2019 dataset will provide more efficient computing, and higher accuracy compared to classical machine learning models.
Majumder and Kehtarnavaz proposed a multitask model consisting of one classification model, namely SEdensetNet and one regression model, namely MLP, with each other loss function [18]. After the classification model and regression model were trained separately, these two models were combined and fed into a multilayer perceptron network to classify the five stages of diabetic retinopathy. In addition, the Squeeze Excitation Densley Connected deep neural network was also built for this multitasking approach. Multitask models that have been created are trained and evaluated with two datasets namely APTOS 2019 [7] and EyePACS. This model produces a weighted Kappa score of 0.90 and 0.88 for the APTOS 2019 [7] and EyePACS datasets respectively. This approach needed extensive computing, considering we have to train two models separately, then combined the model. The analytical result also still lacking, due to the author only providing accurate results, without validation or test accuracy to further analyse the models performance.
Patel and Chaware proposed a model for the classification of the severity of diabetic retinopathy using a modified MobileNetv2 architecture. MobileNetv2 is used for feature extraction, then modified by adding a global average pooling layer and a softmax classifier layer above the base model of the pretrained MobileNetv2. In addition, to further improve the performance of the model, it is fine-tuned for some weights from the top layer of the network [19]. The model was then trained and evaluated using APTOS2019 dataset and gave a training accuracy of 91% and a validation accuracy of 81%. Although the accuracy provided satisfactory results, MobileNetv2 is considered an outdated model. Thus modifying other deep learning models can potentially give a better result. Modifying the deep learning model by only adding a layer also still very basic, further improvements like adding an ensemble method could also potentially improve the performance.
Islam et al. proposed a transfer learning model with the VGG16 architecture followed by a novel color version preprocessing technique. This preprocessing technique focuses on assigning color to fundus images, because color fundus images provide a better representation of features than grayscale fundus images. This research also applies other preprocessing techniques such as image sharpening and image smoothing [20]. The model was trained and evaluated using APTOS2019 dataset and provides an average accuracy of 91%. The preprocessing technique is appealing, although further research is needed to make sure that the preprocessing technique is really impacting the performance of the APTOS2019 dataset. Also, VGG16 is considered an old model.
Research conducted by Sikder et al. used the ensemble learning method to detect early blindness in diabetic retinopathy patients [21]. They used Image Histogram as feature extraction, then ensemble the model using ExtraTree as classifier, which is a technique based on decision tree and bagging technique to increase randomization when splitting nodes in the decision tree to reduce training time, and variance and increase classification accuracy. Before doing the classification, some of the classifier parameters are tuned such as n_estimator and max_features. This method was trained and evaluated using the APTOS 2019 dataset with a 10-fold cross-validation technique and provided an F1-score accuracy of 89.97%. This research uses an interesting approach from feature extraction, to when building the models. However, the results only provide accuracy results, without details on validation and testing accuracy. Also even after tuning the parameter and adding cross-validation, the results are still considered low when compared to the deep learning approach. Sikder et al. also conducted follow-up research to classify the severity of diabetic retinopathy. In their research, feature extraction uses a combination of technical features by combining two feature extraction methods, namely histogram features and GLCM features. Furthermore, to reduce the dimensions of the features, the basic GA algorithm is used by performing three operations, namely selection, crossover, and mutation. Furthermore, the features are fed to the learning ensemble using the XGBoost method to form a model [22]. This model was then evaluated using APTOS2019 dataset and provides an accuracy of 94.20%. This research method is a huge improvement compared to the previous version. They improve the feature extraction method and improve the model by using the ensemble boosting method. The results are also considerably high, even when compared to the deep learning model. Unfortunately, the research still lacks in-depth analysis of the results, and only provides the accuracy results, without more detail on validation, and testing accuracy.
Based on previous work, most researchers use deep learning methods to work with retinal image datasets, specifically CNN-based methods in making a model to detect the severity of diabetic retinopathy. Several problems were also found, mainly the overall accuracy of APTOS2019 dataset that can still be improved, the majority of research that still use outdated deep learning models, and the lack of in-depth analysis of the model results.
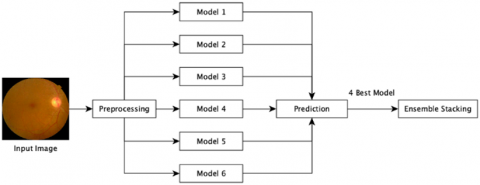
Figure 1. Workflow of the proposed Diabetic Retinopathy classification method
In this study, the proposed method begins with the preprocessing process. Next, a modeling process was carried out for each of the models used, namely EfficientNet [11], EfficientNetV2 [12], LCNet [13], MobileNetV3 [14], TinyNet [15], and FBNetV3 [16]. The six models are used because previous research conducted by Yi et al. [7] is an improvement to the EfficientNet model by adding Residual Attention, which is an attention mechanism in its architecture. So, in this study six models are used that have attention mechanisms in their architectures. Furthermore, the four models with the best validation accuracy were combined using the ensemble stacking method with four different meta-learners namely decision trees, logistic regression, ANN, and SVM.
This experiment workflow is described into three main sets of operations: pre-processing of image data, model creation, and model combination using the ensemble stacking method. The workflow is described in Figure 1 and explained in the following subsections.
4.1 Dataset
In this work, the classification is conducted based on the APTOS 2019 dataset which is provided by Aravind Eye Hospital in India and is publicly available on the Kaggle website [7]. The dataset is consisted of 3662 high-resolution images, with each sample attached and diagnosed by highly trained doctors. The diagnosis is divided into 5 grades from 0 to 4 to present the severity level of diabetic retinopathy, where grade 0 includes 1805 images which indicates no diabetic retinopathy; grade 1, includes 370 images, indicating moderate no-proliferative; grade 3, which includes 193 images, indicate severe no-proliferative diabetic retinopathy, and grade 4 with 2995 images showing proliferative diabetic retinopathy.
4.2 Data pre-processing
The retinal images in APTOS2019 [7] dataset are very convenient and great to use for the severity classification of diabetic retinopathy. However, the dataset had some problems such as noisy images, an unbalanced dataset, and different resolutions. Thus, the dataset is pre-processed which mainly includes two sections:
Most images from the APTOS2019 [7] dataset contain black pixels that are on the image's edge. Because this black border does not provide any information regarding the classification of the severity of diabetic retinopathy, it can be removed with a simple crop operation. This operation is relatively easy to image the fundus where the entire fundus is within the border. However, most of the images are not completely within the black border so the top and bottom of the fundus image are cropped. In this case, we only remove the black border on the left and right sides.
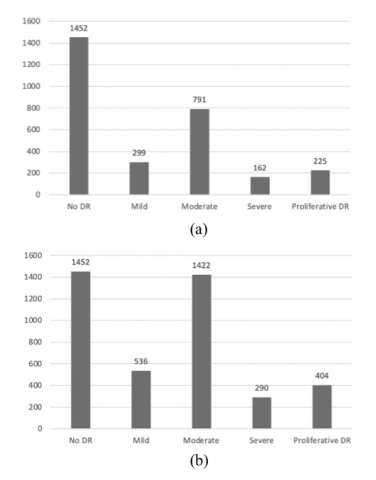
Another issue in this dataset as previously mentioned is the distribution of the dataset that is not balanced. To overcome the problem, various data augmentation techniques are applied such as changing image resolution to 224x224 (resizing), rotating images horizontally and vertically (flipping), rotating images with random degrees (rotating), enlarging images (zooming), and lighting settings. The data augmentation process is carried out on a training dataset in every class data except class 0, which is ‘No Diabetic Retinopathy. We use data augmentation to add each of the chosen class data with 80% of their original sizes. The dataset is divided into three parts: training, validation, and testing. Training and testing sets were divided with a ratio of 8:2, whereby 80% of the data is used for training, and the remaining 20% is for testing. Training data consists of 2929 data and validation data is consisted of 733 data. The 80% of training data were then further divided with the ratio of 75:25, whereby 75% of the data is used for training, and the remaining 25% is for validation. Class distribution for training data before and after data augmentation can be seen in Figure 2.
Figure 2. Class distribution of training data (a) before augmentation, (b) after augmentation
4.3 Modelling
Given that APTOS2019 [7] dataset gave insufficient and unbalanced datasets, it is more difficult to obtain a satisfactory result based on deep learning technology alone. To solve this problem, we adopted transfer learning technology in our model, by experimenting using six different architecture that is EfficientNet [11], EfficientNetV2 [12], LCNet [13], MobileNetV3 [14], TinyNet [15], and FBNetV3 [16]. Those architectures were already pre-trained on ImageNet and gives a satisfactory classification performance. The APTOS2019 [5] dataset was then fine-tuned in those pre-trained models and then trained with 0.001 learning rate using Adam optimizer, batch size of 16, and 150 of epoch. To prevent overfitting, we use an early stopping monitor to monitor the validation loss and configured it with 15 patience, and min delta of 0.005. for loss computing, we use categorical crossentropy.
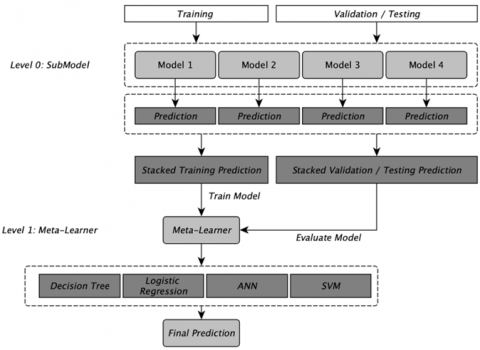
To further improve the accuracy results of this experiment, we combine the top four validation accuracy model using the ensemble stacking technique. The ensemble stacking technique we used is called the stacked generalization ensemble. In the ensemble stacking technique, an algorithm takes the output of a submodel as input and tries to learn the best way to combine the input predictions to give a better-predicted output. So, the workings of ensemble stacking can be divided into two levels, namely level 0 and level 1. Level 0 or commonly called a sub-model is a collection of models that will predict training data and then the predicted results of each of these sub-models will be forwarded to the meta-learner or level 1. Meta-learner takes the output from level 0 as input then the algorithm from the meta-learner is used to combine the output of each submodel and use it to train the meta-learner model. Thus, the meta-learner model will produce better predictions than the submodel. The visualisation of the ensemble stacking technique that is used in this experiment can be seen in Figure 3.
Figure 3. Proposed ensemble stacking method
In this paper, our experiment uses APTOS2019 [7] dataset to classify the severity of diabetic retinopathy. We experimented using six different deep learning architectures such as EfficientNet [11], EfficientNetV2 [12], LCNet [13], MobileNetV3 [14], TinyNet [15], and FBNetV3 [16] then combining the top four models that give the best validation accuracy, using ensemble stacking method. We also experimented to try different meta-learner algorithms such as logistic regression, SVM, decision tree, and ANN.
To evaluate the models, we use evaluation metrics such as accuracy, precision, recall, and F1-Score for comparison which can be seen in Eq. (1), Eq. (2), Eq. (3), and Eq. (4) respectively. Also, to evaluate every class of prediction, we use the average precision, recall, and F1-Score which can be seen in Eq. (5), Eq. (6), and Eq. (7). Furthermore, we also use confusion matrix to further investigate the proportion of samples of any class labeled as any of the possible outputs. These metrics are defined as follows:
$Overall-Accuracy=\frac{T 11+T 22+T 33+T 44+T 55}{A l l}$ (1)
$\operatorname{Precision}(i)=\frac{T_{i i}}{C_i^{\prime}}$ (2)
$\operatorname{Recall}(i)=\frac{T_{i i}}{C_i}$ (3)
$F 1 \operatorname{Score}(i)=2 \times \frac{\operatorname{precision}(i) \times \operatorname{recall}(i)}{\operatorname{precision}(i)+\operatorname{recall}(i)}$ (4)
Average Precision $=\frac{\sum \operatorname{precision}(i)}{N}$ (5)
Average Recall $=\frac{\sum \operatorname{recall}(i)}{N}$ (6)
Average $F 1-$ Score $=\frac{\sum F 1 \text { score }(i)}{N}$ (7)
5.1 Training and validation results
In these experiments we use 2929 images for training data, which is then split into training and validation by 75:25. We then evaluate six different pre-trained models which are EfficientNet [11], EfficientNetV2 [12], LCNet [13], MobileNetV3 [14], TinyNet [15], and FBNetV3 [16]. Furthermore, we combine the top four models with the best validation accuracy using the ensemble stacking technique, using four different meta-learners: logistic regression, SVM, decision tree, and ANN. The training and validation results of those six pre-trained models are presented in Table 1.
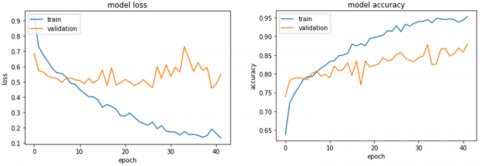
Based on the results from Table 1, we can see that the four best models which give the best validation accuracy are MobileNetV3 [14], EfficientNet [11], FBNetV3 [16], and TinyNet [15]. The validation accuracy of those four models is 86.89%, 86.60%, 86.02%, and 81.46% respectively. The loss and accuracy graph of the best model which is MobileNetV3 [14] can be seen in Figure 4.
After evaluating the validation accuracy of those models, the best four models which is MobileNetV3 [14], EfficientNet [11], FBNetV3 [16], and TinyNet [15] were then ensembled using ensemble stacking with four different meta-learner and the results can be seen in Table 2.
Table 1. Comparison of training and validation accuracy on different deep learning models
|
No |
Model |
Train loss |
Train accuracy |
Val. loss |
Val. accuracy |
|
1 |
EfficientNet |
0.1656 |
0.9453 |
0.4094 |
0.8660 |
|
2 |
EfficientNetV2 |
0.4275 |
0.8380 |
0.5346 |
0.7942 |
|
3 |
LCNet |
0.3563 |
0.8665 |
0.4592 |
0.8233 |
|
4 |
MobileNetV3 |
0.1903 |
0.9375 |
0.4574 |
0.8689 |
|
5 |
TinyNet |
0.3912 |
0.8594 |
0.4845 |
0.8146 |
|
6 |
FBNetV3 |
0.2552 |
0.9093 |
0.4462 |
0.8602 |
Figure 4. Accuracy and loss graph for MobileNetV3 architecture
Table 2. Comparison of training and validation accuracy on ensembled model
|
No |
Meta-learner |
Train accuracy |
Val. accuracy |
|
1 |
Logistic Regression |
0.9663 |
0.9553 |
|
2 |
SVM |
0.9617 |
0.9563 |
|
3 |
Decision Tree |
0.9970 |
0.9378 |
|
4 |
ANN |
0.9656 |
0.9533 |
Based on the results from Table 2, we can see that by using ensemble stacking method, we can significantly boost the training accuracy as high as 99.70% and validation accuracy to 95.63%, compared to 94.53% training and 86.89% accuracy before performing ensemble method. Decision tree meta-learner give the best training performance with 99.70% accuracy, and SVM meta-learner give the best validation performance with 95.63% accuracy.
5.2 Testing results
After training the models, we then test the models using testing data which consist of 733 data from APTOS2019 [7] dataset. Those 733 data was not trained before, so we can use it to further test the performance of our models. Testing results can be seen in Table 3.
Table 3. Comparison of testing accuracy on different deep learning models
|
No |
Model |
Testing accuracy |
|
1 |
EfficientNet |
0.8090 |
|
2 |
EfficientNetV2 |
0.8321 |
|
3 |
LCNet |
0.8130 |
|
4 |
MobileNetV3 |
0.8349 |
|
5 |
TinyNet |
0.8130 |
|
6 |
FBNetV3 |
0.8390 |
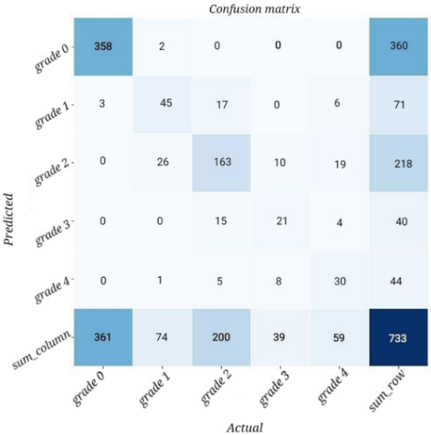
Figure 5. Confusion matrix of ensemble learning using ANN as meta-learner
Based on the testing accuracy results in Table 3, we can see that when we test each model, FBNetV3 [16] architecture gives the best results with a test accuracy of 83.90%, followed by MobileNetV3 [14] with a testing accuracy of 83.49%. After combining the top four validation accuracy of the models with ensemble stacking, we can see the testing results on four different meta-learners in Table 4.
Based on the results in Table 5, we can see that by using the ensemble stacking technique, we gain a little performance boost in testing accuracy when using logistic regression and ANN model as meta-learner with an accuracy of 84.17%.
The ANN model we use as a meta-learner was configured with an input layer of 20, 13 hidden layers, and 5 output layers. The model was trained using Adam optimization with an epoch of 15 and 128 batch sizes. To further analyze the testing results, we can observe the confusion matrix in Figure 5.
Table 4 Comparison with existing works for Diabetic Retinopathy severity grades on APTOS2019 dataset
|
Method |
Train Accuracy (%) |
Val. Accuracy (%) |
Test Accuracy (%) |
Average F1-Score (%) |
|
Bodapati et al. [6] |
NA |
80.96 |
NA |
NA |
|
Patel and Chaware [11] |
91.00 |
81.00 |
NA |
NA |
|
Yi et al. [7] |
93.55 |
NA |
NA |
NA |
|
Mungloo-Dilmohamud et al. [8] |
99.80 |
97.60 |
82.00 |
79.45 |
|
Minarno et al. [21] |
89.11 |
NA |
84.36 |
82.79 |
|
Our proposed method (ANN meta-learner) |
96.56 |
95.33 |
84.17 |
70.16 |
Table 5. Comparison of testing accuracy on different meta-learner in ensemble stacking
|
No |
Ensemble-model |
Test accuracy |
|
1 |
Logistic Regression |
0.8417 |
|
2 |
SVM |
0.8308 |
|
3 |
Decision Tree |
0.8144 |
|
4 |
ANN |
0.8417 |
Table 6. Performance metrics for ensemble learning using ANN as meta-learner
|
|
Precision |
Recall |
F1-Score |
|
Grade 0 |
0.9944 |
0.9917 |
0.9931 |
|
Grade 1 |
0.6338 |
0.6081 |
0.6207 |
|
Grade 2 |
0.7477 |
0.8150 |
0.7799 |
|
Grade 3 |
0.5250 |
0.5385 |
0.5316 |
|
Grade 4 |
0.6818 |
0.5085 |
0.5825 |
|
Average F1-Score |
0.7166 |
0.6923 |
0.7016 |
Based on the confusion matrix results in Figure 5, we can see that the model is giving an almost perfect result at predicting grade 0 data, which is 358 out of 360 total grade 0 images. Similar performance can be seen when predicting grade 1, grade 2, and grade 4 data.
As for grade 3 data, the model predicts half the data wrong, this can be happened because of the lack of data in that grade, and the characteristic of grade 3 data is very similar to grade 2 data, which is why half of those data was predicted as grade 2 data. Using the confusion matrix, we can also analyze the model performance using average precision, recall, and F1-Score which can be seen in Table 6.
From the performance metrics in Table 6, we found that F1-Score in Grade 0, gives the best results with 99.44% F1-Score. Other Grades such as Grade 1 and Grade 2 give reasonable F1-Score of 62.07% and 77.99% respectively. The remaining Grade which is Grade 3 and Grade 4 gives the lowest F1-Score performance compared to other Grade which is 53.16% and 58.25% respectively. Because of the low performance in Grade 3 and Grade 4, the average F1-Score is impacted and only gives results of 70%. A comparison of our proposed model with other works in diabetic retinopathy classification using APTOS2019 dataset is given in Table 4.
Compared to similar work carried out in the diabetic retinopathy classification using APTOS2019 dataset, our proposed method gives better testing accuracy with a score of 84.17% compared to recent work by Mungloo-Dilmohamud et al. [10] with a score of 82.00%. Our proposed model was trained using APTOS2019 dataset which has been augmented to further balance the class distribution of data and trained by combining four different deep learning models which are MobileNetV3 [14], EfficientNet [11], FBNetV3 [16], and TinyNet [15] using ensemble stacking method with ANN as meta-learner. As for F1-Score, Mungloo-Dilmohamud et al. [10] still gives a better result with 79.45%, compared to our proposed method with 70.16% F1-Score. Mungloo-Dilmohamud et al. [10] also gives a better result in training and validation accuracy, however, this can indicate that their model is more overfitting compared to us given that their testing accuracy is significantly lower compared to their validation accuracy. Although our work has better testing accuracy, Mungloo-Dilmohamud et al. [9, 10] had a different research design, where he split the data with 70% data for training and 30% data for testing compared to our work which split the data with 80% data in training and 20% in testing data.
Furthermore, our training accuracy gives better results with a score of 96.56% compared to Yi et al. [9] with 93.55% training accuracy and Patel and Chaware [13] with 91.00% accuracy. Moreover, our validation accuracy gives better results with a score of 95.33% compared to Bodapati et al. [8, 19] with 80.96% validation accuracy and Patel and Chaware [13] with 81.00% accuracy. Our work also gives better training accuracy results when compared to Minarno et al. [23] work. Although their research gives better test and F1-Score results, Minarno et al. [23] research uses a different proportion of training and validation compared to our work, and they use the EfficientNet-B7 model which has more parameters compared to the base EfficientNet-B0 model, thus needing more computational power, resulting with a model that is bigger in sizes.
Our proposed method has the same research design as those recent works [9, 17, 19]. Thus, we can claim that we made better training and validation accuracy compared to their work.
In this research, we experimented using six different deep-learning models to classify the severity of diabetic retinopathy. Out of those six models, the best performance we obtained is from MobileNetV3 [18] with a training accuracy of 93.75% and the validation accuracy of 86.89% and 83.62% for testing accuracy. To further improve the accuracy, we ensemble the top 4 models with the best accuracy, using four different meta learners like logistic regression, SVM, Decision Tree, and ANN, which is MobileNetV3 [14], EfficientNet [11], FBNetV3 [16], and TinyNet [15]. The best ensemble performance we obtained is when using ANN as meta learner, with a training accuracy of 96.56% and a validation accuracy of 95.33%. By using ensemble stacking, we gain a performance of 1.1% for training accuracy, and 8.64% for validation accuracy. As for the testing results, we only gain 0.27% of accuracy with the results of 84.17% compared to the best individual model performance. In conclusion, by using ensemble stacking, we can gain high performance for the validation accuracy, this happens because we stack each models predictions, so we can gain a significant performance for the validation performance. as for the training and testing results, there seems a little performance gain after ensembling the models.
This work only uses one dataset which is APTOS2019. To further improve this research, we can combine APTOS2019 dataset with a different dataset with higher and more balanced data. Also, we can try different ensemble methods like ensemble boosting, bagging, and other stacking technique like average ensembling.
[1] Guariguata, L., Whiting, D.R., Hambleton, I., Beagley, J., Linnenkamp, U., Shaw, J.E. (2014). Global estimates of diabetes prevalence for 2013 and projections for 2035. Diabetes Research and Clinical Practice, 103(2): 137-149. https://doi.org/10.1016/j.diabres.2013.11.002
[2] Olokoba, A.B., Obateru, O.A., Olokoba, L.B. (2012). Type 2 diabetes mellitus: A review of current trends. Oman Medical Journal, 27(4): 269-273. https://doi.org/10.5001/omj.2012.68
[3] http://www.depkes.go.id/resources/download/pusdatin/infodatin/infodatin-diabetes.pdf, accessed on Sept. 25, 2022.
[4] Islam, M.M., Yang, H.C., Poly, T.N., Jian, W.S., Li, Y.C. (2020). Deep learning algorithms for detection of diabetic retinopathy in retinal fundus photographs: A systematic review and meta-analysis. Comput Methods Programs Biomed, 191: 105320. https://doi.org/10.1016/j.cmpb.2020.105320
[5] Nasir, N., Afreen, N. Patel, R., Kaur, S., Sameer, M. (2021). A transfer learning approach for diabetic retinopathy and diabetic macular edema severity grading. Revue d’Intelligence Artificielle, 35(6): 497-502. https://doi.org/10.18280/ria.350608
[6] Akbar, S., Midhunchakkaravarthy, D. (2020). A novel filtered segmentation-based bayesian deep neural network framework on large diabetic retinopathy databases. Revue d’Intelligence Artificielle, 34(6): 683-692. https://doi.org/10.18280/ria.340602
[7] APTOS, APTOS 2019 Blindness Detection. 2019. https://www.kaggle.com/c/aptos2019-blindness-detection, accessed on Feb. 6, 2022.
[8] Bodapati, J.B., Naralasetti, V., Shareef, S.N., Hakak, S., Bilal, M., Maddikunta, P.K.R., Jo, O. (2020). Blended multi-modal deep convnet features for diabetic retinopathy severity prediction. Electronics (Switzerland), 9(6): 1-16. https://doi.org/10.3390/electronics9060914
[9] Yi, S.L., Yang, X.L., Wang, T.W., She, F.R., Xiong, X., He, J.F. (2021). Diabetic retinopathy diagnosis based on RA-efficientnet. Applied Sciences (Switzerland), 11(22): 11035. https://doi.org/10.3390/app112211035
[10] Mungloo-Dilmohamud, Z., Heenaye-Mamode Khan, M., Jhumka, K., Beedassy, B.N., Mungloo, N.Z., Peña-Reyes, C. (2022). Balancing data through data augmentation improves the generality of transfer learning for diabetic retinopathy classification. Applied Sciences, 12(11): 5363. https://doi.org/10.3390/app12115363
[11] Tan, M., Le, Q. (2021). EfficientNet: Rethinking model scaling for convolutional neural networks. https://doi.org/10.48550/arXiv.1905.11946
[12] Tan, M., Le, Q. (2021). EfficientNetV2: Smaller models and faster training. https://doi.org/10.48550/arXiv.2104.00298
[13] Yu, H., Zhang, L. (2020). LCNet: A light-weight network for object counting. In: Yang, H., Pasupa, K., Leung, A.CS., Kwok, J.T., Chan, J.H., King, I. (eds) Neural Information Processing. ICONIP 2020. Lecture Notes in Computer Science, 12532. https://doi.org/10.1007/978-3-030-63830-6_35
[14] Howard, A., Sandler, M., Chen, B., Wang, W., Chen, L.C., Tan, M., Chu, G., Vasudevan, V., Zhu, Y., Pang, R. (2019). Searching for MobileNetV3. 2019 IEEE/CVF International Conference on Computer Vision (ICCV). https://doi.org/10.1109/ICCV.2019.00140
[15] Han, K., Wang, Y., Zhang, Q., Zhang, W., Xu, C., Zhang, T. (2020). Model Rubik’s cube: twisting resolution, depth and width for TinyNets. https://doi.org/10.48550/arXiv.2010.14819
[16] Dai, X., Wan, A., Zhang, P., Wu, B., He, Z., Wei, Z., Chen, K., Tian, T., Yu, M., Vajda, P. (2020). FBNetV3: Joint architecture-recipe search using predictor pretraining. 2021 IEEE/CVF Conference on Computer Vision and Pattern Recognition (CVPR). https://doi.org/10.1109/CVPR46437.2021.01601
[17] Dondeti, V., Bodapati, J.D., Shareef, S.N., Naralasetti, V. (2020). Deep convolution features in non-linear embedding space for fundus image classification. Revue d’Intelligence Artificielle, 34(3): 307-313. https://doi.org/10.18280/ria.340308
[18] Majumder, S., Kehtarnavaz, N. (2021). Multitasking deep learning model for detection of five stages of diabetic retinopathy. IEEE Access, 9: 123220-123230. https://doi.org/10.1109/ACCESS.2021.3109240
[19] Patel, R., Chaware, A. (2020). Transfer learning with fine-tuned MobileNetV2 for diabetic retinopathy. International Conference for Emerging Technology (INCET), pp. 1-6.
[20] Islam, M.R., Al Mehedi Hasan, M., Sayeed, A. (2020). Transfer learning based diabetic retinopathy detection with a novel preprocessed layer. 2020 IEEE Region 10 Symposium (TENSYMP), pp. 888-891. https://doi.org/10.1109/TENSYMP50017.2020.9230648
[21] Sikder, N., Chowdhury, M.S., Shamim Mohammad Arif, A., Al Nahid, A. (2019). Early blindness detection based on retinal images using ensemble learning. 2019 22nd International Conference on Computer and Information Technology, ICCIT 2019, pp. 18-20. https://doi.org/10.1109/ICCIT48885.2019.9038439
[22] Sikder, N., Masud, M., Bairagi, A.K., Arif, A.S.M., Al Nahid, A., Alhumyani, H.A. (2021). Severity classification of diabetic retinopathy using an ensemble learning algorithm through analyzing retinal images. Symmetry (Basel), 13(4): 670. https://doi.org/10.3390/sym13040670
[23] Minarno, A., Cokro Mandiri, M., Azhar, Y., Bimantoro, F., Nugroho, H., Ibrahim, Z. (2020). Classification of diabetic retinopathy disease using convolutional neural network. JOIV: International Journal on Informatics Visualization, 6(1): 12-18. https://doi.org/10.30630/joiv.6.1.857