Lubna Riyaz* | Muheet A. Butt | Majid Zaman
© 2022 IIETA. This article is published by IIETA and is licensed under the CC BY 4.0 license (http://creativecommons.org/licenses/by/4.0/).
OPEN ACCESS
In the last decade, heart diseases have become the leading cause of deaths in the world. Various risk factors associated with heart disease include age, gender, cholesterol levels, blood pressure, glucose levels, chest pain, obesity, stress, family history, etc. with the help of which heart diseases can be predicted in any patient. In the past decade or so various efforts have been made by the researchers for effective prediction of various heart diseases. In this paper, a novel ensemble deep learning model has been proposed for efficient prediction of coronary heart disease. The dataset used for this purpose is collected from the Framingham heart disease database. Different performance evaluation metrics including precision, accuracy, recall and f1-score are being used for evaluating the performance of the proposed model. As per the experimental results, the proposed ensemble model outperformed most of the conventional machine learning techniques in terms of accuracy, precision, recall and f1 score for coronary heart disease prediction.
coronary heart disease, ensemble learning, prediction, Framingham, multilayer perceptron
Heart is a vital organ in the human body. It supplies blood to different body parts. A slight deviation in the normal working of the heart can affect the overall functioning of the body. Therefore heart health is necessary for a person to survive. In the last decade or so heart diseases have been the primary reason of deaths in the world. In USA alone, one in every four deaths occurs because of heart disease [1]. Various risk factors associated with heart disease include age, gender, cholesterol levels, blood pressure, glucose levels, chest pain, obesity, stress and family history etc. With the help of these factors one can predict the presence or absence of a heart disease in a patient. According to Centers for Disease Control and Prevention (CDC), the most common risk factors for heart disease include high blood pressure, high blood cholesterol levels and smoking [2]. Other risk factors include diabetes, obesity, unhealthy diet, physical inactivity and excessive consumption of alcohol. According to WHO (World Health Organization), the major underlying determinants of heart diseases include social, economic and cultural changes including globalization, urbanization and population ageing, poverty, stress and hereditary factors [3]. The various conditions of heart disease include coronary artery disease, valvular heart disease, cardiomyopathy, heart rhythm disturbances and various heart infections [4].
Coronary artery or the coronary heart disease is the most common type of heart disease in today’s world. It is the major cause of deaths in the United States. Coronary heart disease is sometimes also called as the ischemic heart disease or simply a heart disease. Cholesterol deposits or plaques in heart arteries are the major reason behind coronary heart disease. Coronary arteries are vessels whose job is to supply oxygen-rich blood to the heart. Coronary heart disease starts with deposition of fats on the artery walls known as atherosclerosis leading to narrowing of heart arteries. The heart shows symptoms of coronary heart disease when it is not getting sufficient oxygen rich blood, hence reducing the amount of blood flowing to the heart which in turn leads to chest pain and shortness of breath [5]. If the blood flow is completely blocked, it can result in a heart attack.
Coronary heart disease may take decades to develop and can go unnoticed for a long time. Thus, detection of coronary heart disease at an early stage is quite necessary. The symptoms for coronary heart disease usually include chest pain, shortness of breath, fatigue (tiredness), dizziness, nausea and weakness and in case women the symptoms can be little bit different causing discomfort in shoulders, indigestion problem, anxiety and cold sweat [6] and sometimes a patient will not be knowing that he/ she has a coronary heart disease until the patient gets a heart attack [6]. The risk of coronary heart disease increases if there is a family history of coronary heart disease [7]. Angina is a term that is normally used to describe the most common symptoms of coronary heart disease [8].
In the past decade, efforts have been made by various researchers for effective prediction of heart disease [9-36] and various other diseases [37, 38] using machine learning. In this study, a novel ensemble deep learning model has been proposed for effective prediction of coronary heart disease. The dataset is obtained from the Framingham heart disease database. In the first step, data preprocessing was done followed by selection of the most significant features from the dataset for the prediction purpose. Finally, a deep learning multilayer perceptron classifier was trained three times each time using a different instance of training and testing set. Then, in the final step, the outputs from these three classifiers instances were fed into an ensemble majority voting classifier to produce the final results. Upon observation, it was found that ensembling resulted in increase in accuracy of the classifier.
The rest of this paper is organized as follows. Section 2 gives the description of the literature. Section 3 describes ensemble learning and multilayer perceptron. Section 4 describes the methodology, section 5 is the results and discussion section and section 6 summarizes the conclusion.
In the literature various previous studies related to heart disease prediction were reviewed.
In a study, Shouman et al. [9] have used various types of decision trees for improving the prediction of heart disease. Sensitivity, specificity and accuracy are used to evaluate the model performance. In another study, Subbalakshmi et al. [10] have performed the prediction of heart disease using naïve bayes algorithm by developing a Decision Support in Heart Disease Prediction System (DSHDPS) along with a web based questionnaire application. However, the performance of the proposed system wasn’t that much satisfiable. In another study, Anooj [21] proposed a clinical decision support system using weighted fuzzy rules for heart disease prediction and compared the experimental results with other studies.
In another study, Pattekari and Parveen [22] proposed an intelligent heart disease prediction system based on naïve bayes technique and implemented as a web based application. In a study, Pandey et al. [23] have developed a heart disease prediction system using decision tree machine learning algorithm. For performing the task of prediction, 14 most significant features have been selected. Then, J48 decision tree has been used to build a prediction model for heart disease prediction. As per the experimental results, pruned J48 algorithm with reduced error has performed better as compared to the simple pruned and unpruned techniques. In another study, Medhekar et al. [24] proposed a system for heart disease prediction using naïve bayes. Classification has been done for a 5 class classification problem by dividing the chances of heart disease into 5 categories i.e. no, low, average, high and very high. According to the results, the proposed system was able to achieve the average accuracy of 89.10% on Cleveland heart disease dataset. In another study Sonawane and Patil [25] proposed a heart disease prediction system using learning vector quantization algorithm that takes as input the 12 most significant features and performs the task of classification based on these 12 significant features. According to the results, it was found that the system was able to achieve the highest accuracy of 85.55%.
Sabarinathan and Sugumaran [26] proposed a heart disease prediction using decision tree classification technique. The proposed system was able to achieve an overall accuracy of 85% on the test set. Cong et al. [27] proposed a firefly based algorithm for heart disease prediction using reduced number of features. For reducing the number of features, the proposed firefly algorithm has been combined with the rough sets thereby reducing the dimensionality of the dataset. In a study Ismaeel et al. [28] performed heart disease prediction using extreme learning machine considering various factors related to heart disease. The proposed system can give a warning to a patient at the earliest possible stage. The data has been taken from the Cleveland dataset containing 300 records of patients. The proposed architecture has achieved the overall accuracy of 80% for predicting heart disease. In another study, Singh et al. [11] also proposed a study for heart disease prediction. As per the results, the proposed system was able to achieve an overall accuracy of 85.81% for heart disease prediction.
In a study Purushottam et al. [12] proposed a system for heart disease prediction using association rules. Training and testing of model has been done using the 10 fold cross validation for efficient prediction of heart disease. According to the results, the proposed system achieved an overall accuracy of 86.7% for diagnosing heart disease [12]. Another study carried out by Gupta et al. [13] performed efficient prediction of heart disease using naïve bayes. According to the results the system was able to achieve the prediction accuracy of 86.42%. Reddy and Khare [14] in their study performed prediction of heart disease using hybrid using oppositional firefly with BAT where firstly the significant features were selected from the dataset and then the fuzzy rules were being created for the said data. The dataset is obtained from the UCI machine learning repository. The proposed system was able to achieve an accuracy of 78% on the said dataset [14].
Haq et al. [15] proposed a system for heart disease prediction using intelligent hybrid architecture employing various machine learning techniques. A total of 7 machine learning techniques were used in this study. According to the results, the reduced set of features has showed a notable improvement in classification accuracies [15]. Vijayashree and Sultana [16] used PSO (Particle Swarm Optimization) with SVM for selecting features for heart disease prediction. For increasing the accuracy the number of features has been reduced. As per the results the proposed model has showed a significant improvement in the results [16].
In another study proposed by Mohan et al. [17], the authors have developed a novel method by hybridizing some of the common machine learning algorithms for efficient prediction of heart disease. Different combinations of available attributes have been tested. The proposed system was able to achieve the overall accuracy of 88.7% [17]. Singh and Kumar [18] proposed a model using various machine learning techniques for effective prediction of heart disease. The dataset was collected from the UCI machine learning repository. As per their results, the k nearest neighbour algorithm was able to produce better results among all classifiers [18].
Jindal et al. [19] proposed a study for heart attack prediction using machine learning techniques. Two machine learning classifiers logistic regression and k nearest neighbour were used for doing the prediction. According to the results, these two classifiers showed the better results than the other available machine learning classifiers [19]. Riyaz et al. [20] proposed a study for heart disease prediction using machine learning. According to their results, the ANN (Artificial Neural Network) technique produced better results as compared to others achieving an overall average accuracy of 86.91%. El-Hasnony et al. [36] proposed another machine learning model for heart disease diagnosis using multi label active learning based technique. As per the authors, the proposed technique was able to achieve an accuracy of 57.4 ± 4% [36].
Table 1 gives a description of the currently existing studies for heart disease prediction.
Table 1. Existing studies
|
Author |
Technique used |
Accuracy achieved |
|
Shouman et al. [9] |
Decision Tree |
84.10% |
|
Pandey et al. [23] |
Pruned J48 Decision Tree |
75.73% |
|
Medhekar et al. [24] |
Naïve Bayes |
89.10% |
|
Sonawane et al. [25] |
Learning Vector Quantization Algorithm |
85.55% |
|
Sabarinathan et al. [26] |
Decision Tree |
85% |
|
Cong et al. [27] |
Fuzzy logic system |
88.3% |
|
Ismaeel et al. [28] |
Extreme Learning Machine |
80% |
|
Purushottam et al. [12] |
Association Rules |
86.7% |
|
Gupta et al. [13] |
Naïve Bayes |
86.42% |
|
Reddy et al. [14] |
Fuzzy logic |
78% |
|
Haq et al. [15] |
Logistic Regression |
89% |
|
Viijayashree et al. [16] |
Particle Swarm Optimization |
88.22% |
|
Mohan et al. [17] |
Hybrid model |
88.7% |
|
Singh et al. [18] |
K Nearest Neighbors |
87% |
|
Jindal et al. [19] |
K Nearest Neighbors |
88.52% |
|
El-Hasnony et al. [36] |
Multi label active learning |
57.4% |
3.1 Ensemble learning
In ensemble learning, multiple models (including classifiers and experts) are combined in order to solve a particular problem. It is basically done to improve the overall performance of the model by reducing the chance of selecting the wrong one. More applications include assigning confidence to a model decision, selecting optimal features and incremental learning etc.
Ensemble classifier is achieved by aggregating various models (classifiers or experts) together sometimes also called as the multiple classifier systems. In ensembling the results from various models are combined into a single one in order to obtain the final results which are the improved ones. Ensembling can be understood from psychological point of view like before making any decision in our daily lives, suggestions from multiple experts are taken into consideration before making the final decision. Examples include prior to starting any medical procedure, before buying any item, article reviewing before acceptance, etc., same is the case with ensemble learning. In doing so, the main focus is on reducing the chance of selecting the wrong one. The process of ensemble learning is shown in Figure 1.
Figure 1. Ensemble learning
Firstly, the dataset is split into two subsets, training set and the testing set. Then, the models are trained using the said training set and eventually tested. Finally, the results from all models are being fed into the voting model in order to combine all the models and return the final prediction.
3.1.1 Bagging
Bagging, also known as bootstrap aggregation, is the ensemble learning method that is commonly used to reduce variance within a noisy dataset. In bagging, a random sample of data in a training set is selected with replacement-meaning that the individual data points can be chosen more than once.
After several data samples are generated, these weak models are then trained independently, and depending on the type of task-regression or classification, for example-the average or majority of those predictions yield a more accurate estimate. The algorithm for bagging is shown as under:
1. Select records from your dataset, with replacement, to get bootstrapped dataset.
2. Train a base classifier using this subset dataset, normally the base classifier used for this purpose is decision tree.
3. Keep repeating 1 and 2 ‘N’ times where N is a pre-chosen number.
4. Combine all N classifiers together into a single rule.
3.1.2 Boosting
Boosting works like bagging. A family of models is being created combined for getting more robust learner that could perform finer. Boosting sequentially combines various weak classifiers, each time more importance is being given to the wrongly classified records by preceding classifiers.
The algorithm for boosting is shown as under:
1. Initialize dataset while assigning same weights to all the observations.
2. Input this to the first classifier and locate the wrongly classified ones.
3. Increase weights of wrongly classified observations.
4. Update the weight of the dataset and send it back to the model.
5. Repeat steps 2-4 until all wrongly classified data points are fixed.
6. End
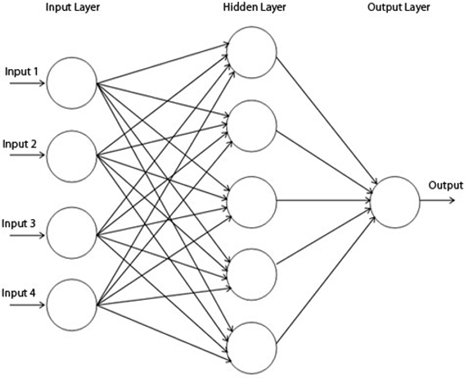
3.2 Multilayer perceptron
Figure 2. Multilayer perceptron
A multilayer perceptron (MLP) is a fully connected feed forward artificial neural network (ANN) that learns a function $f():. R^m \rightarrow R^{\circ}$ by training on a dataset, where $\mathrm{m}$ represents the input dimensions and $o$ is the dimension of the output. Given a set of features $X=x_1, x_2, \ldots, x_m$ and a target $\mathrm{y}$, an MLP can learn a non-linear function approximation for classification or regression.
The term MLP is used ambiguously, sometimes to mean any feed forward neural network and sometimes to specifically refer to networks composed of multiple perceptron layers. If the multilayer perceptron contains only a single layer, then it is called as the vanilla neural network. A multilayer perceptron consists of three sets of layers containing nodes: an input layer, one or more hidden layers and an output layer. Multilayer perceptron uses the backpropagation supervised learning technique. A multilayer perceptron is used when the data is not linearly separable. Figure 2 shows one instance of a multilayer layer perceptron neural network with only one hidden layer.
The nodes in case of a multilayer perceptron are connected as a linked directed graph starting from input and ending at the output layers. Except for the input nodes, all other nodes have an activation function. The input data enters through the input layer, propagates through one or more hidden layers and finally reaches the output layer which returns the final output. The outputs from one layer act as input to the next layer. Each node of the hidden layer converts the values from the previous layer with a weighted linear summation $w_1 x_1+w_2 x_2+\cdots+$ $w_m m$, followed by a non-linear activation function $g():. R \rightarrow$ $R$ - like a hyperbolic tan function. For training the network, the multilayer perceptron uses backpropagation.
The dataset for this study was collected from the Framingham heart disease database which is an ongoing heart disease study from the people of Framingham, USA. The dataset contains 4240 records of patients with 15 attributes and one target attribute. The description of the said dataset is given in Table 2. Figure 3 shows the correlation matrix of attributes.
Figure 3. Correlation matrix
Prior to training and testing of the model, proper preprocessing of the data was done. In the very first step null values were identified in the data. Out of 4240 records of patients, there were 582 records with missing values. For each attribute, the missing values were handled differently. For attribute education, the records with missing values were considered illiterate and hence were filled with the value “0”. The cigsPerDay attribute was applicable to those patients only for whom the value of the currentSmoker attribute was equal to 1, hence the missing values for this attribute were filled by calculating the median of cigsPerDay attribute values for those records only for which the value of currentSmoker attribute was equal to 1.
Table 2. Framingham heart disease dataset description
|
S. No. |
Attribute |
S. No. |
Attribute |
|
1 |
Gender of the patient (male) |
10 |
Total Cholesterol levels |
|
2 |
Age (age) |
11 |
Systolic BP |
|
3 |
Education |
12 |
Diastolic BP |
|
4 |
Whether Current Smoker |
13 |
Body Mass Index (BMI) |
|
5 |
No. of cigarettes smoking per day |
14 |
Heart Rate |
|
6 |
Whether on Blood Pressure medication |
15 |
Glucose levels |
|
7 |
History of any stroke |
16 |
TenYearCHD (Target variable) |
|
8 |
Whether Hypertensive |
|
|
|
9 |
Whether having Diabetes |
|
|
The missing values in case of attribute BPMeds were assumed that they were not taking any blood pressure medicine at all, hence its missing values were filled with value 0. In case of attributes totChol and BMI, the missing values were filled by calculating the median values of the rest of the records for respective attributes. For attribute heartRate, there was only one record with missing value and that too of a current smoker, hence its missing value was filled with the median of heartRate attribute values of all those records for which the value of currentSmoker attribute was equal to 1. For attribute glucose, the majority of the missing values belonged to the non-diabetic category, hence its missing values were filled by calculating the median of attribute glucose values for non-diabetic patients. Upto this point all the records with null values were successfully handled in our dataset.
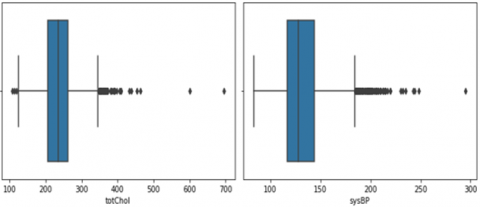
Then, in the next step detection of outliers was performed. Removable outliers were found in totChol and sysBP columns and were removed accordingly since outliers in data can affect the overall performance of the model. Figure 4 shows the plot representation of the outliers present. A total of three removable outliers were detected in our dataset, two in totChol (600 & 696) and one in sysBP column (295).
Figure 4. Plots showing outliers
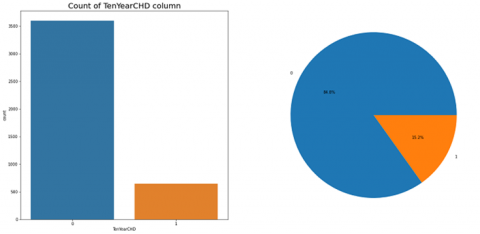
After successful removal of outliers, the dataset was then left with 4237 records of patients only. Then in the next step the dataset was tested for imbalance, it was observed that the dataset was highly imbalanced since the number of records with target value 0 were much higher in number than those with target value 1 (Figure 5).
Figure 5. Plot showing number of instances for each of the two target values
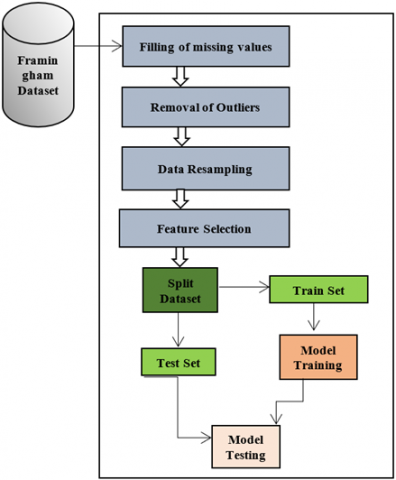
Hence resampling of the data was done by oversampling the positive (value 1) cases in such a way that number of positive and number of negative cases became equal to each other thereby increasing the size of the dataset to 7190 records of patients. Figure 6 shows the block diagram of the proposed model.
Figure 6. Block diagram of the proposed model
After resampling of the available dataset, the task of feature selection was done by selecting the most significant features from the dataset based on the IG (Information Gain) value for each attribute. Table 3 shows the list of attributes in the descending order of their information gain values. Out of the total attributes, the top ten most significant attributes were selected from the dataset for prediction purpose while dropping the remaining ones.
The top ten most significant features were selected for coronary heart disease prediction including BMI, sysBP, totChol, age, diaBP, heartRate, prevalentHyp, glucose, cigsPerDay and male, and the features which were not considered included education, prevalentStroke, BPMeds, currentSmoker and diabetes. After feature selection, the dataset was then split into two subsets, training set (80%) and testing set (20%) three times, each time using a different combination of records for training and testing of the multilayer perceptron (MLP) classifier. Data scaling was also performed in order to scale our features to a given range. Hyper parameter tuning for each instance of the multilayer perceptron classifier was also performed in order to increase the prediction accuracy. The best hyper parameters found for each instance of a multilayer perceptron classifier are shown in Table 4. From the table it can be seen that the best hyper parameters chosen for ‘activation’, ‘alpha’, and ‘solver’ remained same throughout all instances that is tanh, 0.0001and lbfgs respectively, however, for hyper parameter ‘learning rate’ only it varied.
Table 3. List of attributes in the descending order of their information gain values
|
S. No. |
Attributes |
|
1 |
BMI |
|
2 |
sysBP |
|
3 |
totChol |
|
4 |
age |
|
5 |
diaBP |
|
6 |
heartRate |
|
7 |
prevalentHyp |
|
8 |
glucose |
|
9 |
cigsPerDay |
|
10 |
male |
|
11 |
education |
|
12 |
prevalentStroke |
|
13 |
BPMeds |
|
14 |
currentSmoker |
|
15 |
diabetes |
Table 4. Best parameters found for multilayer perceptron after Hyperparameter tuning
|
|
activation |
alpha |
learning rate |
solver |
|
mlp1 |
tanh |
0.0001 |
constant |
lbfgs |
|
mlp2 |
tanh |
0.0001 |
invscaling |
lbfgs |
|
mlp3 |
tanh |
0.0001 |
constant |
lbfgs |
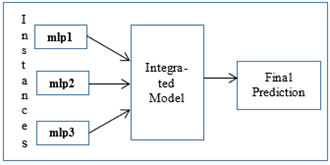
Figure 7. Integrated model
The results achieved by each of the three multilayer perceptron instances are shown in Tables 5, 6 and 7 respectively. Finally, the results from the three multilayer perceptron layers were fed into an ensemble majority voting integrated classifier (as shown in Figure 7) which performed the final prediction based on the output from these three classifiers. The final results after ensembling are shown in Table 8.
Data preparation and experimental steps have already been explained. Now, in this section we present the experimental results and discussion part. Tables 5-7 show the experimental results for each of the three multi-layer perceptron instances for coronary heart disease prediction. Precision, recall, f1 score, support and accuracy performance metrics were used to evaluate the model efficiencies. Precision is the ratio of correctly predicted positive records to the total predicted positive records. Recall is the ratio of correctly predicted positive records to all the records in actual positive class. F1 score is the weighted average of precision and recall. Support is the number of actual occurrences of each class in the given dataset. And accuracy is the ratio of correctly predicted records to the total records in the dataset. Table 5 shows the results of the first instance of the multilayer perceptron classifier. The results achieved were as 93% precision, 92% recall, 92% f1-score and 92% accuracy. For second instance the results achieved were as 92% precision, 91% recall, 91% f1-score and 91% accuracy and for third instance the results obtained are as 91% precision, 90% recall, 90% f1-score and 90% accuracy as shown in Tables 5-7.
Table 5. Results achieved by instance mlp1
|
|
Precision |
Recall |
F1-score |
Support |
|
0 |
0.99 |
0.85 |
0.91 |
725 |
|
1 |
0.86 |
0.99 |
0.92 |
713 |
|
accuracy |
|
|
0.92 |
1438 |
|
macro average |
0.93 |
0.92 |
0.92 |
1438 |
|
weighted average |
0.93 |
0.92 |
0.92 |
1438 |
Table 6. Results achieved by instance mlp2
|
|
Precision |
Recall |
F1-score |
Support |
|
0 |
0.99 |
0.84 |
0.91 |
737 |
|
1 |
0.85 |
0.99 |
0.91 |
701 |
|
accuracy |
|
|
0.91 |
1438 |
|
macro average |
0.92 |
0.91 |
0.91 |
1438 |
|
weighted average |
0.92 |
0.91 |
0.91 |
1438 |
Table 7. Results achieved by instance mlp3
|
|
Precision |
Recall |
F1-score |
Support |
|
0 |
0.98 |
0.82 |
0.89 |
704 |
|
1 |
0.85 |
0.98 |
0.91 |
734 |
|
accuracy |
|
|
0.90 |
1438 |
|
macro average |
0.91 |
0.90 |
0.90 |
1438 |
|
weighted average |
0.91 |
0.90 |
0.90 |
1438 |
Table 8. Results achieved after ensembling
|
|
Precision |
Recall |
F1-score |
Support |
|
0 |
0.99 |
0.88 |
0.93 |
725 |
|
1 |
0.89 |
0.99 |
0.94 |
734 |
|
accuracy |
|
|
0.94 |
1438 |
|
macro average |
0.94 |
0.94 |
0.94 |
1438 |
|
weighted average |
0.94 |
0.94 |
0.94 |
1438 |
The results from these three multi-layer perceptron classifier instances were then fed into a majority voting ensemble classifier to perform the final prediction. The results obtained are shown in Table 8.
The final results achieved after ensembling the three multi-layer perceptron instances were as follows: precision (94%), recall (94%), f1-score (94%) and accuracy (94%) as shown in table (Table 8). From the results it can be clearly seen that after ensembling of classifiers, the precision, recall, f1-score and accuracy of the model increased upto a large extent. This is due to the fact that in ensembling the final output is decided based on the outputs from multiple classifiers instead of any single individual classifier, multiple classifiers are trained at the same time and then the final prediction is done by combining the outputs from all the individual classifiers to produce the final output hence resulting in improved model efficiencies.
Table 9 compares the results of the proposed ensemble model with some of the common machine learning classifiers.
Table 9. Comparison of results with other machine learning classifiers
|
|
Precision |
Recall |
F1-Score |
Accuracy |
|
Logistic Regression |
68% |
68% |
68% |
68% |
|
Decision Tree |
92% |
91% |
91% |
91% |
|
SVM |
69% |
68% |
68% |
68% |
|
Multinomial Naïve Bayes |
62% |
61% |
61% |
61% |
|
K Nearest Neighbors |
80% |
78% |
78% |
78% |
|
AdaBoost |
70% |
69% |
69% |
69% |
|
Gradient Boosting |
72% |
71% |
71% |
71% |
|
Multilayer Perceptron |
93% |
92% |
92% |
92% |
|
Proposed Ensemble Model |
94% |
94% |
94% |
94% |
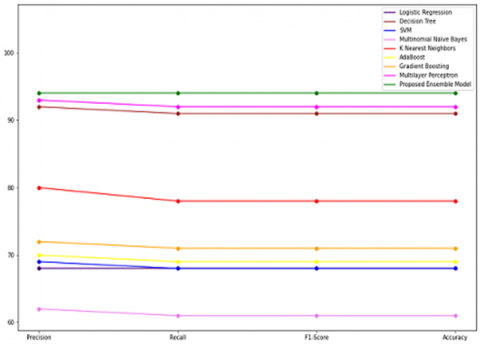
Figure 8. Performance comparison
From Table 9, it is evident that the proposed model outperformed most of the individual machine learning classifiers in terms of accuracy, precision, recall and f1 score for coronary heart disease prediction using common preprocessed data. Figure 8 shows the graphical representation of the performance comparison between some of the individual machine learning classifiers and the proposed ensemble classifier. Therefore, it was concluded that ensembling improves the overall efficiency of any machine learning classifier by combining the outputs from multiple classifiers. Hence this study suggests use of ensemble learning for coronary heart disease prediction.
Heart disease is the most prominent cause of deaths in the world today. As per WHO, it accounts for almost 18 million deaths per year. Therefore, detection of heart disease at an early stage is vital if we want to save human lives in near future. The focus of this study was solely on prediction of one of the types of heart disease known as the coronary heart disease using ensemble deep learning. Coronary heart disease is mainly caused by the buildup of plaque on the artery walls. Firstly the dataset was collected from the Framingham heart study database which is an ongoing cardiovascular study of the people from Framingham city in US. Then, the data was tested for any missing value and handled accordingly. In the next step outliers were removed from the dataset. In the next step the dataset was balanced. Feature selection was also performed by selecting the 10 most significant features based on their IG values for coronary heart disease prediction. Finally, the dataset was split into train and test set for training and testing of classifiers. In the last step, performance evaluation of the proposed ensemble model was done by comparing the results of the proposed ensemble deep learning model with some of the existing machine learning classifiers. According to the results, it was evident that the proposed ensemble deep learning model outperformed most of the existing machine learning classifiers in terms of accuracy, precision, recall and f1-score for coronary heart disease prediction. Hence, it was concluded that ensembling improves the overall efficiency of the individual models by combining the results from multiple classifiers into a single one thereby returning the final predicted output. In future, a more robust dataset can be obtained by collecting the data from multiple sources instead of a single one using data fusion approach for further improving the efficiency. In addition to this, model efficiencies can further be improved by assigning different weights to different attribute instead of a single general weight using some feature weighting technique for more improved results.
[1] https://www.healthline.com/health/heart-disease
[2] https://www.cdc.gov/heartdisease/about.htm
[3] https://www.who.int/news-room/fact-sheets/detail/cardiovascular-diseases-(cvds)
[4] https://www.medicinenet.com/heart_disease_coronary_artery_disease/article.htm
[5] https://www.mayoclinic.org/diseases-conditions/coronary-artery-disease/symptoms-causes/syc-20350613
[6] https://my.clevelandclinic.org/health/diseases/16898-coronary-artery-disease
[7] https://www.cancer.gov/publications/dictionaries/cancer-terms/def/coronary-heart-disease
[8] https://www.bhf.org.uk/informationsupport/conditions/coronary-heart-disease
[9] Shouman, M., Turner, T., Stocker, R. (2011). Using decision tree for diagnosing heart disease patients. In Proceedings of the 9-th Australasian Data Mining Conference (AusDM'11), Ballarat, Australia, pp. 23-30.
[10] Subbalakshmi, G., Ramesh, K., Rao, M.C. (2011). Decision support in heart disease prediction system using naive bayes. Indian Journal of Computer Science and Engineering (IJCSE), 2(2): 170-176.
[11] Singh, Y.K., Sinha, N., Singh, S.K. (2017). Heart disease prediction system using random forest. In Advances in Computing and Data Sciences First International Conference, ICACDS 2016, Ghaziabad, India, pp. 613-623. https://doi.org/10.1007/978-981-10-5427-3_63
[12] Purushottam, Saxena, Sharma, R. (2016). Efficient heart disease prediction system. Procedia - Procedia Comput. Sci., 85: 962-969. https://doi.org/10.1016/j.procs.2016.05.288
[13] Gupta, N., Ahuja, N., Malhotra, S., Bala, A., Kaur, G. (2016). Intelligent heart disease prediction in cloud environment through ensembling. Expert Systems, 34(3): e12207. https://doi.org/10.1111/exsy.12207
[14] Reddy, G.T., Khare, N. (2017). An effcient system for heart disease prediction using hybrid OFBAT with rule-based fuzzy logic model. Journal of Circuits, Systems and Computers, 26(4): 1750061. https://doi.org/10.1142/S021812661750061X
[15] Haq, A.U., Li, J.P., Memon, M.H., Nazir, S., Sun, R. (2018). A hybrid intelligent system framework for the prediction of heart disease using machine learning algorithms. Mobile Information Systems, 2018: 3860146. https://doi.org/10.1155/2018/3860146
[16] Vijayashree, J., Sultana, H.P. (2018). A machine learning framework for feature selection in heart disease classification using improved particle swarm optimization with support vector machine classifier. Programming and Computer Software, 44(6): 388-397. https://doi.org/10.1134/S0361768818060129
[17] Mohan, S., Thirumalai, C., Srivastava, G. (2019). Effective heart disease prediction using hybrid machine learning techniques. IEEE Access, 7: 81542-81554. https://doi.org/10.1109/ACCESS.2019.2923707
[18] Singh, A., Kumar, R. (2020). Heart disease prediction using machine learning algorithms. 2020 International Conference on Electrical and Electronics Engineering (ICE3), Gorakhpur, India, pp. 452-457. https://doi.org/10.1109/ICE348803.2020.9122958
[19] Jindal, H., Agrawal, S., Khera, R., Jain, R., Nagrath, P. (2021). Heart disease prediction using machine learning algorithms. IOP Conf. Ser. Mater. Sci. Eng., 1022: 012072. https://doi.org/10.1088/1757-899X/1022/1/012072
[20] Riyaz, L., Butt, M.A., Zaman, M., Ayob, O. (2022). Heart disease prediction using machine learning techniques: A quantitative review. International Conference on Innovative Computing and Communications. Advances in Intelligent Systems and Computing, pp. 81-94. https://doi.org/10.1007/978-981-16-3071-2_8
[21] Anooj, P.K. (2012). Clinical decision support system : Risk level prediction of heart disease using weighted fuzzy rules. J. King Saud Univ. - Comput. Inf. Sci., 24(1): 27-40. https://doi.org/10.1016/j.jksuci.2011.09.002
[22] Pattekari, S.A., Parveen, A. (2012). Prediction system for heart disease using naive bayes. International Journal of Advanced Computer and Mathematical Sciences, 3(3): 290-294.
[23] Pandey, A.K., Pandey, P., Jaiswal, K.L., Sen, A.K. (2013). A heart disease prediction model using decision tree. IOSR Journal of Computer Engineering (IOSR-JCE), 12(6): 83-86.
[24] Medhekar, D.S., Bote, M.P., Deshmukh, S.D. (2013). Heart disease prediction system using naive Bayes. Int. J. Enhanced Res. Sci. Technol. Eng, 2(3): 1-5.
[25] Sonawane, J.S., Patil, D.R. (2014). Prediction of heart disease using learning vector quantization algorithm. In 2014 Conference on IT in Business, Industry and Government (CSIBIG), pp. 1-5. https://doi.org/10.1109/CSIBIG.2014.7056973
[26] Sabarinathan, V., Sugumaran, V. (2014). Diagnosis of heart disease using decision tree. International Journal of Research in Computer Applications & Information Technology, 2(6): 74-79.
[27] Cong, N., Meesad, P., Unger, H. (2015). Expert systems with applications a highly accurate firefly based algorithm for heart disease prediction. Expert Syst. Appl., 42(21): 8221-8231. https://doi.org/10.1016/j.eswa.2015.06.024
[28] Ismaeel, S., Miri, A., Chourishi, D. (2015). Using the Extreme Learning Machine (ELM) technique for heart disease diagnosis. In 2015 IEEE Canada International Humanitarian Technology Conference (IHTC2015), pp. 1-3. https://doi.org/10.1109/IHTC.2015.7238043
[29] https://scholar.google.co.th/citations?view_op=view_citation&hl=th&user=_wkCqD8AAAAJ&citation_for_view=_wkCqD8AAAAJ:M3NEmzRMIkIC
[30] Mohd, R., Butt, M.A., Baba, M.Z. (2020). GWLM–NARX: Grey Wolf Levenberg–Marquardt-based neural network for rainfall prediction. Data Technologies and Applications, 54(1): 85-102. https://doi.org/10.1108/DTA-08-2019-0130/FULL/PDF
[31] Altaf, I., Butt, M.A., Zaman, M. (2022). Disease detection and prediction using the liver function test data: A review of machine learning algorithms. International Conference on Innovative Computing and Communications. Advances in Intelligent Systems and Computing, pp. 785-800. https://doi.org/10.1007/978-981-16-2597-8_68
[32] https://www.academia.edu/80328577/A_hybrid_adaptive_grey_wolf_levenberg_marquardt_GWLM_and_nonlinear_autoregressive_with_exogenous_input_NARX_neural_network_model_for_the_prediction_of_rainfall?f_ri=10005
[33] https://www.academia.edu/78642235/Is_Decision_Tree_Obsolete_in_Its_Original_Form_A_Burning_Debate
[34] Riyaz, L., Butt, M.A., Zaman, M. (2022). Improving coronary heart disease prediction by outlier elimination. Appl. Comput. Sci., 18(1): 70-88. https://doi.org/10.35784/ACS-2022-6
[35] Riyaz, L., Butt, M.A., Zaman, M., Ayob, O. (2022). Heart disease prediction using machine learning techniques: A quantitative review. International Conference on Innovative Computing and Communications. Advances in Intelligent Systems and Computing, pp. 81-94. https://doi.org/10.1007/978-981-16-3071-2_8
[36] El-Hasnony, I.M., Elzeki, O.M., Alshehri, A., Salem, H. (2022). Multi-label active learning-based machine learning model for heart disease prediction. Sensors, 22(3): 1184. https://doi.org/10.3390/s22031184
[37] Swathi, K., Kodukula, S. (2022). XGBoost clssifier with hyperband optimization for cancer predicton based on geneselection by using machine learning techniques. Revue d'Intelligence Artificielle, 36(6): 665-670. https://doi.org/10.18280/ria.360502
[38] Srivastava, S., Kumar, G., Mishra, R.K., Kulshrestha, N. (2020). A complex diffusion based modified fuzzy C- means approach for segmentation of ultrasound image in presence of speckle noise for breast cancer detection. Revue d'Intelligence Artificielle, 34(4): 419-427. https://doi.org/10.18280/ria.340406