Abhishek Sharma Padmanabhan | S. Sapna*
© 2022 IIETA. This article is published by IIETA and is licensed under the CC BY 4.0 license (http://creativecommons.org/licenses/by/4.0/).
OPEN ACCESS
DNA technology has shown to be a valuable investigative tool in the release of innocent people and the identification of those responsible for serious crimes. In the battle against illegal immigration, cross-border crime, and terrorism, the transnational DNA data interchange from national DNA databanks has become a current trend. The data types that can be shared and the system is managed by a national authority are governed by individual national legislation, which determines the scope of the data exchange. Furthermore, one of the most difficult problems in forensic science is DNA profiling, and it is a hotly debated topic. The number of unknowns in a combination raises the computational difficulty of DNA profiling dramatically. To overcome this issue, various approaches have been designed and implemented. As a result, we examine DNA profiling methodologies and tools in this study, focusing on their computational accuracy and performance. Furthermore, this research examines the available data on DNA exchange and comparison across borders. We hope this review provides more ideas for future research to choose efficient profiling techniques.
DNA profiling, data exchange, forensic science, computational difficulty, profiling techniques
Among multiple forensic laboratories, DNA profiling or typing is a popular approach, for example, when it comes to sexual assault cases, The DNA mixture's source can include the victim, the criminal, and the victim's partner [1]. One of the most difficult challenges to solve is DNA profiling in forensic science, and it is a hotly debated topic.
The requirement, construction, validation, and standards dissemination have shaped databases and forensic DNA profiling's history [2, 3]. Since the beginning of its usage for person identification, DNA profiling technologies have incorporated a variety of conventional laboratory procedures that have gradually developed into workable and established techniques [4].
The process of identifying and documenting specific parts of a DNA molecule's structure is defined by DNA profiling, per the medical dictionary of the American Heritage. DNA sample source and paternity of a child are determined by the DNA profiling technique also genetic disorders are diagnosed and crime suspects are incriminated and exonerated with the help of DNA profiling [5, 6]. DNA profiling was first established in 1985 by Alec Jeffreys, and has had a tremendous impact on the field of forensic research. Dr. Jeffreys discovered that repetitive DNA sequences can be found in numerous locations of human DNA. And these DNA Sequence regions can vary from individual to individual, the problem is effectively addressed by Dr. Jeffreys.
DNA profiling is now widely recognized as a powerful instrument in law enforcement's inventory. Furthermore, criminal DNA data contained in computer databases obtained from crime scenes aided in the identification of a criminal. Because these huge databases already contain Short Tandem Repeat (STR) regions in a certain set, a novel DNA marker collection is unlikely to be developed anytime soon [7].
The transmission of DNA data across international borders has been recognized as an increasingly significant component of attempts to develop innovative kinds of the judiciary and police cooperation, specifically, assisting with organized crime investigations, techniques of counter-terrorism, and efforts under control. It's not a novel thing for people to exchange their DNA information informally, and it has frequently occurred in an ad hoc manner. Following the entry into force of Prüm Decision 2008/615/JHA in August 2008, the reciprocal automated searching implementation on a technical level, as well as the DNA data exchange and comparison among the EU member countries, has been required since August 2011 [8]. According to the most recent report on the Prüm analysis, published in September 2019, Data on DNA is being exchanged between 25 EU countries. The Prüm system is unavailable in Italy, Ireland, and Greece.
When victims physically fought attacks or had evidence of injuries, DNA profiling is used to find sexual assault instances and identify acquaintances raping criminals [9]. Investigation evaluating the influences of factors on case outcomes provides more direct evidence about the relevance of forensic evidence in sexual assault cases including deciding to close a case and make an arrest [10].
In DNA analysis implementation and establishment of uniform norms, methods, and laboratory practices, forensic specialists and European scientists have a track record of agency with the forensic use of DNA technologies from a technical perspective. The European Network of Forensic Science Institutes (ENFSI) was founded in 1995 as a result of a conference of experts in Western European countries from eleven state forensic laboratories, together with intention of having discussions on successful intervention. Since then, ENFSI has brought together several professional groups in many fields of forensic science. The DNA Working Group is one of these groups, aimed at the creation and regulation of evaluative methodologies as well as the standard markers for use in the EU. For forensic sciences in 2009, the European Commission recognized ENFSI's exclusive position in Europe for forensic sciences 2009. By the evaluation of ISO/IEC 17025 standards, proficiency testing, training, and analytical methods validation, actions for forensic laboratory accreditation have been created with ENFSI as part of its capabilities.
This review concentrates on establishing a decentralized network for the transnational DNA data exchange, which is a comparatively new advancement in the use of DNA profiling and databases in forensics. This phenomenon brings together various connections among sciences, culture, law, and history, however, it's also a place where we can examine how standards work in a variety of contexts [11, 12]. For understanding the decisions and priorities that shape the standards and regulation of the DNA data exchange network, this paper briefly explains the evolution of DNA profiling and data basing [13]. A second section is based on interviews with key informants, and it provides significant information on the specific obstacles and difficulties associated with the system's deployment and operation [14, 15].
Researchers in Science and Technology Studies (STS) have contributed significantly to important analysis regarding the forensic DNA databases' construction and development used to assist the criminal justice system and the prosecution of criminals over the last two decades [16]. Two key contributions are extremely valuable for this paper among the alternative methods of investigation [17, 18]. Firstly, research on the challenges and uncertainties regarding the use of the criminal justice system's DNA [19]. Second, analytical viewpoints on DNA databases' enhancement and extension as features of criminal identification technology's history [20, 21].
Similar contributions, in particular, have examined how forensic genetics' original difficulties developed, eventually, a complicated set of methodologies were used to resolve the issue that focuses on ensuring the forensic DNA evidence's reliability and credibility [22]. Moreover, the transnational DNA data exchange provides ethical challenges that have received limited attention in STS contributions thus far [23, 24].
Different techniques for statistically evaluating a DNA mixture have been proposed [25]. These methods include the modified random match probability (mRMP), the combined probability of inclusion/exclusion (CPI/CPE), and a Likelihood ratio [26]. The first two approaches were strongly approved by the FBI's DNA Advisory Board in February 2000. Furthermore, the International Society of Forensic Genetics (ISFG) emphasized the importance of likelihood ratios in 2006 [27]. Tim Clayton defined six methods for analyzing a DNA mixture for the first time in 1998. Firstly, we must determine whether or not a mixture exists. Selection of Allele peaks second. The maximum number of contributions is determined in the third step.
When dealing with only one sample, the Random Match Probability (RMP) is commonly utilized, therefore, when the method is employed with more than one sample from a single source, it is referred to as a modified random match probability (mRMP). With exception of CPI in the mixture, this method necessitates a previous understanding of the number of contributors and is ineffective with low-level profiles. The use of mRMP to calculate two- and three-person mixtures was demonstrated [28, 29].
Accessible DNA is preferred for enzymatic modification or digestion over DNA secured through transcription factors or bound histone proteins and has historically been employed in genomic DNA profiling approaches to investigate chromatin accessibility [30]. The nucleosome positioning and chromatin accessibility are captured in various but consistent snapshots using DNA profiling approaches, and each methodology has its own set of benefits and drawbacks (Appendix). By using orthogonal approaches, such technologies have revealed and demonstrated the genome's accessibility, resulting in the discovery of about the human genome contains 3 million potential regulatory regions [31].
When selecting a profiling technique, there are a few important factors to consider. Although multiple approaches were fine-tuned for single-cell input in this review, the input from a typical cell is substantially higher. Each technique's benefits and drawbacks have been listed, along with references to works that have had a significant impact on the development of the technique and improvement.
Locard's exchange principle that expresses that "every touch leaves a trace," explains a criminal forensic investigation. It maintains that when two objects come into contact, they exchange substance and leave a trace [32]. Although multiple evidence is frequently detected in traces discovered at a crime scene, extreme fragmentation, or intermixing of the victim remains, this makes traditional recognition regarding the victim's physical and anthropological traits ineffective and inconclusive. Moreover, DNA profiling is the best method for the determination of forensic investigations and suspects in some circumstances and also giving specific victims identification, remains a valuable technique in multiple evidence situations [33]. Human DNA sequences are reported to be nearly identical in 99.9% of cases, only with a 0.1 percent difference, the chances of two people who are not related by blood having the same DNA sequence are around 1 in 594.1 trillion [34]. By using this DNA profiling, innocent people are released and condemned the guilty. More than half of all DNA profiling samples processed in various countries represented the samples taken from touched objects [35]. This is due in part to the discovery that DNA may be identified from the biological substance that has been left on a surface but is not visible just by touching it with one's hand, and that a single contact event can contain both direct and indirect transfer events at the same time [36]. A direct deposit of self DNA within the handprint could be considered, a non-self-component, on the other hand, is considered an indirect deposit [37]. Blood, teeth, hair strand, nails, and saliva are all common biological materials for DNA profiling and extraction analysis. The term low copy number (LCN) was first used to describe the study of trace DNA evidence. This has caused confusion, and a certain 34-cycle technology uses the LCN reservation, it is the more reasonable set of terms and any low-level profiles use the LTDNA (‘low template DNA’).
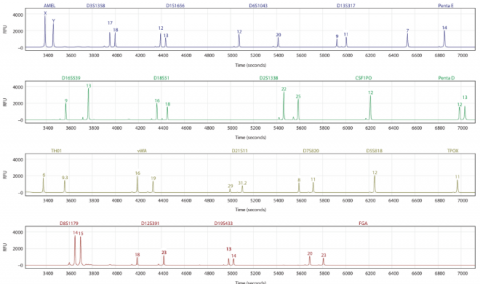
The PCR-based STR analysis for forensic DNA profiling is given in Figure 1. The more effective technique in forensic DNA evaluation is multiplex PCR-based STR analysis [38]. From a wide range of biological sources, the multiple STR loci are amplified commonly by using these multiplex PCR systems in DNA.
Figure 1. OSIRIS analysis of a male individual's PowerPlex 21short tandem repeat profile. Fluorescein is the dye in the top pane (blue), the second (green), the third TMR-ET (yellow), and the fourth pane CXR (red)
In the fight against illegal immigration, terrorism, and cross-border crime, the forensic DNA data transnational exchange across national borders has become a current trend. Police can use forensic DNA data to identify, exclude, or connect people who have been involved in a crime. Furthermore, serial criminals are identified and crime patterns are detected by using the DNA profile by correlating multiple crime scenes. There are four types of analysis of the transnational exchange of DNA data: (1) global DNA database establishment (2) National DNA databases that are connected, (3) data exchange based on requests, and (4) a combination of these [39]. The majority of countries use a hybrid data-exchange system.
5.1 International DNA databases
There are two types of international DNA databases: "regional" and "global". The INTERPOL DNA Gateway platform is an example of a global system. The 173 000 DNA profiles held by the Interpol DNA Database (IDD) had over 84 countries contributing as of December 2017. In IDD, the UK is one of the members and sends a significant DNA profile range to the Interpol database. The crime scenes, unidentified human remains, missing persons, suspects, and DNA profiles from murderers and rapists are kept at the IDD. The reporting law enforcement agency's national laws control the profiles [40].
Personal data or user information is not included in the IDD. For criminal investigations, there are few DNA databases regional international. The Europol Information System (EIS) has been a well regional information database for crime surveillance. The profiles of the European Union (EU) and the Member States are presented in EIS [41]. The EIS is also the same as the Interpol database because the profiles are subjected to the reporting agency's national legislation. Per Europol, as of 2017, the EIS had about 147 096 personal data records. The range and functionality of the biometric exchanging systems and DNA databases are enhanced through a relationship with the EU Pr€um mechanism is being considered by the agency of Europol Programming Document [42].
Multiple countries worldwide use a request-based system for exchanging DNA data. For public security considerations, limited automated database searches are enabled by countries with bilateral agreements [43]. The need that the transmission of DNA information to be "appropriate, relevant, and necessary" for policing purposes, as well as the priority of significant offenses, are among the elements of this system.
5.2 DNA databases
The development of highly powerful and reliable methods for building appropriate and beneficial DNA databases resulted from the establishment of amplification technology for STR analysis. The creation and growth of centralized national criminal DNA databases was a major step forward in forensic DNA profiling. Since 1995, when the complete legislation was established. The UK's first national DNA database was established by forensic scientists, which will store both personal DNA profiles and crime scene results. The STR sequence hits generation is a primary goal of a criminal DNA database among victims, convicted offenders, suspects' DNA profiles, and DNA evidence at the crime scene, as permitted by national legislation. There are currently 69 national forensic DNA databases in operation, according to reports; others are expanding or establishing operations in at least 34 new countries.
For prosecution activities and criminal investigation, the DNA database's significant contribution to the criminal justice system as an important resource all over the world [61], some concerns managing forensic DNA databases poses a risk to a variety of human rights, including informed consent, moral integrity, privacy, the presumption of innocence, autonomy, and liberty [44]. A suitable compromise between these perspectives is established by recommending that a responsible forensic DNA database policy be implemented, and a moral and ethical spectrum is created by including both forensics professionals, the public, law enforcement, and, specifically, less genetically involved social.
Furthermore, a forensic DNA database is a computer database that contains DNA profile records and is a valuable investigative tool in today's criminal justice systems. Identification tool is an extraordinary ability of DNA technology has resulted in a significant shift in the criminal justice system and forensic DNA databases are operated by many countries for crime-related stains to identify the owners. Individual profiles and crime scene samples are compared and matched in an automated and systematic manner and are enabled by the DNA profiles stored in a database that is computerized and centralized. DNA profiling is used to identify the persons who are committed serious crimes was a significant step forward in policing and when DNA profiling is effectively used for convicting the persons who have committed serious crimes or exonerating those who are innocent [45]. Forensic DNA typing continues to depend on the DNA database as a source of information, and the role of STR DNA markers is still important. The NDIS's significance and scope are growing after more than a decade of operation, coupled with STR DNA technology.
As described by the 'DNA project, the DNA databases are created with the requirement of more effort, time, and expense. Fighting crime with science, is justified by the facts that:
• Criminals tend to re-offend. For example, 50% of armed robbers and 90% of rapists have a criminal record.
• Repeat offenders' offenses frequently get more serious crimes over time, with criminals between the ages of 16 and 19 committing their first offense.
The number of contributors in a DNA mixture can be calculated using three different methods. The machine learning-based methods, HPC methods, and basic methods are all included. The following are some of the most fundamental techniques and software tools, among others, Maximum Allele Count (MAC) MLE, DNA MIX, DNA Mixtures, Lab Retriever and Total Allele Count. The parallel or HPC methods include NOCIt, Euroformix and LikeLTD. The number of contributors is determined by only three machine learning studies in a DNA profile to our knowledge.
MLE and MAC were compared by. Two to five-person mixtures are identified by analyzing and comparing the performance of both techniques. Both methods are tested by using three alternative scenarios. Firstly, when all contributors are members of the same population and allele frequencies are known. Then, population subdivision is occurred by allele occurrences that are not known. Lastly, a partial profile condition and how it may influence estimation accuracy. A lower bound is calculated by using the MAC approach [46]. define the masking effect, i.e., The MAC protocol is insecure because people can share alleles. When there are more than three contributors in a mixture, the comparison's findings justify the use of MLE. Moreover, MAC performs best for three or two people contributing to a mixture.
Five machine algorithms are evaluated by Adelman and Marciano finally selected on the SVM, which had a training accuracy of 98 percent and a testing accuracy of 97 percent for four contributors. The 97 percent accuracy was achieved using a dataset with up to four contributors rather than five because there are more classifications, so the accuracy will usually be lower. They employed 1405 profiles from 20 people in their research. Ten machine learning algorithms are examined by, and finally, 19 features in the RFC model were selected. 590 profiles were used, ranging from single individuals to five-person mixtures, and both Y-chromosomal and amelogenin markers were eliminated. For each profile, it consists of over 250 features but only the best 50 features were chosen. It performed well in terms of accuracy (83 percent). Decision trees are used by in their research. From Global filer multiplex, they used 766 profiles with a 25-second injection. They achieved between (77.9% and 85.2%) in terms of accuracy.
The most recent developments in predicting the NOC focused on machine learning algorithms that make the best use of the profile data provided. There have only been a few models produced so far for use in forensic DNA cases. Because algorithms are developed on a different dataset of ground truth, these models utilize more information than previously proposed techniques. The NOC estimations can be done in seconds using machine learning algorithms, which is important in circumstances when the rapid analysis is required.
Multiple DNA profiling techniques can be implemented using a variety of technologies. These include DNA MIX, Euroformix, LRmix, LRmix Studio, TrueAllele, LikeLTD, Lab Retriever, CeesIt, NOCIt, DNAMixture, Forensic, MixtureCalc, Mixture Analysis, FamLink kinship, DNA Mixture Separator, and STRmix. We will review the recent most notable tools in this section.
7.1 1RFC 19
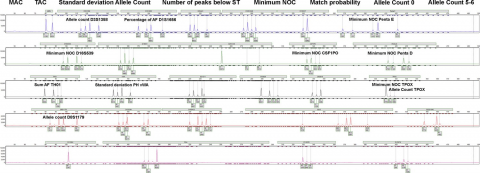
RFC19 [47] was chosen for analysis and validation because of its overall performance on the test set (Table 1). Evidence on allele frequencies, peak heights, and allele counts is among the 19 features employed in this model. Five different locus features among 11 and eight sample features among 25 were used, from the total features. At various locus in dye channels, the locus features are detected with different fragment lengths (Figure 2). This model has lower discriminatory power of several loci (e.g. Penta D, TH01, Penta E, and TPOX) while the high-discriminatory-power locus SE33 hasn't been included. The NOC is represented by low discriminating power loci that are affected by the data delivered by other features, as shown by the partial correlation technique using a high ranking.
Figure 2. An exemplar 3p PPF6C profile depicting the RFC19 machine learning model employs 19 features. The electropherogram (EPG) is accompanied by a set of sample features. At specific loci, locus features are displayed within the EPG
Table 1. Accuracy is acquired through Training and Testing for Each Model, and it ranked the Models from best to worst in terms of overall performance. only the most effective number of features for each algorithm is displayed
|
Model |
Number of features |
Training set Accuracy |
Test set Accuracy |
|
GaussianNB |
4 |
0.794 |
0.792 |
|
LSVC |
4 |
0.803 |
0.808 |
|
DTC |
14 |
0.843 |
0.800 |
|
MLPC |
8 |
0.842 |
0.798 |
|
LDA |
40 |
0.888 |
0.838 |
|
RFC |
19 |
0.874 |
0.833 |
|
k-NN |
3 |
0.834 |
0.800 |
|
GBC |
11 |
0.886 |
0.817 |
|
LRC |
8 |
0.823 |
0.825 |
|
SVC |
5 |
0.811 |
0.808 |
PPF6C profiles in 1p-5p autosomal chromosomes, the RFC19 machine learning model was developed and tested to allow for rapid, automatic, and effective classification of the NOC. Allele frequencies, peak heights, and allele counts are included in this model among other profile parameters. Even for highly complex samples, the NOC is classified effectively by combining the classification algorithm with a significant model evaluation method. Moreover, while comparing the nC-tool and MAC approach, the RFC19 model performed more efficiently.
The RFC19 limitations are examined by using three extreme type samples, 6p mixtures were the initial type. The NOC results of six are not possible because the 1p-5p mixtures are used to develop the NOC machine learning model. Low-template 2p, 3p, and 4p mixtures are the second extreme sample type and it is made from the DNA of 2 or 3 brothers. NOC machine learning models are used to observe under-estimates because the model was not trained using samples from relatives. Severely degraded and showed 3p, 4p and 5p mixtures are included in the third extreme type sample with seven to 22 locus drop-outs per DNA profile. The NOC model produced primarily inaccurate predictions for these highly complicated samples, as expected. An over-estimated NOC (3p) result is obtained from one low-template 2p mixture of DNA. The two contributors are used to explain this profile according to the manual EPG analysis. The first contribution is Three or four alleles with three loci were found in the profile and the second one is one or two alleles with 17 loci. As a result, the sample's overestimated NOC was unexpected, such profiles are probably to be mischaracterized.
7.2 NOCIt
Table 2. Multiple numbers of contributors use a different runtime
|
Contributors' number |
Time range (mode) |
|
5 |
5 h–20 h (14 h) |
|
4 |
1 h–5 h (4 h) |
|
3 |
30 min–1.5 h (1 h) |
|
2 |
15 min–30 min (17 min) |
|
1 |
<1 min (0.2 min) |
The number of contributors is calculated by analyzing DNA samples in a mixture using NOCIt [48] model. The software was created using the Java programming language. The total number of contributors (from 1 to 5) is established by this model. Data on autosomal STRs is only can be interpreted by NOCIt that are unrelated to one another. To handle stuttering, the software has no design improvement. The number of loci/alleles, maximum number of contributors, and computer processing speed are used to determine the execution time of this model [49]. It also depends on whether several NOCIt processes are happening simultaneously, that is multiple NOCIt interfaces are active at the same time, and each executing different samples. NOCIt's runtime is shown in Table 2. The number of contributions is provided in the first column, while the time it has taken to analyze that number is described in the second column.
7.3 STRmix
A DNA profile is evaluated by using this STRmix model with a continuous model and it is statistical genotyping software. The single and mixed DNA profiles are also analyzed by using this software, and also SWGDAM standards are followed by using STRmix. Overall potential genotype configurations and the DNA profile probability are calculated by using the data extracted from a DNA sample, like peak height. Stuttering, allele drop-out, and drop-in are all factors considered by the software.
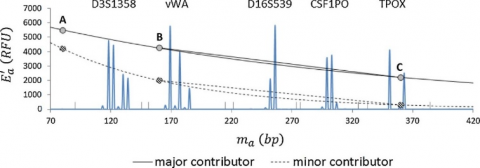
A plot of the average allelic mass (ma) vs best-fit peak height at each locus for the contributor's genotype at that locus was used to run exponential regression analysis in Excel® for each contributor. As a result, each contributor had an exponential curve similar to the curves in Figure 3 but based on known mixture composition data. The ground truth values are calculated by using the regression analysis results for each contributor. The STRmix™ distribution is given in Figure 4.
Figure 3. A simulation of a two-person mixture with the STRmiXTM degradation model superimposed. During the MCMC process, the exponential model is used by this software for degradation (lower curve in each pair), but the users can be analyzed easily by reporting a linear estimation (each pair's upper line)
Figure 4. STRmix™ progress use over eight years
7.4 EuroForMix
The STR DNA profiles estimation is done by using EuroForMix software from a complicated DNA sample including artifacts, this estimation is performed by a continuous approach [50]. Only when there are at least three unknowns will parallel implementation be considered (non-contributor simulation and database searching have yet to be completed). The optimization requires the number of possible starting points and the number of processes will be the same.
When there are four or more unknown contributors, Euroformix demands a significant processing time. From every unknown contributor, the approximation time complexity is shown in Table 4. Since we had four unknown contributions, it was evident that the amount of time consumed was excessive from the table. The time is reduced by parallelizing the code through a distributed memory system is the best option. Table 3 shows the running time. The number of contributors is shown in row 1, and the time taken is shown in row 2. The EuroFormix distribution is given in Figure 5.
Table 3. The number of unknown contributors affects the time it takes to calculate the Lr
|
Number of unknown contributors |
1 |
2 |
3 |
4 |
|
Run time |
~ 1 min |
~ 1 min |
~ 30 min |
24 h |
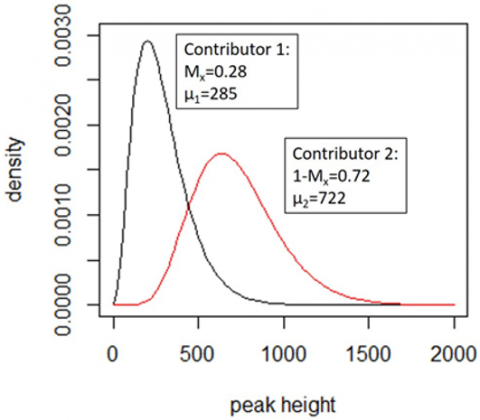
Figure 5. In a simple case of EuroFormix distribution, the scale parameter is 86.2, where shape parameters = 8.381, and 3.312, respectively. Each contributor's Mx and peak height expectation (m) are displayed. These curves are used to derive the individual peak height's probability density function contributions
7.5 Statistefix 4.0
The DNA profiles are deduced by DNA experts using this software for database queries. And it is also used for preselecting the DNA samples with advanced probabilistic search engines. The statistical model is used to analyze allelic drop-in/-out, stuttering [51], degradation, and peak height occurrences. The mixture samples and references are evaluated with the help of this tool.
Among the analogously tested and implemented software, data show that Statistefix 4.0 is a more effective tool for DNA profiling. The potential advantage in ordinary casework is highlighted by DNA profiles deduced from casework samples. Statistefix 4.0 is a free program that allows you to process bulk samples and operates using replicates of multiple DNA tests.
7.6 TAWSEEM
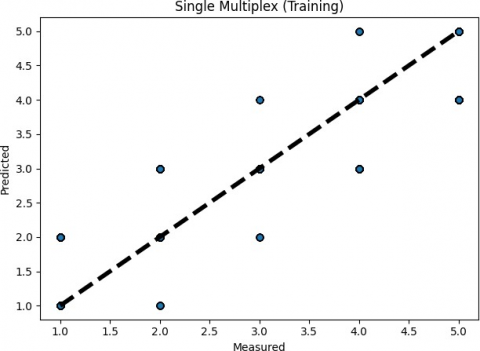
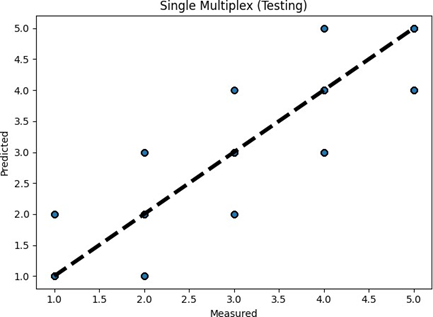
The number of contributors is determined by using the TAWSEEM [52] tool in DNA mixture profiles with a multilayer perceptron (MLP) neural network model. The observations were achieved utilizing the largest dataset, which consisted of four multiplex profiles with a total of 6000 characteristics. This model had an accuracy of 0.97. All of the works that considered up to five contributors had the highest accuracy. Three alternative scenarios can be created using this approach having various locus numbers; 22 loci in single multiplex profiles, 15 loci in three multiplex profiles, and 13 loci in four multiplex profiles. The deep learning model and software tool created in this research can be implemented in hardware [53]. For the development of effective and faster stand-alone devices, the field-programmable gate arrays (FPGA) device is used for DNA profiling [54].
For both the training and testing set, the prediction errors are depicted in Figure 6. It's possible to misclassify the 5-contributor group as a 4-contributor sample and also misclassify the single-contributor group as a 2-contributor group, as seen in both figures. It's difficult to recognize the two, three, and four-contributor groups for higher or lower contributors.
(a) Training
(b) Testing
Figure 6. Prediction errors of TAWSEEM (single multiplex profiles)
7.7 A Comparison of the DNA profiling tools
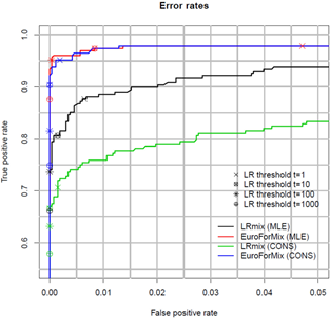
The model performance is measured and evaluated by using the Receiver Operator Characteristics (ROC) plots [55, 56]. These graphs illustrate the rates of false-negative and false-positive support with the observed LR (Figure 7). A better model reduces the rate of false-negative and positive support at the same time [57]. The conservative and MLE of the EuroForMix model [58] have higher true positive support rates than the conservative and MLE of the LRmix model are shown in Figure 8, while the rates of false-positive support are equal. The multiple model performance is compared with the help of ROC plots [59, 60].
Figure 7. TAWSEEM: execution times
Figure 8. The true positive support rate (TP) (vertical axis) and false-positive support rate (FP) are represented as a function of LR thresholds in a receiver operating characteristic (ROC) plot. For both LRmix and EuroForMix, the results for the conservative method (CONS) and maximum likelihood estimate approach (MLE) are plotted. The FP and TP rates are represented by the points on the curves for various LR thresholds. The MLE approach does not achieve a real positive rate of 1.0
EuroForMix and LikeLTD were also compared using ROC analysis by [61]. The overall results of both models are the same but have different modeling assumptions. Advanced n + 1 and complicated n - 2 stutters were simulated using LikeLTD [62, 63], and certain low template samples showed improvement (because the version of EuroForMix utilized at the time didn't allow for these stutter types). EuroForMix and Kongoh tools were compared by [64] and found some similarities between this software.
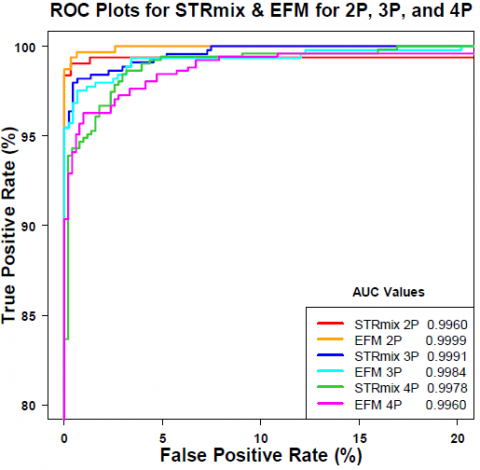
Figure 9 shows the ROC graphs of STRmix and EFM. When each software interprets the same profile, the STRmix and EFM do not produce the same LR values or agree. ROC plots are created for different NOCs and applications. Each NOC dataset is made up of profiles with variable mixture proportions, DNA quantity, and quality [65]. Using unknown and known contributors' LR values in 4P, 3P, and 2P mixtures, the ROC plots of the red, green, and blue curves were created. ROC plots with EFM-assigned LR values are presented in magenta (4P), cyan (3P), and orange (2P). The area under the ROC curve was used to measure discrimination performance (AUC) [66, 67]. In Figure 9, the table shows the results of analytical techniques (p-values) performed on the AUCs. Figure 10 reveals the DNA mixture analysis methods have been shown over time. Table 4 shows a basic comparison of the tools that were selected. The names of the software are listed in the first column [68]. The software's characteristics are described in columns 2-8. The model that was utilized to determine LR is described in Column 2. Whether or not the software has a GUI is indicated by the third column [69]. Columns 4 and 5 show whether the chosen software takes stuttering and drop-in into consideration when interpreting data. The programming language is described in the fifth column and the selected software is created by using this. The source code availability is indicated in column 6. The parallel structure utilized is described in the last column. Due to a lack of resources for some software [70] or a lack of access to the software's source code, observe that certain data is missing from the table.
Figure 9. Examining LR systems' discrimination performance using empirical ROC plots
Table 4. The Overall DNA Software Tools Comparison
|
Software tools |
Calculation model |
Stutter |
Drop-in |
GUI |
Language |
Source Code |
Parallelism |
|
DNAMixtures |
Continuous |
Yes |
Yes |
No |
R |
Yes |
No |
|
LikeLTD |
Continuous |
Yes |
Yes |
No |
R, C |
Yes |
OpenMP |
|
NOCIt |
Continuous |
Yes |
Yes |
Yes |
Java |
Yes |
Java multithreading |
|
DNAMIX V.3 |
- |
- |
- |
Yes |
Java |
Yes |
No |
|
Lab Retriever |
Semi-continuous |
- |
Yes |
Yes |
C++ |
Yes |
No |
|
TrueAllele |
Continuous |
Yes |
Yes |
Yes |
Matlab |
No |
- |
|
Euroformix |
Continuous |
Yes |
Yes |
Yes |
R, C++ |
Yes |
Snow package |
|
Kongoh |
Continuous |
Yes |
No |
Yes |
R |
Yes |
Snow package |
|
CeesIt |
Continuous |
Yes |
Yes |
Yes |
Java |
Yes |
Java multithreading |
|
LRmix studio |
Semi-continuous |
- |
Yes |
Yes |
Java |
Yes |
Java multithreading |
|
STRmix |
Continuous |
Yes |
Yes |
Yes |
Java |
No |
- |
|
Kongoh |
Continuous |
Yes |
Yes |
Yes |
R |
No |
No |
|
RFC19 |
Continuous |
- |
No |
Yes |
Java |
Yes |
Java multithreading |
|
Statistefix 4.0 |
Continuous |
Yes |
Yes |
Yes |
Java |
Yes |
No |
|
TAWSEEM |
Continuous |
- |
No |
Yes |
R, C++ |
Yes |
No |
Figure 10. DNA mixture analysis methods have been developed over time. This Y-axis describes the year of introduction of each tool and the X-axis shows the software tools
In the field of forensic research, interpreting DNA mixtures is a regular procedure. It is a time-consuming and difficult approach. We provided an introduction to the area of DNA profiling. It was discussed in terms of its historical context as well as its implementation. Then we'll explain how to sample a DNA mixture and DNA profiling technologies. Next, we have explained various DNA profiling research depending on their classification, and also examined and compared the performance and effectiveness of the different tools
Then, because TAWSEEM and Statistefix 4.0 already execute parallelism, we recommend using them for DNA profiling. Because the LR value is calculated by employing the continuous model for both tools and also by utilizing the entire information in the DNA sample. The two software's source code is accessible for analysis and modification. While comparing TAWSEEM and Statistefix 4.0, TAWSEEM has a GUI, which provides it a significant benefit over Statistefix 4.0 for non-technical users.
In addition, the review discovered similar policy rules across all of the systems available: Domestic legislation controls information management, and the two-stage Prum method is implemented. As limiting the complete performance of DNA data exchange systems, changes in functional, ethical, and legal norms occur among countries, such as privacy measures and proportionality interpretation, which have been identified in several studies. Both public security and individual civil liberties are preserved by harmonizing domestic policies legally and operationally, according to the present trend.
The need to apply these tests regularly may necessitate the need to reduce the analysis' run time. The area's development and applications have been hampered by computational complexity. Improvements would allow for the mixture interpretations with a greater number of unknown factors in less duration of time. The existing methodologies for parallelizing DNA profiling depend on shared memory parallelization, according to a review of the literature. To speed up computations, a distributed implementation is required, which allows for the usage of a large number of cores/processors. This research is in progress that will be presented soon. A faster and more accurate interpretation of DNA combined with many unknowns is predicted to broaden the scope of DNA profiling.
An effective relevant DNA profile does not create when the database contains poor-quality samples such as PCR inhibitors or degraded DNA. From damaged DNA templates, the information is recovered by using the Smaller PCR amplicons such as SNPs or miniSTRs. The efficient matching K reference profile does not produce by the DNA database searches, it can be effectively enhanced by lowering the specificity of the search. To find close biological relatives of the source of the unknown Q profile, genetic inheritance principles are applied to create a 'familial' search.
To lend support to circumstances involving microbial transfer, Microbial DNA may also play a role in future investigations. In the future, this study will most likely be carried out using next-generation sequencing or other elevated approaches.
In the future, investigators' research advances further than just comparing evidence from a crime scene to a known suspect. Instead, we may use DNA from crime scenes to create descriptions of potential suspects or unidentified victims from scratch via a method called DNA phenotyping. Hence, forensic science in the future will not only focus on crime reconstructions and interpreting forensic science evidence from a crime scene but will also have the capability to “outthink crime” and create a more proactive forensic science.
|
Methods |
Minimal cell input |
Typical cell input |
Genomic target |
Humans' genomes require relative sequencing coverage |
Pros |
Cons |
References |
|
DamID |
1 cell |
≥10,000 cells |
3D genome contacts TF localization
|
10–40 M reads |
Not antibody-dependent |
1. Does not profile endogenous protein 2. Dependent on GATC presence |
[41] |
|
DNase-seq |
1 cell |
≥ 1 M cells |
Open chromatin |
20–50 M reads |
The highest standard for identifying regulatory regions is the DHS. |
High cell input is typically required |
[68] |
|
FAIRE-seq |
100,000 cells |
≥100,000 cells |
Nucleosome occupancy |
20–50 M reads |
Simple and quick protocol |
1. Crosslinking efficiency is quite important. 2. Low signal-to-noise ratio |
[69] |
|
ChIP-seq |
100–10,000 cells |
≥500,000 cells |
Protein localization |
20–40 M reads |
The most widely used profiling method, more comparative datasets, and multiple protocols are available |
The effectiveness of chromatin shearing limits the mapping resolution. |
[70] |
|
MNase-seq |
1 cell |
≥ 1 M cells |
Positioning and occupancy of nucleosomes and TF |
40–60 M reads |
Information on nucleosome and TF binding |
1. High cell input is typically required 2. Active regulatory areas are detected indirectly. |
[67] |
|
ATAC-seq |
1 cell |
≥ 50,000 cells |
Open chromatin |
40–60 M reads |
Native conditions in a fast protocol |
1. The presence of mitochondrial read contamination is very common. 2. Significant sequencing coverage is required to accurately map factors. |
[66] |
|
CUT&RUN |
1 cell |
≥100,000 cells |
Protein localization |
10 M reads |
1. Low cellular input is necessary 2. High signal-to-noise ratio |
Antibody quality is a constraint. |
[65] |
[1] Swaminathan, H., Grgicak, C. M., Medard, M., Lun, D.S. (2015). NOCIt: A computational method to infer the number of contributors to DNA samples analyzed by STR genotyping. Forensic Science International: Genetics, 16: 172-180. https://doi.org/10.1016/j.fsigen.2014.11.010
[2] Arfat, Y., Aqib, M., Mehmood, R., Albeshri, A., Katib, I., Albogami, N., Alzahrani, A. (2017). Enabling smarter societies through mobile big data fogs and clouds. Procedia Computer Science, 109: 1128-1133. https://doi.org/10.1016/j.procs.2017.05.439
[3] Oldoni, F., Bader, D., Fantinato, C., Wootton, S.C., Lagacé, R., Kidd, K.K., Podini, D. (2020). A sequence-based 74plex microhaplotype assay for analysis of forensic DNA mixtures. Forensic Science International: Genetics, 49, 102367. https://doi.org/10.1016/j.fsigen.2020.102367
[4] Paoletti, D.R., Krane, D. E., Doom, T E., Raymer, M. (2011). Inferring the number of contributors to mixed DNA profiles. IEEE/ACM Transactions on Computational Biology and Bioinformatics, 9(1): 113-122. https://doi.org/10.1109/TCBB.2011.76
[5] Perez, J., Mitchell, A.A., Ducasse, N., Tamariz, J., Caragine, T. (2011). Estimating the number of contributors to two-, three-, and four-person mixtures containing DNA in high template and low template amounts. Croatian Medical Journal, 52(3): 314-326. https://doi.org/10.3325/cmj.2011.52.314
[6] Gill, P., Haned, H. (2013). A new methodological framework to interpret complex DNA profiles using likelihood ratios. Forensic Science International: Genetics, 7(2): 251-263. https://doi.org/10.1016/j.fsigen.2012.11.002
[7] Inman, K., Rudin, N., Cheng, K., Robinson, C., Kirschner, A., Inman-Semerau, L., Lohmueller, K.E. (2015). Lab Retriever: A software tool for calculating likelihood ratios incorporating a probability of drop-out for forensic DNA profiles. BMC Bioinformatics, 16(1): 1-10. https://doi.org/10.1186/s12859-015-0740-8
[8] Bleka, Ø., Storvik, G., Gill, P. (2016). EuroForMix: An open source software based on a continuous model to evaluate STR DNA profiles from a mixture of contributors with artefacts. Forensic Science International: Genetics, 21: 35-44. https://doi.org/10.1016/j.fsigen.2015.11.008
[9] Bernasco, W., Lammers, M., van der Beek, K. (2016). Cross-border crime patterns unveiled by exchange of DNA profiles in the European Union. Security Journal, 29(4): 640-660. https://doi.org/10.1057/sj.2015.27
[10] Toom, V. (2018). Cross-border exchange and comparison of forensic DNA data in the context of the Prüm Decision. Universitätsbibliothek Johann Christian Senckenberg.
[11] Børsting, C., Morling, N. (2015). Next generation sequencing and its applications in forensic genetics. Forensic Science International: Genetics, 18: 78-89. https://doi.org/10.1016/j.fsigen.2015.02.002
[12] Gill, P., Haned, H., Bleka, O., Hansson, O., Dørum, G., Egeland, T. (2015). Genotyping and interpretation of STR-DNA: Low-template, mixtures and database matches—twenty years of research and development. Forensic Science International: Genetics, 18: 100-117. https://doi.org/10.1016/j.fsigen.2015.03.014
[13] Phipps, M., Petricevic, S. (2007). The tendency of individuals to transfer DNA to handled items. Forensic Science International, 168(2-3): 162-168. https://doi.org/10.1016/j.forsciint.2006.07.010
[14] Taylor, D., Biedermann, A., Hicks, T., Champod, C. (2018). A template for constructing Bayesian networks in forensic biology cases when considering activity level propositions. Forensic Science International: Genetics, 33: 136-146. https://doi.org/10.1016/j.fsigen.2017.12.006
[15] Coble, M.D., Bright, J.A., Buckleton, J.S., Curran, J.M. (2015). Uncertainty in the number of contributors in the proposed new CODIS set. Forensic Science International: Genetics, 19: 207-211. https://doi.org/10.1016/j.fsigen.2015.07.005
[16] Paoletti, D.R., Doom, T.E., Krane, C.M., Raymer, M.L., Krane, D.E. (2005). Empirical analysis of the STR profiles resulting from conceptual mixtures. Journal of Forensic Sciences, 50(6): JFS2004475.
[17] Norsworthy, S., Lun, D.S., Grgicak, C.M. (2018). Determining the number of contributors to DNA mixtures in the low-template regime: Exploring the impacts of sampling and detection effects. Legal Medicine, 32: 1-8. https://doi.org/10.1016/j.legalmed.2018.02.001
[18] Bright, J.A., Curran, J.M., Buckleton, J.S. (2014). The effect of the uncertainty in the number of contributors to mixed DNA profiles on profile interpretation. Forensic Science International: Genetics, 12: 208-214. https://doi.org/10.1016/j.fsigen.2014.06.009
[19] Tvedebrink, T. (2014). On the exact distribution of the numbers of alleles in DNA mixtures. International Journal of Legal Medicine, 128(3): 427-437. https://doi.org/10.1007/s00414-013-0951-3
[20] Grgicak, C.M., Karkar, S., Yearwood-Garcia, X., Alfonse, L.E., Duffy, K.R., Lun, D.S. (2020). A large-scale validation of NOCIt’sa posteriori probability of the number of contributors and its integration into forensic interpretation pipelines. Forensic Science International: Genetics, 47: 102296. https://doi.org/10.1016/j.fsigen.2020.102296
[21] Grgicak, C.M., Duffy, K.R., Lun, D.S. (2021). The a posteriori probability of the number of contributors when conditioned on an assumed contributor. Forensic Science International: Genetics, 54: 102563. https://doi.org/10.1016/j.fsigen.2021.102563
[22] Taylor, D., Bright, J.A., Buckleton, J. (2014). Interpreting forensic DNA profiling evidence without specifying the number of contributors. Forensic Science International: Genetics, 13: 269-280. https://doi.org/10.1016/j.fsigen.2014.08.014
[23] Slooten, K. (2020). A top-down approach to DNA mixtures. Forensic Science International: Genetics, 46: 102250. https://doi.org/10.1016/j.fsigen.2020.102250
[24] Alfonse, L.E., Garrett, A.D., Lun, D.S., Duffy, K.R., Grgicak, C.M. (2018). A large-scale dataset of single and mixed-source short tandem repeat profiles to inform human identification strategies: PROVEDIt. Forensic Science International: Genetics, 32: 62-70. https://doi.org/10.1016/j.fsigen.2017.10.006
[25] Benschop, C.C., van der Linden, J., Hoogenboom, J., Ypma, R., Haned, H. (2019). Automated estimation of the number of contributors in autosomal short tandem repeat profiles using a machine learning approach. Forensic Science International: Genetics, 43: 102150. https://doi.org/10.1016/j.fsigen.2019.102150
[26] Alamoudi, E., Mehmood, R., Albeshri, A., Gojobori, T., (2020). A survey of methods and tools for large-scale DNA mixture profiling. Smart Infrastructure and Applications, pp. 217-248. https://doi.org/10.1007/978-3-030-13705-2_9
[27] Clayton, T. M., Whitaker, J. P., Sparkes, R., Gill, P. (1998). Analysis and interpretation of mixed forensic stains using DNA STR profiling. Forensic Science International, 91(1): 55-70. https://doi.org/10.1007/978-3-030-13705-2_9
[28] Alotaibi, H., Alsolami, F., Mehmood, R. (2021). DNA profiling: An investigation of six machine learning algorithms for estimating the number of contributors in DNA mixtures. International Journal of Advanced Computer Science and Applications, 12(11): 130-137. https://doi.org/10.14569/IJACSA.2021.0121115
[29] Alamoudi, E.M. (2019). Parallel Analysis of DNA Profile Mixtures with a Large Number of Contributors. Doctoral dissertation, King Abdulaziz University.
[30] Marciano, M.A., Adelman, J.D. (2017). PACE: Probabilistic assessment for contributor estimation—A machine learning-based assessment of the number of contributors in DNA mixtures. Forensic Science International: Genetics, 27: 82-91. https://doi.org/10.1016/j.fsigen.2016.11.006
[31] Kruijver, M., Kelly, H., Cheng, K., et al. (2021). Estimating the number of contributors to a DNA profile using decision trees. Forensic Science International: Genetics, 50, 102407. https://doi.org/10.1016/j.fsigen.2020.102407
[32] Garofano, P., Caneparo, D., D’Amico, G., Vincenti, M., Alladio, E. (2015). An alternative application of the consensus method to DNA typing interpretation for Low Template-DNA mixtures. Forensic Science International: Genetics Supplement Series, 5: e422-e424. https://doi.org/10.1016/j.fsigss.2015.09.168
[33] Fedushko, S., Ustyianovych, T., Gregus, M. (2020). Real-time high-load infrastructure transaction status output prediction using operational intelligence and big data technologies. Electronics, 9(4): 668. https://doi.org/10.3390/electronics9040668
[34] Alfonse, L.E., Garrett, A.D., Lun, D.S., Duffy, K.R., Grgicak, C.M. (2018). A large-scale dataset of single and mixed-source short tandem repeat profiles to inform human identification strategies: PROVEDIt. Forensic Science International: Genetics, 32: 62-70. https://doi.org/10.1016/j.fsigen.2017.10.006
[35] Gill, P., Brenner, C.H., Buckleton, J.S., et al. (2006). DNA commission of the international society of forensic genetics: Recommendations on the interpretation of mixtures. Forensic Science International, 160(2-3): 90-101. https://doi.org/10.1016/j.forsciint.2006.04.009
[36] Gill, P., Hicks, T., Butler, J.M. (2018). Forensic Science International: Genetics DNA commission of the international society for forensic genetics: assessing the value of forensic biological evidence–guidelines highlighting the importance of propositions Part I: evaluation of DNA pro fi li. Forensic Sci Int Genet, 36: 189-202. https://doi.org/10.1016/j.fsigen.2018.07.003
[37] Gill, P., Haned, H. (2013). A new methodological framework to interpret complex DNA profiles using likelihood ratios. Forensic Science International: Genetics, 7(2): 251-263. https://doi.org/10.1016/j.fsigen.2012.11.002
[38] Puch-Solis, R., Rodgers, L., Mazumder, A., Pope, S., Evett, I., Curran, J., Balding, D. (2013). Evaluating forensic DNA profiles using peak heights, allowing for multiple donors, allelic dropout and stutters. Forensic Science International: Genetics, 7(5): 555-563. https://doi.org/10.1016/j.fsigen.2013.05.009
[39] Slooten, K. (2017). Identifying common donors in DNA mixtures, with applications to database searches. Forensic Science International: Genetics, 26: 40-47. https://doi.org/10.1016/j.fsigen.2016.10.003
[40] Bleka, Ø., Prieto, L., Gill, P. (2019). CaseSolver: An investigative open source expert system based on EuroForMix. Forensic Science International: Genetics, 41: 83-92. https://doi.org/10.1016/j.fsigen.2019.03.024
[41] Benschop, C.C., van de Merwe, L., de Jong, J., et al. (2017). Validation of SmartRank: A likelihood ratio software for searching national DNA databases with complex DNA profiles. Forensic Science International: Genetics, 29: 145-153. https://doi.org/10.1016/j.fsigen.2017.04.008
[42] Bleka, Ø., Bouzga, M., Fonneløp, A., Gill, P. (2017). dnamatch2: An open source software to carry out large scale database searches of mixtures using qualitative and quantitative models. Forensic Science International: Genetics Supplement Series, 6: e404-e406. https://doi.org/10.1016/j.fsigss.2017.09.160
[43] Cooper, S., McGovern, C., Bright, J.A., Taylor, D., Buckleton, J. (2015). Investigating a common approach to DNA profile interpretation using probabilistic software. Forensic Science International: Genetics, 16: 121-131. https://doi.org/10.1016/j.fsigen.2014.12.009
[44] Benschop, C.C., Hoogenboom, J., Bargeman, F., et al. (2020). Multi-laboratory validation of DNAxs including the statistical library DNAStatistX. Forensic Science International: Genetics, 49: 102390. https://doi.org/10.1016/j.fsigen.2020.102390
[45] Buckleton, J.S., Bright, J.A., Cheng, K., Budowle, B., Coble, M.D. (2018). NIST interlaboratory studies involving DNA mixtures (MIX13): A modern analysis. Forensic Science International: Genetics, 37: 172-179. https://doi.org/10.1016/j.fsigen.2018.08.014
[46] Cheng, K., Bleka, Ø., Gill, P., Curran, J., Bright, J.A., Taylor, D., Buckleton, J. (2021). A comparison of likelihood ratios obtained from EuroForMix and STRmix™. Journal of Forensic Sciences, 66(6): 2138-2155. https://doi.org/10.1111/1556-4029.14886
[47] Bleka, Ø., Benschop, C. C., Storvik, G., Gill, P. (2016). A comparative study of qualitative and quantitative models used to interpret complex STR DNA profiles. Forensic Science International: Genetics, 25: 85-96. https://doi.org/10.1016/j.fsigen.2016.07.016
[48] You, Y., Balding, D. (2019). A comparison of software for the evaluation of complex DNA profiles. Forensic Science International: Genetics, 40: 114-119. https://doi.org/10.1016/j.fsigen.2019.02.014
[49] Benschop, C.C., Haned, H., Jeurissen, L., Gill, P.D., Sijen, T. (2015). The effect of varying the number of contributors on likelihood ratios for complex DNA mixtures. Forensic Science International: Genetics, 19: 92-99. https://doi.org/10.1016/j.fsigen.2015.07.003
[50] Bille, T., Weitz, S., Buckleton, J.S., Bright, J.A. (2019). Interpreting a major component from a mixed DNA profile with an unknown number of minor contributors. Forensic Science International: Genetics, 40: 150-159. https://doi.org/10.1016/j.fsigen.2019.02.017
[51] Young, B.A., Gettings, K.B., McCord, B., Vallone, P.M. (2019). Estimating number of contributors in massively parallel sequencing data of STR loci. Forensic Science International: Genetics, 38: 15-22. https://doi.org/10.1016/j.fsigen.2018.09.007
[52] Cappabianca, L., Thomassin, H., Pictet, R., Grange, T. (1999). Genomic footprinting using nucleases. Chromatin Protocols, 427-442. https://doi.org/10.1385/1-59259-681-9:427
[53] Dingwall, C., Lomonossoff, G.P., Laskey, R.A. (1981). High sequence specificity of micrococcal nuclease. Nucleic Acids Research, 9(12): 2659-2674. https://doi.org/10.1093/nar/9.12.2659
[54] Amankwaa, A.O. (2019). Trends in forensic DNA database: Transnational exchange of DNA data. Forensic Sciences Research, 5(1): 8-14. https://doi.org/10.1080/20961790.2019.1565651
[55] Santos, F., Machado, H. (2017). Patterns of exchange of forensic DNA data in the European Union through the Prüm system. Science & Justice, 57(4): 307-313. https://doi.org/10.1016/j.scijus.2017.04.001
[56] Shrivastava, P., Jain, T., Kumawat, R.K. (2021). Direct PCR amplification from saliva sample using non-direct multiplex STR kits for forensic DNA typing. Scientific Reports, 11(1): 1-19. https://doi.org/10.1038/s41598-021-86633-0
[57] Cowell, R.G., Graversen, T., Lauritzen, S.L., Mortera, J. (2015). Analysis of forensic DNA mixtures with artefacts. Journal of the Royal Statistical Society: Series C (Applied Statistics), 64(1): 1-48. https://doi.org/10.1111/rssc.12071
[58] Egeland, T., Dalen, I., Mostad, P.F. (2003). Estimating the number of contributors to a DNA profile. International Journal of Legal Medicine, 117(5): 271-275. https://doi.org/10.1007/s00414-003-0382-7
[59] Stanley, U.N., Khadija, A.M., Bukola, A.T., Precious, I.O., Davidson, E.A. (2020). Forensic DNA profiling: Autosomal short tandem repeat as a prominent marker in crime investigation. The Malaysian Journal of Medical Sciences: MJMS, 27(4): 22. https://doi.org/10.21315/mjms2020.27.4.3
[60] Hares, D.R. (2012). Expanding the CODIS core loci in the United States. Forensic Science International: Genetics, 6(1): e52-e54. https://doi.org/10.1016/j.fsigen.2011.04.012
[61] Ge, J., Sun, H., Li, H., Liu, C., Yan, J., Budowle, B. (2014). Future directions of forensic DNA databases. Croatian Medical Journal, 55(2): 163-166. https://doi.org/10.3325/cmj.2014.55.163
[62] Jakovski, Z., Ajanovska, R.J., Stankov, A., Poposka, V., Bitoljanu, N., Belakaposka, V. (2017). The power of forensic DNA data bases in solving crime cases. Forensic Science International: Genetics Supplement Series, 6: e275-e276. https://doi.org/10.1016/j.fsigss.2017.09.085
[63] Manabe, S., Morimoto, C., Hamano, Y., Fujimoto, S., Tamaki, K. (2017). Development and validation of open-source software for DNA mixture interpretation based on a quantitative continuous model. PloS one, 12(11): e0188183. https://doi.org/10.1371/journal.pone.0188183
[64] Schmidt, M., Schiller, R., Anslinger, K., Wiegand, P., Weirich, V. (2021). Statistefix 4.0: A novel probabilistic software tool. Forensic Science International: Genetics, 55: 102570. https://doi.org/10.1016/j.fsigen.2021.102570
[65] Hainer, S.J., Fazzio, T.G. (2019). High‐resolution chromatin profiling using CUT&RUN. Current Protocols in Molecular Biology, 126(1): e85. https://doi.org/10.1002/cpmb.85
[66] Buenrostro, J.D., Corces, M.R., Lareau, C.A., Wu, B., Schep, A.N., Aryee, M.J., Majeti, R., Chang, H.Y., Greenleaf, W.J. (2018). Integrated single-cell analysis maps the continuous regulatory landscape of human hematopoietic differentiation. Cell, 173(6): 1535-1548. https://doi.org/10.1016/j.cell.2018.03.074
[67] Mueller, B., Mieczkowski, J., Kundu, S., Wang, P., Sadreyev, R., Tolstorukov, M.Y., Kingston, R.E. (2017). Widespread changes in nucleosome accessibility without changes in nucleosome occupancy during a rapid transcriptional induction. Genes & Development, 31(5): 451-462. http://www.genesdev.org/cgi/doi/10.1101/gad.293118.116.
[68] Cooper, J., Ding, Y., Song, J., Zhao, K. (2017). Genome-wide mapping of DNase I hypersensitive sites in rare cell populations using single-cell DNase sequencing. Nature Protocols, 12(11): 2342-2354. https://doi.org/10.1038/nprot.2017.099
[69] Tsompana, M., Buck, M.J. (2014). Chromatin accessibility: A window into the genome. Epigenetics & Chromatin, 7(1): 1-16. https://doi.org/10.1186/1756-8935-7-33
[70] Cao, Y., Kitanovski, S., Hoffmann, D. (2020). IntePareto: An R package for integrative analyses of RNA-Seq and ChIP-Seq data. BMC genomics, 21(11): 1-9. https://doi.org/10.1186/s12864-020-07205-6