Moanda Diana Pholo* | Yskandar Hamam | Abdel Baset Khalaf | Chunling Du
© 2022 IIETA. This article is published by IIETA and is licensed under the CC BY 4.0 license (http://creativecommons.org/licenses/by/4.0/).
OPEN ACCESS
Over 10 million people around the world are affected by tuberculosis (TB) every year, making it a major global health concern. With the advent of the COVID-19 pandemic, TB services in many countries have been temporarily disrupted, leading to a potential delay in the diagnosis of TB cases and many cases going under the radar. Since both diseases sometimes present similarly and generally affect the lungs, there is also a risk of misdiagnosis. This study aims to analyse the differences between COVID-19 and TB in different patients, as a first step in the creation of a TB screening tool. 180 COVID-19 and 215 TB case reports were collected from ScienceDirect. Using Natural Language Processing tools, the patient’s age, gender, and symptoms were extracted from each report. Tree-based machine learning algorithms were then used to classify each case report as belonging to either disease. Overall, the cases included 252 male and 117 female patients, with 26 cases not reporting the patient’s sex. The patients’ ages ranged from 0 to 95 years old, with a median age of 41.5. There were 33 cases with missing age values. The most frequent symptom in the TB cases was weight loss while most COVID-19 cases listed fever as a symptom. Of all algorithms implemented, XGBoost performed best in terms of ROC AUC (86.9 %) and F1-score macro (78%). The trained model is a good starting point, which can be used by medical staff to aid in referring potential TB patients in a timely manner. This could reduce the delay in TB diagnosis as well as the TB death toll, especially in highly infected countries.
tuberculosis, COVID-19, medical diagnosis, machine learning, natural language processing
Tuberculosis (TB) affects just over 10 million people every year and is considered the infectious disease with the highest mortality rate, with around 1.7 million patients dying from the disease [1]. TB is caused by the "Mycobacterium tuberculosis" bacteria, which generally attack the lungs and are transmitted through airborne droplets emitted by a patient with active TB [2, 3]. It can manifest through cough, dyspnoea, fever, involuntary weight loss, chest pain and night sweats [2, 4].
The Coronavirus-2019 (COVID-19) disease, on the other hand, is a disease caused by a novel virus first identified in 2019 in Wuhan, China [5]. It is contracted by breathing in or coming in contact with droplets containing the virus; symptoms including cough, dyspnoea, fever and fatigue [6].
The advent of the COVID-19 pandemic has disrupted most countries’ medical systems due to measures such as lockdowns, bans on international travel, and a shortage of medical resources. These issues have, in turn, affected TB-related services. Paper [1], for example, reports cases in which the lack of protective equipment delayed the testing of TB samples in a Nigerian TB centre. The centre also saw a significant drop in the number of outpatients attending. In one Italian hospital, the disruption of TB services resulted in TB diagnoses being delayed by seventy-five (75) days on average in 2020, while the average delay had been 30 days the previous year [7]. A broader study, including 33 centres in 16 countries, also reports reduced outpatient attendance and a lower number of reported TB cases in the first months of the pandemic [8].
According to a recent global report from the World Health Organisation (WHO), there has been a significant drop in the number of reported TB cases around the world [9]. The report notes a 15% decrease in the number of people registered to receive treatment for drug-resistant tuberculosis in 2020 compared to 2019. Based on these numbers, the WHO estimates that around 100 000 more people died of TB in 2020 compared to 2019, due to the disruption of TB services. The organisation predicts a further increase in the number of TB cases as well as TB deaths in the following years and a decrease in the number of people able to receive TB treatment.
This study therefore aims to analyse the differences between COVID-19 and TB cases using natural language processing (NLP) techniques. We will also look at the performance of various machine models in the classification of both diseases. Such models can be a starting point in screening potential TB patients at COVID-19 centres.
Various machine learning solutions have been devised to help solve the COVID-19 problem, ranging from medical image diagnosis [10, 11] to COVID-19 vulnerability and case number prediction [12, 13]. Machine learning (ML) is an ensemble of Artificial Intelligence (AI) methods that process data, identifying their patterns and learning those patterns without being explicitly programmed to do so [14, 15]. Natural language processing (NLP), on the other hand, is an area of ML which aims at extracting information from unstructured texts [16]. NLP has been a great tool in the research around COVID-19 [17] and fighting COVID-related fake news [18]. More applications include a surveillance system [19], sentiment analysis of COVID-related texts [20, 21], as well as systems analysing the effects of COVID-19 on mental health, using social media data [22, 23].
Since the 1990s, researchers have implemented NLP systems to classify patients with TB [24, 25], as well as to differentiate between TB and other pulmonary diseases [26]. More recently, NLP has been used to diagnose tuberculosis using sources such as case reports, patient health records and endoscopic image descriptions [27-29]. However, we have not found any available research explicitly designed to solve the problem at hand, namely the differentiation between TB and COVID-19 using NLP. Such models can be a starting point in screening potential TB patients at COVID-19 centres using clinical diagnosis, which focuses on signs and symptoms and other information which are obtained before performing medical tests.
3.1 Data collection
To create our dataset, we used TB case reports collected in a previous study [30]. COVID-19 cases were then manually collected from ScienceDirect to complete the dataset. These reports were restricted only to include documents with titles mentioning "coronavirus case report" or "COVID-19 case report".
3.2 Feature extraction
Since our study focuses on clinical diagnosis, we focused on extracting the patient’s age, gender and reported symptoms from each case report.
3.2.1 Symptoms
A list of symptoms was extracted from every case report using Amazon Medical Comprehend, a web service used to extract entities such as diseases, medicines and symptoms from medical text [31]. In our case, we retrieved every non-negated ’SIGN’ and ’SYMPTOM’ entity in each case report.
These symptoms were then curated by merging common synonyms, including terms like ’dry cough’ and ’non-productive cough’. All symptoms were then converted to lower case and stemmed. Stemming is used to convert words to their root form to avoid having multiple terms for the same concept, e.g., "cough" and "coughing" [32]. Both case lowering and stemming ensure better symptom retrieval by avoiding multiple versions of the same word.
If any two symptoms had a correlation higher than 0.7 or lower than -0.7, one was dropped to avoid having highly correlated features. The correlation was determined using the Pearson coefficient, obtained by dividing the product of the standard deviations of two features by their covariance (See Eq. (1)) [33].
$=\frac{\sum_{i=1}^{n}\left(x_{i}-\bar{x}\right)\left(y_{i}-\bar{y}\right)}{\sqrt{\sum_{i=1}^{n}\left(x_{i}-\bar{x}\right)^{2}} \sqrt{\sum_{i=1}^{n}\left(y_{i}-\bar{y}\right)^{2}}}$ (1)
where, r=correlation coefficient; xi=values of the first variable (symptom in this case); $x^{-}$=mean value of the first variable yi=values of the second variable; y¯=mean value of the second variable.
3.2.2 Age and gender
Using regular expressions and string matching, the gender and age of each patient were also extracted. Regular expressions are patterns that are matched to a piece of text to extract information. Patterns such as “xx years old” were used to extract age while words like "female", "male" and "woman" were used to find the gender of the patient. A new variable called "age category" was created, which separated younger individuals from those older than the median age in the dataset. A category was also created to replace missing values for both age and gender.
3.3 Data collection
3.3.1 Decision trees
Decision trees are commonly used to solve classification problems. In the medical field, they can, for example, be used to assist with diagnosis prediction [34]. A decision tree is a machine learning classifier which consists of decision blocks, branches, as well as terminating blocks. The tree is recursively split into branches based on the "purity" of the resulting subsets, which can be measured using entropy (Eq. (2)) [35, 36].
Entropy $=\sum_{i=1}-p_{i} \log _{2}\left(p_{i}\right)$ (2)
where, c: number of target classes; pi: probability of a data point belonging to class i.
An entropy of zero means that the split results in completely "pure" subsets, while a value of 1 signifies the highest degree of heterogeneity in the subsets [37].
The Gini impurity can also be used to determine a split’s purity. It represents the probability of the split assigning a data point to the wrong class (Eq. (3)) [38].
$G i n i=\sum_{i=1} p_{i}\left(1-p_{i}\right)$ (3)
The process of recursively splitting the tree continues until:
(i) all terminating nodes are homogeneous;
(ii) no split can improve the purity;
(iii) and the terminating node has the minimum number of data points [37].
One of the main advantages of decision trees is that they resemble human decision-making and are therefore easy to interpret [34, 39]. Beyond classification, decision trees can help understand and filter the most important variables linked to a diagnosis and analyse their relative relevance [34, 39].
As with every algorithm, decision trees have their downsides. For example, they are prone to overfitting, which can happen when the tree is complexly trained on a dataset and struggles to generalise on previously unseen data [36].
3.3.2 Random forests
Random forests (RF) are ensemble algorithms that combine multiple low performing decision trees to create a better classifier [36]. Each tree in the forest makes a prediction on new data; the most common prediction becoming the ensemble’s output [35]. To mitigate overfitting, RF introduce randomisation at two levels: data sampling and feature selection.
-data sampling. RF use bootstrap aggregating (bagging), which creates N data sets, each containing N data points randomly selected from the original dataset (made of N data points). The data in the new sets are resampled, meaning a data point can occur more than once [36, 40].
-random feature selection. The RF algorithm randomly selects which variables are included in the different trees [41].
This randomisation can reduce the chances of overfitting and potentially increase classification performance.
3.3.3 Extreme gradient boosting
Boosting is another ensemble method that, unlike bagging, builds each tree based on the previous one, giving a higher weight to previously misclassified instances. The successive trees thus focus on reducing previous errors [41, 42].
XGBoost (XGB) is a fast, high performing and scalable type of boosting algorithm. It implements two additional methods in order to decrease overfitting:
• Shrinkage: each tree classifier is given a weight that reduces its impact on the following trees and is applied when voting for a prediction class [43, 44].
• Column subsampling: the algorithm only uses a random fraction of the training features to build every tree in the model [44].
3.4 Performance evaluation
We evaluated the performance of each algorithm using the Receiver Operating Characteristics Area Under the Curve (ROC AUC) and the F1-macro average. The ROC curve shows the relationship between a model’s true positive rate (TPR) and its false positive rate (FPR). The larger the area under the curve, the better the model is at differentiating between target classes.
The F1 score, on the other hand, is the harmonic mean of precision and recall, defined below. It measures a model’s ability to balance between identifying all true positive cases, thus reducing false negatives (FN) and minimising false positives (FP).
The F1-macro average (F1-macro) returns the average F1-score of the positive class and the negative class.
$T P R=\frac{T P}{N P+F P}$ (4)
$F P R=1-\frac{T P}{N P+F P}$ (5)
where, TP=number of true positives; NP=number of false positives.
The F1-macro average (F1-macro) returns the average F1-score of the positive class and the negative class.
$F 1=\frac{T P}{T P+\frac{1}{2}(F P+F N)}$ (6)
Each algorithm above was tuned by training the model using different parameter values; their performance was then assessed using 5-fold cross-validation. For each set of chosen parameters, the dataset was randomly split into five subsets of similar sizes. The algorithm was then run five times, with four subsets used for training, and one used for testing. Below is a detailed description of the results we obtained.
4.1 Data collection and pre-processing
The data collection process resulted in a dataset of 180 COVID-19 and 215 TB case reports. The median length of the collected reports was 1188 characters.
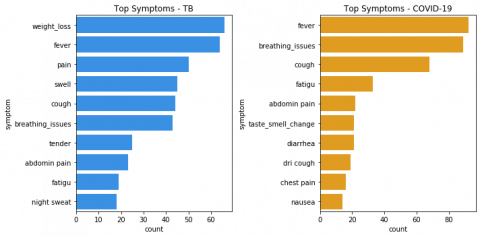
After processing the symptoms as described in Section 2.2, our dataset was comprised of 148 symptom features. It appeared that the most reported symptom for COVID-19 patients was fever, while the symptom most TB patients reported was weight loss. Figure 1 below gives more details on the most frequent symptoms reported for each disease.
Overall, the cases included 252 male and 117 female patients, with 26 instances not reporting the patient’s sex. The patients’ age ranged from 0 to 95 years old, with 33 cases 178 missing age values. As Table 1 indicates, most of the cases were male patients, with the male-to-female ratio being significantly higher for tuberculosis.
Figure 1. Top symptoms per disease. (a)Tuberculosis. (b) COVID-19
Table 1. Age and gender summary per disease
|
|
|
TB |
COVID-19 |
|
Age (years old) |
Mean |
40 |
48 |
|
|
Standard Deviation |
20 |
21 |
|
Gender |
Female |
66 |
51 |
|
|
Male |
132 |
86 |
|
|
Missing |
17 |
9 |
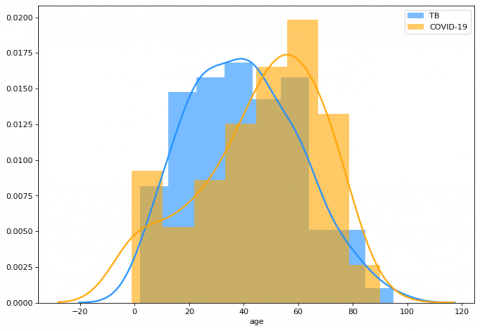
Figure 2 shows how age was distributed for each target class, depicting the higher average age of COVID-19 patients. It is important to note the relatively significant number of cases reporting COVID-19 patients under the age of 10, which lowers the average age for the disease.
Figure 2. Age distribution per disease
4.2 Models’ Performances
Below is Table 2, which reports the performances of each algorithm as well as the best hyperparameters that achieved those results. XGBoost performed best in differentiating between COVID-19 and TB using the features we extracted, with an F1-macro average of 0.78 and a ROC AUC of 0.87.
Table 2. Model results
|
|
Best Parameters |
F1-macro |
ROC AUC |
Runtime (seconds) |
|
Decision Tree |
’max_depth’:25, ’max_features’: 148 |
0.75 |
0.82 |
4 |
|
Random Forest |
’bootstrap’: True, ’max_depth’: None, ’max_features’: ’auto’, ’n_estimators’: 230 |
0.77 |
0.86 |
143 |
|
XGBoost |
’colsample_bytree’: 0.5, ’n_estimators’: 50, ’subsample’: 0.9 |
0.78 |
0.87 |
13 |
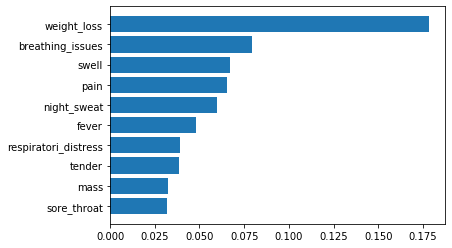
Our best model, XGBoost, uses multiple estimators. It is therefore less easy to visualise for interpretation purposes. However, the model returns relative feature importance, indicating which features played either a higher or lower role in improving performance. Figure 3 reports our model’s best features.
Figure 3. XGBoost feature importance
While the world is fighting the COVID-19 pandemic, it is important not to neglect the ongoing global fight against tuberculosis [45]. The primary goal of this study was therefore to analyse COVID-19 case reports and how they differ from tuberculosis ones, in an effort to prevent delays in TB detection. Our results revealed that COVID-19 patients were on average older than TB patients, which seems consistent with early findings that older patients are more at risk of contracting the disease [46, 47]. There was also a significant number of very young patients, despite data showing that this age group is less at risk [48]. This might mean that serious cases involving children are likely to be reported.
We also see a higher number of male patients in the COVID-19 as well as the TB patients. In the case of COVID-19, men have been reportedly more affected by the disease [49]. This means they are more likely to be hospitalised and have their case reported. As for TB, it is almost twice as likely to affect men than women [50].
Looking at the symptoms, we see that fever and cough were among the top three mostly reported symptoms of COVID-19, as was the case in multiple cohorts reported in different studies [46, 47].
Taking a closer look at the frequency of important symptoms per disease, as shown in Figure 4, we see that patients reporting weight loss, swelling, pain, or the presence of a tender mass were most likely to have TB. On the other hand, patients presenting with fever, breathing issues or a sore throat were most likely to have COVID-19. It is interesting to note that cough, one of the most frequent COVID-19 symptoms, did not help our classifier achieve better performance. This may be due to many TB patients also reportedly coughing and an imbalance of TB cases compared with COVID-19 cases.
Figure 4. Important features frequency per disease
In summary, the study findings show that:
(1) Although COVID-19 patients were on average older than TB patients, age did not greatly impact our model’s decision;
(2) men were more likely than women to have both TB and COVID-19, not allowing the model to discriminate between the two diseases based on gender;
(3) Weight loss and breathing issues were most important in differentiating between the two diseases.
With a ROC AUC of 0.87, the developed model could help detect TB patients at COVID-19 testing stations. The latter could then timeously refer patients who are highly likely to have TB. Such a tool could have a double potential impact: decreasing the number of missed TB cases, and reducing the delay in TB diagnosis. One of the main limitations of this study is that it used a relatively small data set. Another limitation is the imbalance in the number of TB and COVID-19 cases. Future research will aim to collect more report cases and improve the XGB model by dealing with the imbalance in the data set.
[1] Igwaran, A., Edoamodu, C.E. (2021). Bibliometric analysis on tuberculosis and tuberculosis-related research trends in Africa: A decade-long study. Antibiotics, 10(4): 423. http://dx.doi.org/10.3390/antibiotics10040423
[2] Desalu, O.O., Adeoti, A.O., Fadeyi, A., Salami, A.K., Fawibe, A.E., Oyedepo, O.O. (2013). Awareness of the warning signs, risk factors, and treatment for tuberculosis among urban Nigerians. Tuberculosis Research and Treatment, 2013: 369717. https://doi.org/10.1155/2013/369717
[3] Gelaw, Y. (2020). Towards sustainable tb control in Ethiopia–profiling high-risk geographical areas using spatial modelling. PhD Thesis, The University of Queensland. https://doi.org/10.14264/uql.2020.889
[4] Puvaneswaran, B., Shoba, B. (2013). Misdiagnosis of tuberculosis in patients with lymphoma. The South African Medical Journal, 103(1): 32-33. http://dx.doi.org/10.7196/SAMJ.6093
[5] Perlman, S. (2020). Another decade, another coronavirus. New England Journal of Medicine, 382(8): 760-762. http://dx.doi.org/10.1056/NEJMe2001126
[6] Singhal, T. (2020). A review of coronavirus disease-2019 (Covid-19). The Indian Journal of Pediatrics, 87(4): 281-286. http://dx.doi.org/10.1007/s12098-020-03263-6
[7] Di Gennaro, F., Gualano, G., Timelli, L., et al. (2021). Increase in tuberculosis diagnostic delay during first wave of the COVID-19 pandemic: Data from an Italian infectious disease referral hospital. Antibiotics, 10(3): 272. https://doi.org/10.3390/antibiotics10030272
[8] Migliori, G.B., Thong, P.M., Akkerman, O., et al. (2020). Worldwide effects of coronavirus disease pandemic on tuberculosis services, January–April 2020. Emerging Infectious Diseases, 26(11): 2709-2712. https://dx.doi.org/10.3201%2Feid2611.203163
[9] World Health Organisation. (2021). Global tuberculosis report 2021. https://www.who.int/publications/i/item/9789240037021, accessed on 27-October-2021.
[10] Panwar, H., Gupta, P., Siddiqui, M.K., Morales-Menendez, R., Bhardwaj, P., Singh, V. (2020). A deep learning and grad-cam based color visualization approach for fast detection of COVID-19 cases using chest x-ray and CT-scan images. Chaos, Solitons & Fractals, 140: 110190. https://dx.doi.org/10.1016%2Fj.chaos.2020.110190
[11] Cury, R.C., Megyeri, I., Lindsey, T., et al. (2021). Natural language processing and machine learning for detection of respiratory illness by chest CT imaging and tracking of COVID19 pandemic in the United States. Radiology: Cardiothoracic Imaging, 3(1): e200596. http://dx.doi.org/10.1148/ryct.2021200596
[12] Punn, N.S., Sonbhadra, S.K., Agarwal, S. (2020). Covid-19 epidemic analysis using machine learning and deep learning algorithms. MedRxiv. https://doi.org/10.1101/2020.04.08.20057679
[13] DeCaprio, D., Gartner, J., Burgess, T., Garcia, K., Kothari, S., Sayed, S., McCall, C.J. (2020). Building a covid-19 vulnerability index. arXiv preprint arXiv:2003.07347. http://dx.doi.org/10.21037/jmai-20-47
[14] Hamid, O.H., Smith, N.L., Barzanji, A. (2017). Automation, per se, is not job elimination: How artificial intelligence forwards cooperative human-machine coexistence. In 2017 IEEE 15th International Conference on Industrial Informatics (INDIN), pp. 899-904. http://dx.doi.org/10.1109/INDIN.2017.8104891
[15] Carleo, G., Cirac, I., Cranmer, K., Daudet, L., Schuld, M., Tishby, N., Vogt-Maranto, L., Zdeborová, L. (2019). Machine learning and the physical sciences. Reviews of Modern Physics, 91(4): 045002. http://dx.doi.org/10.1103/RevModPhys.91.045002
[16] Carriere, J., Shafi, H., Brehon, K., Manhas, K.P., Churchill, K., Ho, C., Tavakoli, M. (2021). Case report: Utilizing AI and NLP to assist with healthcare and rehabilitation during the COVID-19 pandemic. Frontiers in Artificial Intelligence, 4. http://dx.doi.org/10.3389/frai.2021.613637
[17] Ebadi, A., Xi, P., Tremblay, S., Spencer, B., Pall, R., Wong, A. (2021). Understanding the temporal evolution of COVID-19 research through machine learning and natural language processing. Scientometrics, 126(1): 725-739. http://dx.doi.org/10.1007/s11192-020-03744-7
[18] Ayoub, J., Yang, X.J., Zhou, F. (2021). Combat COVID-19 infodemic using explainable natural language processing models. Information Processing & Management, 58(4): 102569. http://dx.doi.org/10.1016/j.ipm.2021.102569
[19] Chapman, A.B., Peterson, K.S., Turano, A., Box, T.L., Wallace, K.S., Jones, M. (2020). A natural language processing system for national COVID-19 surveillance in the US department of veterans affairs.
[20] Alamoodi, A.H., Zaidan, B.B., Zaidan, A.A., et al. (2021). Sentiment analysis and its applications in fighting COVID-19 and infectious diseases: A systematic review. Expert systems with applications, 167: 114155. http://dx.doi.org/10.1016/j.eswa.2020.114155
[21] Nemes, L., Kiss, A. (2021). Social media sentiment analysis based on COVID-19. Journal of Information and Telecommunication, 5(1): 1-15. http://dx.doi.org/10.1080/24751839.2020.1790793
[22] Low, D.M., Rumker, L., Talkar, T., Torous, J., Cecchi, G., Ghosh, S.S. (2020). Natural language processing reveals vulnerable mental health support groups and heightened health anxiety on reddit during COVID-19: Observational study. Journal of Medical Internet Research, 22(10): e22635. http://dx.doi.org/10.2196/22635
[23] Li, I., Li, Y., Li, T., Alvarez-Napagao, S., Garcia-Gasulla, D., Suzumura, T. (2020). What are we depressed about when we talk about COVID19: Mental health analysis on tweets using natural language processing. In International Conference on Innovative Techniques and Applications of Artificial Intelligence, pp. 358-370. http://dx.doi.org/10.1007/978-3-030-63799-6_27
[24] Jain, N.L., Knirsch, C.A., Friedman, C., Hripcsak, G. (1996). Identification of suspected tuberculosis patients based on natural language processing of chest radiograph reports. In Proceedings of the Amia Annual Fall Symposium, p. 542.
[25] Hripcsak, G., Knirsch, C.A., Jain, N.L., Pablos-Mendez, A. (1997). Automated tuberculosis detection. Journal of the American Medical Informatics Association, 4(5): 376-381. http://dx.doi.org/10.1136/jamia.1997.0040376
[26] Hripcsak, G., Austin, J.H., Alderson, P.O., Friedman, C. (2002). Use of natural language processing to translate clinical information from a database of 889,921 chest radiographic reports. Radiology, 224(1): 157-163. https://doi.org/10.1148/radiol.2241011118
[27] Tong, Y., Lu, K., Yang, Y., Li, J., Lin, Y., Wu, D., Yang, A.M., Li, Y., Yu, S., Qian, J. (2020). Can natural language processing help differentiate inflammatory intestinal diseases in China? Models applying random forest and convolutional neural network approaches. BMC Medical Informatics and Decision Making, 20(1): 1-9. http://dx.doi.org/10.1186/s12911-020-01277-w
[28] Pholo, M.D., Hamam, Y., Khalaf, A.B., Du, C. (2021). Classifying lymphoma and tuberculosis case reports using machine learning algorithms. Bulletin of Electrical Engineering and Informatics, 10(5): 2857-2865. https://doi.org/10.11591/eei.v10i5.3132
[29] Landsman, D., Abdelbasit, A., Wang, C., et al. (2021). Cohort profile: St. Michael’s Hospital Tuberculosis Database (SMH-TB), a retrospective cohort of electronic health record data and variables extracted using natural language processing. PloS one, 16(3): e0247872. http://dx.doi.org/10.1371/journal.pone.0247872
[30] Pholo, M.D., Hamam, Y., Khalaf, A., Du, C. (2019). Combining TF-IDF with symptom features to differentiate between lymphoma and tuberculosis case reports. In 2019 IEEE Global Conference on Signal and Information Processing (GlobalSIP), pp. 1-4. http://dx.doi.org/10.1109/GlobalSIP45357.2019.8969317
[31] Bhatia, P., Celikkaya, B., Khalilia, M., Senthivel, S. (2019). Comprehend medical: A named entity recognition and relationship extraction web service. In 2019 18th IEEE International Conference on Machine Learning and Applications (ICMLA), pp. 1844-1851. https://doi.org/10.1109/ICMLA.2019.00297
[32] Balakrishnan, V., Lloyd-Yemoh, E. (2014). Stemming and lemmatization: A comparison of retrieval performances. LNSE, 2(3): 262-267. http://dx.doi.org/10.7763/LNSE.2014.V2.134
[33] Schober, P., Boer, C., Schwarte, L.A. (2018). Correlation coefficients: Appropriate use and interpretation. Anesthesia & Analgesia, 126(5): 1763-1768. http://dx.doi.org/10.1213/ANE.0000000000002864
[34] Song, Y.Y., Ying, L. (2015). Decision tree methods: Applications for classification and prediction. Shanghai Archives of Psychiatry, 27(2): 130. https://dx.doi.org/10.11919%2Fj.issn.1002-0829.215044
[35] Lino Ferreira da Silva Barros, M.H., Oliveira Alves, G., Morais Florêncio Souza, L., da Silva Rocha, E., Lorenzato de Oliveira, J.F., Lynn, T., Sampaio, V., Endo, P.T. (2021). Benchmarking machine learning models to assist in the prognosis of tuberculosis. In informatics, 8(2): 27. http://dx.doi.org/10.3390/informatics8020027
[36] Harrington, P. (2012). Machine Learning in Action. Simon and Schuster.
[37] Zhang, Z. (2016). Decision tree modeling using R. Annals of Translational Medicine, 4(15). http://dx.doi.org/10.21037/atm.2016.05.14
[38] Verma, P., Awasthi, V.K., Sahu, S.K. (2021). A novel design of classification of coronary artery disease using deep learning and data mining algorithms. Revue d’Intelligence Artificielle, 35(3): 209-215. http://dx.doi.org/10.18280/ria.350304
[39] Patel, H.H., Prajapati, P. (2018). Study and analysis of decision tree based classification algorithms. International Journal of Computer Sciences and Engineering, 6(10): 74-78. http://dx.doi.org/10.26438/ijcse/v6i10.7478
[40] Sheikhi, S. (2020). An efficient method for detection of fake accounts on the Instagram platform. Rev. d’Intelligence Artif., 34(4): 429-436. http://dx.doi.org/10.18280/ria.340407
[41] Zhang, W., Wu, C., Zhong, H., Li, Y., Wang, L. (2021). Prediction of undrained shear strength using extreme gradient boosting and random forest based on Bayesian optimization. Geoscience Frontiers, 12(1): 469-477. http://dx.doi.org/10.1016/j.gsf.2020.03.007
[42] Bandi, V., Bhattacharyya, D., Midhunchakkaravarthy, D. (2020). Prediction of brain stroke severity using machine learning. Revue d’Intelligence Artificielle, 34: 753-761. http://dx.doi.org/10.18280/ria.340609
[43] Abbasimehr, H., Setak, M., Tarokh, M.J. (2014). A comparative assessment of the performance of ensemble learning in customer churn prediction. Int. Arab J. Inf. Technol., 11(6): 599-606.
[44] Chen, T., Guestrin, C. (2016). Xgboost: A scalable tree boosting system. In Proceedings of the 22nd ACM SIGKDD International Conference on Knowledge Discovery and Data Mining, pp. 785-794. http://dx.doi.org/10.1145/2939672.2939785
[45] Manyazewal, T., Woldeamanuel, Y., Blumberg, H.M., Fekadu, A., Marconi, V.C. (2020). The fight to end tuberculosis must not be forgotten in the COVID-19 outbreak. Nature Medicine, 26(6): 811-812. http://dx.doi.org/10.1038/s41591-020-0917-1
[46] Xu, X.W., Wu, X.X., Jiang, X.G., et al. (2020). Clinical findings in a group of patients infected with the 2019 novel coronavirus (SARS-Cov-2) outside of Wuhan, China: Retrospective case series. BMJ, 368. http://dx.doi.org/10.1136/bmj.m606
[47] Zhou, F., Yu, T., Du, R., et al. (2020). Clinical course and risk factors for mortality of adult inpatients with COVID-19 in Wuhan, China: A retrospective cohort study. The Lancet, 395(10229): 1054-1062. http://dx.doi.org/10.1016/S0140-6736(20)30566-3
[48] Haleemunnissa, S., Didel, S., Swami, M.K., Singh, K., Vyas, V. (2021). Children and COVID 19: Understanding impact on the growth trajectory of an evolving generation. Children and Youth Services Review, 120: 105754. https://doi.org/10.1016/j.childyouth.2020.105754
[49] Jin, J.M., Bai, P., He, W., Wu, F., Liu, X.F., Han, D.M., Liu, S., Yang, J.K. (2020). Gender differences in patients with COVID-19: Focus on severity and mortality. Frontiers in Public Health, 8: 152. http://dx.doi.org/10.3389/fpubh.2020.00152
[50] Nhamoyebonde, S., Leslie, A. (2014). Biological differences between the sexes and susceptibility to tuberculosis. The Journal of Infectious Diseases, 209(suppl 3): S100-S106. http://dx.doi.org/10.1093/infdis/jiu147