Venkata Naresh Mandhala | Debnath Bhattacharyya | Divya Midhunchakkaravarthy | Hye-Jin Kim*
© 2022 IIETA. This article is published by IIETA and is licensed under the CC BY 4.0 license (http://creativecommons.org/licenses/by/4.0/).
OPEN ACCESS
The need of fair and unbiased Machine Learning Models is crucial to take the decisions. The attempt to address the issues related to fairness to the system by analyzing the data is an important aspect. An efficient system is required to analyze the problem, which is impartial and also empower significantly more fairness that will enable companies to gain new efficiencies and profits to the organization. Mitigating the bias using the machine learning algorithms on the trained data is a challenging and also a complex task which needs a careful examination to avoid unintended bias. Development and deployment of a reasonable model is a need which will serve in the prevention of unintended discriminations which are present in the datasets. This work leverages the error in the classification model and produces the outcome with better fairness. The proposed model proves that there is a significant increase in the fairness which is measured by using disparity impact difference in positive proportion and also by other post training metrics.
bias, classification, fairness, machine learning, mitigation, post training metrics
Algorithmic Decision Making provides an extensive benefit when compared to human decision-making capabilities. There is a possibility of human errors while taking the decisions, where which can be eliminated with the help of the machines. Fairness is an important aspect to be considered while taking the decisions, unfair algorithms lead to a degrade decision making capability which will affect the system and leads to loss for the organization or an individual. Bias mainly presents in two forms, one in the data that we consider for the analysis and second is algorithm that we choose to process the data. If this is the case it will directly or indirectly affect the lives of the humans and also the society.
Advancements in the area of Machine Learning, Natural Language Processing and also Deep Learning are used to address these challenges. Addressing the bias problems in the datasets has become an important for the researchers to develop stochastic applications. A survey was conducted by Lum, K investigated numerous applications and also listed the possible sources of bias that is affecting the system and also examined various domains and its sub domains where the unfair outcomes are to be addressed, which cause the potential harm. Challenges such as synthesizing a definition of fairness, from equality to equity and focus on searching for unfairness are to be addressed to overcome the problems in the process of mitigating the bias in the data as well as algorithms [1].
Bias in data may be considered as systematic error. To debug these kinds of errors, first we have to find the bias. Unmitigated biases may weak the insight of objectivity and impartiality in model. Measuring the impact of the bias present in the datasets is very important. To trace the bias by using existing algorithms and finding it in a full length is a challenging task in any system is one concept and whereas tracing it on the insufficient databases is another case in using the insufficient training of the algorithms. To identify the bias that is present in the datasets, by performing the analysis on the available datasets to alleviate the bias that was created and by using the analysis software to aim for finding the bias in the full range, few latest techniques and algorithms are implemented to mitigate the bias in the datasets as there are no strong review exists for investigating the bias systematically and also to discriminate on the available software’s [2].
Predisposition is a bias in favor or against an individual, model, or a thing that is viewed as unreasonable. At present occasions, Machine Learning and Artificial Intelligence assume a significant part in taking choices for the benefit of people, regardless of whether it be controlling a self-driving vehicle, recognizing malignant growth or foreseeing our inclinations dependent on the past conduct [3]. However, as Machine Learning turns into a basic piece of our lives, a key test is the presence of predisposition in the orders and forecasts of AI. They have outcomes dependent on the choices coming about because of an AI model. However, it's imperative to see how predisposition is brought into Machine learning models, how to test the bias and afterward how to relieve it.
Minor irregularities in these distortions can lead to measurable differences in the final risk assessment. A crucial problem is that the problems of racial bias and structural discrimination are baked into the world around us. These distortions underlying the data represent a risk of structural inequality and unfair bias that cannot be replicated without being amplified [4].
Inherent biases, such as low feelings attributed to particular races, low-paid occupations associated with men, and negative labeling of disabilities, are propagated through a variety of applications, from language translators to CV filters. There is a growing interest in using hiring algorithms as a means to combat and mitigate prejudice. For example, researchers at the University of Melbourne recently published a report showing that algorithms can reinforce human gender bias against women [5]. The main objective of this study is by developing reasonable model which is impartial and would empower significantly more fairness that would profit organizations.
Fairness is an important metric in any machine learning algorithms and still lot of researchers are working on it to improve the fairness of the model by developing new strategies by mitigating the unintended bias present in the data.
To identify and mitigate the bias in the multimodal datasets, A wide variety of tools and frameworks are developed such as REVISE [6], FairML [7], IBM AI Fairness 360 [8], Accenture’s “Teach and Test” Methodology, Google’s What-If Tool [9] and Microsoft’s Fairlearn. But still there exists a research gap which needs more attention in the development of Machine Learning Models for addressing various issues due to the presence of bias in the datasets.
Data plays a vital role in the field of science, engineering, management and also in every field of research. When the data that we consider for analysis if not in a meaningful manner it is of no use and also when processed it leads to a misinterpretation. Data that is collected should be relevant to the application and also applicable to the theory. The nested samples always have the advantage of the data available in the representative super-sample, whereas the non-nested sample refers to the data available in the unrepresentative sample. Thus, to avoid the collider bias is a challenging task [10].
Data from different sources in different forms are always a challenging when we consider it for analysis in any area of research. When that type of data was fed to any black-box machine learning techniques it leads to the existence of bias and the results that are achieved are unpredictable and will not help for better decision making. As per the International human rights law racial equality is an important factor and when it comes to the Computer Vision and its subset facial recognition it is not clear and accuracy of the development system is being ignored. Racial bias present in the datasets will degrade the performance of the system and computed error rates compared to Caucasians it is higher in non-Caucasians. Fairness is to be improved by using the idea of adaptive margin to balance the performance for races on different samples [11].
Machine Learning in Finance to measure the bias and improve the fairness, for this a Machine Learning Pipeline is proposed for pre-training and post-training activities by examining using simple bias mitigating approaches. In order to improve the fairness various Metrics were proposed for bias and classified as Sources of Bias, Measuring Bias, Pre-Training Metrics, and Post-Training Metrics. A well-known and standard dataset German credit dataset was considered for this study and discussed the possible approaches for satisfying the constraints for assessing the fairness in the model [12].
Lum [1] surveyed about 142 research articles on the bias and fairness in the machine learning by presenting the areas where the possible bias will occur and various fairness algorithms to mitigate the bias and suggested various challenges that are to be considered while working on the mitigation of the bias. Due to the wide range of application used by humans these days in our everyday lives and impact of Artificial Systems in the process of engineering and manufacturing, fairness became an important consideration.
Generally, we apply complex solutions to the complex problems and simple solutions to the simple problems, but sometimes the simple models can also predict the better results for the sophisticated as well as for complex problems. When it comes to the research in large areas like market and finance the same logic can also work and give the better results. Forecasting of results mainly rely on two components they are bias and the variance. Brighton, H et al. proposed the model called “bias bias” as most of the researchers often overlooked because of the pervasive and neglects the sensitivity of the model, weights and other different factors [13].
To reduce the faulty decision making by the employees in the organization relying on a technologies like Artificial Intelligence has emerged and performing well with respect to analyze the problems present in the organization. To overcome the unconscious bias that is present in the organization AI has been delve into the employment decisions mainly to mitigate the bias that was mentioned by Houser [14].
As most of time we are working with the system either with textual commands or speech commands, the algorithm bias will occur due to the gender and age which will create systemic negative bias and by incorporating the augmentation in mitigating the bias. Smith and Ricanek [15] used Inception-ResNet-v2 DCNN model to reduce the systemic bias and usage of data augmentation policy (DAP) leads to the better results and also insights the policies to determine the bias.
The main objective is to identify the bias using post training metrics of privileged data and deprived data and then propose which mitigation techniques are suitable for the data set. By developing fair models, decisions made by ML models can be made without prejudice, which enables more transparency and benefits. Mitigating prejudice can be beneficial in the financial and health sectors, as well as in other areas where machine-assisted decisions affect certain sections of society and lead to unfair treatment of certain groups on the basis of age, race and gender.
3.1 Proposed algorithm to detect bias
Step 1: Find the privileged and deprived features of the data by using the pre-training metrics. Features such as Age, Race and Gender are categorized under the unprivileged group.
Step 2: Implement standard classifiers like SVM, Logistic Regression, XGBOOST and KNN Models for prediction to evaluate performance with 2 model types. One is with Unmitigated, and second one is Detection mitigation.
Step 3: Calculate Disparate Impact (DI), Recall Difference (RD), Difference in Positive Proportions (DPP), and Difference in Rejection Rates (DRR), Average Odd Difference (AOD), Accuracy Difference (AD) and Equality Opportunity (EO).
Step 4: Implement Post-Processing step through aggregation of information from classifier models and to achieve fair model.
Step 5: Input classifier, privileged features and threshold parameter for score of a model.
Step 6: Derive a transformation of the classifier’s prediction to enforce the specified fairness constraints. The advantage of this process is it does not need retraining.
Step 7: Minimize the error of EM where M is the set of m classification models to achieve the acceptable fairness.
In our experiment we consider XGBOOST, KNN, SVM, and Logistic Regression models.
$\breve{y}=\oint\left(x_{i}\right)=\sum_{k=1}^{m} f_{m}\left(x_{i}\right)$ where $f_{k} \in M$ (1)
$M=\left\{f(x)=w_{q}(x)\right\}$ (2)
where, q is the classifier that maps xi to y, w is the weight of each class output.
The algorithm solves an optimization problem to find probabilities with which to assign for each xi and calculate the final prediction score.
The optimization function is:
$\frac{1}{2} \sum_{m=1}^{M} \sum_{k=1}^{K}\left[y_{k}\left(x^{m} * w\right)-t_{k}^{m}\right]^{2}$ (3)
where, M is the number of classification models and K is number of output of each model.
3.2 The fairness measures used in this experiment
Disparate Impact (DI): This metrics will help to find the rate of positive outcome’s ratio for the deprived group that of the privileged group.
$D I=q_{d} / q_{\mathrm{p}}$ (4)
where, qp is the ratio of privileged class and qd is the ratio of deprived class.
Recall difference (RD): The difference between the privileged group recall and deprived group recall is calculated, higher recall for the privileged class shows that it finds more of the actual true positives for the advantaged class than the disadvantaged class, which is a form of bias.
$Recall =Recall_{p}-Recall_{d}$ (5)
Difference in Positive Proportions (DPP): The difference in positive proportions in predicted labels (DPP) metric shows whether the model predicts consequences differently for each category. It is defined as the difference between the proportion of positive predictions for privileged group and the proportion of positive predictions for deprived group.
$D P P=q_{p}-q_{d} / q_{p}+q_{d}$ (6)
where, qp is the ratio of privileged class and qd is the ratio of deprived class.
Difference in Rejection Rates (DRR): This metric is used to measure the instances from the privileged and deprived, class are rejected at the same rates. It is the difference in the ratio of true negatives divided by the predicted negatives for each class and is given as:
$D R R=\frac{T N \text { for privileged }}{P N \text { for privileged }}-\frac{T N \text { for deprived }}{P N \text { for deprived }}$ (7)
where, TN is true negatives and PN is predicted negatives.
Equal Opportunity Difference (EOD): This metrics will help to find the true positive rate differences between the privileged groups and deprived groups.
$E O D=\operatorname{Pr}(\wedge y=1 \mid y=1, p=1)-\operatorname{Pr}(\wedge y=1 \mid y=1, d=1)$ (8)
where, p is privileged and d is deprived group.
Average Odds Difference (AOD): This metrics will help to find the average difference of true positive rate (true positives/positives) and the false positive rate (false positives/negatives) between the privileged groups and deprived groups.
$A O D=A V G(p(F P-T P)-d(F P-T P))$ (9)
where, p is privileged and d is deprived group.
This methodology is experimented using Adult dataset contain Grown-up informational collection and with 14 highlights to decide if an individual makes over 50K every year. These informational collections contain highlights which may trigger predisposition like age, gender, race, area and so on. The correlation between the features is measured and tabulated in the Table 1.
Table 1. Correlation between the features and target variable
|
Parameter |
Correlation |
|
marital-status |
-0.437678441 |
|
educational-num |
0.332799879 |
|
relationship |
-0.253402222 |
|
age |
0.237040235 |
|
hours-per-week |
0.227199142 |
|
capital-gain |
0.221033806 |
|
gender |
0.215760458 |
|
capital-loss |
0.148686989 |
|
education |
0.081196401 |
|
race |
0.070844084 |
|
occupation |
0.049787407 |
|
native-country |
0.02010262 |
|
workclass |
0.015659154 |
|
fnlwgt |
-0.007263913 |
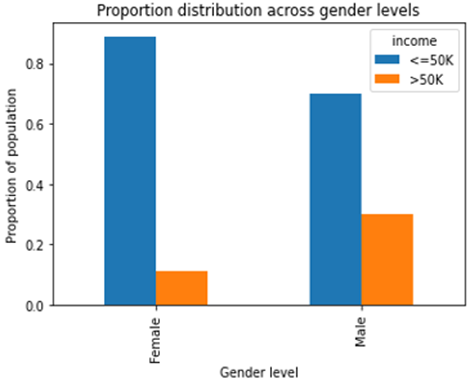
The gender, race, age and capital gain are positively correlated with income. From the study the gender and race are considered as deprived group. The distribution of gender and race in the adult data set is displayed in Figure 1 and Figure 2.
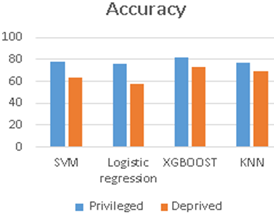
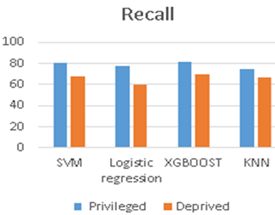
The experimental result shows the accuracy of each model for privilege and deprived groups. The recall value of privileged and deprived groups is the measured and the results are tabulated in Table 2, and the same is represented in the graph in Figure 3 and Figure 4.
Various classification models such as SVM, Logistic Regression, XGBOOST and KNN are applied on the data and the performance of model is measured by Accuracy and Recall. Experimental results are tabulated as shown above in Table 2. We can observe that the accuracy of SVM model for Privileged and Deprived groups is 78 and 62. In the same way Logistic Regression produces 76 and 58 for Accuracy, XGBOOST classifier produces 82 and 73 for Accuracy, and KNN classifier produces 76 and 68 for Accuracy. It shows the significant upturn of accuracy in all the models for the privileged group.
Figure 1. Proportion distribution of gender Vs income
Figure 2. Proportion distribution of race Vs income
Figure 3. The accuracy of classification models
Figure 4. The recall of classification models
Table 2. Accuracy and recall of SVM, logistic regression, XGBOOST and KNN classifier models
|
Classifier Model |
Accuracy |
Recall |
||
|
Privileged |
Deprived |
Privileged |
Deprived |
|
|
SVM |
78 |
62 |
80 |
68 |
|
Logistic Regression |
76 |
58 |
78 |
60 |
|
XGBOOST |
82 |
73 |
82 |
70 |
|
KNN |
77 |
68 |
72 |
64 |
Table 3. Fairness post training metrics for each classification model before mitigation of bias
|
Classifier Model |
Fairness Metric |
||||||
|
DI |
RD |
DPP |
DRR |
AOD |
AD |
EO |
|
|
SVM |
0.743 |
1.19 |
2.15 |
0.45 |
-0.165 |
1.23 |
-0.134 |
|
Logistic Regression |
0.53 |
1.3 |
2.36 |
0.45 |
-0.173 |
1.31 |
-0.123 |
|
XGBOOST |
0.79 |
1.17 |
1.52 |
0.45 |
-0.154 |
1.12 |
-0.117 |
|
KNN |
0.64 |
1.12 |
2.54 |
0.45 |
-0.18 |
1.11 |
-0.23 |
Table 4. Fairness metrics XGBOOST Vs proposed model
|
Metric |
XGBOOST |
Proposed Model |
|
Disparate Impact (DI) |
0.79 |
0.83 |
|
Recall Difference (RD) |
1.17 |
0.98 |
|
Difference in Positive Proportions |
1.52 |
1.01 |
|
Difference in Rejection Rates (DRR) |
0.45 |
0.2 |
|
Average Odd Difference |
-0.154 |
-0.098 |
|
Accuracy Difference (AD) |
1.12 |
0.94 |
|
Equality Opportunity |
-0.117 |
-0.102 |
Table 5. Accuracy and recall of XGBOOST and proposed model
|
Model |
Accuracy |
Recall |
||
|
Privileged |
Deprived |
Privileged |
Deprived |
|
|
XGBOOST |
82 |
73 |
82 |
70 |
|
Proposed Model |
79 |
83 |
80 |
82 |
The fairness post training metrics such as Disparate Impact (DI), Recall Difference (RD), Difference in Positive Proportions (DPP), and Difference in Rejection Rates (DRR), Average Odd Difference (AOD), Accuracy Difference (AD) and Equality Opportunity (EO) are calculated after generating the models and the result are tabulated in Table 3.
From the table we can observe that the disparity is observed more in Logistic regression and less in XGBOOST. Recall difference also significantly more in logistic regression. The Difference in Positive Proportions (DPP) and equal opportunity (EO) scores are less in XGBOOST. These experiments results proved that XGBOOST is the best algorithm to reducing the bias from the list of existing classifier models.
So, the proposed algorithm is compared with XGBOOST as shown in Table 4, and shows that it significantly reduced the bias present in the data and fairness score is increased with 0.48% of reduction in accuracy. To achieve fairness in the model we need to compromise the accuracy.
The accuracy and the recall of the proposed model compared to XGBOOST are tabulated in Table 5. The variance between the privileged and deprived values with respect to the Accuracy and Recall for the XGBOOST Model is more when compared to the Proposed Model which is a key aspect to mitigate the bias present in the data using our proposed model.
In this paper, we proposed an approach that is impartial and empowered to achieve more fairness by leveraging errors present in the classification model and produced the outcome with better fairness. The Proposed approach was able to mitigate the bias present in the datasets by optimizing the variance between privileged and deprived data using post processing method. Various classification models like SVM, Logistic regression, XGBOOST, KNN are used on the datasets and later compared with the proposed model. The experimental result proved that there is significant increase in fairness, and is measured by disparity impact difference in positive proportion and other post training metrics. The systematic approach for mitigating the bias outlined in this paper is scalable and presents a new pathway for assessing the bias in the training data.
I would like to thank the anonymous reviewers for providing the valuable comments and suggestions for my work which helped me to improve this manuscript.
[1] Lum, K. (2017). Limitations of mitigating judicial bias with machine learning. Nature Human Behaviour, 1(7): 141. https://doi.org/10.1038/s41562-017-0141
[2] Khalil, A., Ahmed, S.G., Khattak, A.M., Al-Qirim, N. (2020). Investigating bias in facial analysis systems: A systematic review. IEEE Access, 8: 130751-130761. https://doi.org/10.1109/ACCESS.2020.3006051
[3] Jamali, Z., Deng, J., Cai, J., Aftab, M.U., Hussain, K. (2019). Minimizing vehicle re-identification dataset bias using effective data augmentation method. In 2019 15th International Conference on Semantics, Knowledge and Grids (SKG), Guangzhou, China, pp. 127-130. https://doi.org/10.1109/SKG49510.2019.00030
[4] Procopio, M., Mosca, A., Scheidegger, C.E., Wu, E., Chang, R. (2021). Impact of cognitive biases on progressive visualization. IEEE Transactions on Visualization and Computer Graphics. https://doi.org/10.1109/TVCG.2021.3051013
[5] Yapo, A., Weiss, J. (2018). Ethical implications of bias in machine learning. Proceedings of the 51st Hawaii International Conference on System Sciences, pp. 5365-5372. https://doi.org/10.24251/HICSS.2018.668
[6] Wang, A., Narayanan, A., Russakovsky, O. (2020). REVISE: A tool for measuring and mitigating bias in visual datasets. In European Conference on Computer Vision, Glasgow, UK, pp. 733-751. https://doi.org/10.1007/978-3-030-58580-8_43
[7] Adebayo, J. (2016). FairM: ToolBox for diagnosing bias in predictive modeling. Massachusetts Institute of Technology. http://hdl.handle.net/1721.1/108212.
[8] Choudhury, P., Starr, E., Agarwal, R. (2020). Machine learning and human capital complementarities: Experimental evidence on bias mitigation. Strategic Management Journal, 41(8): 1381-1411. https://doi.org/10.1002/smj.3152
[9] https://lionbridge.ai/articles/7-types-of-data-bias-in-machine-learning, accessed on October 21, 2020.
[10] Griffith, G.J., Morris, T.T., Tudball, M.J., et al. (2020). Collider bias undermines our understanding of COVID-19 disease risk and severity. Nature Communications, 11(1): 5749. https://doi.org/10.1038/s41467-020-19478-2
[11] Morstatter, F. (2016). Detecting and mitigating bias in social media. In 2016 IEEE/ACM International Conference on Advances in Social Networks Analysis and Mining (ASONAM), San Francisco, CA, USA, pp. 1347-1348. https://doi.org/10.1109/ASONAM.2016.7752412
[12] Das, S., Donini, M., Gelman, J., et al. (2021). Fairness measures for machine learning in finance. The Journal of Financial Data Science, 3(4): 33-64. https://doi.org/10.3905/jfds.2021.1.075
[13] Brighton, H., Gigerenzer, G. (2015). The bias bias. Journal of Business Research, 68(8): 1772-1784. https://doi.org/10.1016/j.jbusres.2015.01.061
[14] Houser, K.A. (2019). Can AI solve the diversity problem in the tech industry: Mitigating noise and bias in employment decision-making. Stan. Tech. L. Rev., 22: 290-353.
[15] Smith, P., Ricanek, K. (2020). Mitigating algorithmic bias: Evolving an augmentation policy that is non-biasing. In Proceedings of the IEEE/CVF Winter Conference on Applications of Computer Vision Workshops, Snowmass, CO, USA, pp. 90-97. https://doi.org/10.1109/WACVW50321.2020.9096905