Kishore Babu Dasari* | Nagaraju Devarakonda
© 2022 IIETA. This article is published by IIETA and is licensed under the CC BY 4.0 license (http://creativecommons.org/licenses/by/4.0/).
OPEN ACCESS
The Distributed Denial of Service (DDoS) attack is a serious cyber security attack that attempts to disrupt the availability security principle of computer networks and information systems. It's critical to detect DDoS attacks quickly and accurately while using as less computing power as possible in order to minimize damage and cost efficient. This research proposes a fast and high-accuracy detection approach by using features selected by proposed method for Exploitation-based DDoS attacks. Experiments are carried out on the CICDDoS2019 datasets Syn flood, UDP flood, and UDP-Lag, as well as customized dataset. In addition, experiments were also conducted on a customized dataset that was constructed by combining three CICDDoS2019 datasets. Pearson, Spearman, and Kendall correlation techniques have been used for datasets to find un-correlated feature subsets. Then, among three un-correlated feature subsets, choose the common un-correlated features. On the datasets, classification techniques are applied to these common un-correlated features. This research used conventional classifiers Logistic regression, Decision tree, KNN, Naive Bayes, bagging classifier Random forest, boosting classifiers Ada boost, Gradient boost, and neural network-based classifier Multilayer perceptron. The performance of these classification algorithms was also evaluated in terms of accuracy, precision, recall, F1-score, specificity, log loss, execution time, and K-fold cross-validation. Finally, classification techniques were tested on a customized dataset with common features that were common in all of the dataset’s common un-correlated feature sets.
CICDDoS2019, classification algorithms, DDoS attacks, Kendall correlation, Pearson correlation, spearman correlation, syn flood, UDP flood, UDP-Lag
Availability-based attacks are network security attacks carried out by a malicious node with the goal of denying access to resources on computer networks. Denial of service (DoS) is an available-based security attack in which the attacker aims to make network resources unavailable to its intended users by temporarily or indefinitely disrupting the services of a host connected to a network. A DoS attack launched by more than one attacker is called a Distributed Denial of Service (DDoS) attack [1].
DDoS attacks make use of a variety of vulnerabilities in the TCP/UDP-based protocols at the application layer to deny its users are called Exploitation based DDoS attacks. DDoS has become more prevalent among cyberattacks due to the extensive use of TCP protocol and easier to exploit features of the TCP three-way handshake mechanism. Syn flood is a TCP-based exploitation DDoS attack, UDP flood, and UDP-Lag are UDP-based exploitation DDoS attacks.
SYN flood [2] is a commonly used exploitation-based DDoS attack that exploits the advantage of a feature of the TCP three-way handshake to overflow the TCP queue of the server and make it consume resources resulting in it being unavailable to legitimate users' requests. A TCP connection is established between a client and a server using the TCP three-way handshake mechanism. A client must send a synchronized flag packet (SYN) to the server to establish a TCP connection. The server sends the client an acknowledgment flag for the synchronized packet (SYN-ACK) after receiving the SYN packet delivered by the client. The client sends an acknowledgment flag to the server after receiving the SYN-ACK flag from the server. With these three steps, a connection between the client and the server is established, and data transformation can now commence. In order to launch a TCP SYN flood attack on a server, attackers take advantage of the server's half-opened connection state. This is the state in which the server is waiting for the client's ACK flag before attempting to establish a connection. The server would have already allocated Memory resources to the client at this point. To take advantage of this behavior, the attacker sends a large number of SYN flags to the server for a number of spoofed IP addresses. The server treats these requests as legitimate, allocating memory and resources to these IP sources and sending the client a SYN-ACK flag. The server would now wait in a half-open state for the client to respond with an ACK flag which would never receive. The attacker's large number of illegitimate SYN requests leads the TCP backlog queue to overflow, resulting in half-opened connections until all system resources are consumed. The legitimate user's request is not accepted by the server due to an overflow of the TCP queue. The primary objective of the TCP SYN flood attack is to disrupt the system's availability.
UDP flood [3] refers to a type of exploitation-based DDoS attack in which the attacker overflows random ports on the targeted host with IP packets containing UDP datagrams. UDP flood attack’s main objective is to saturate the Internet pipe. A UDP flood operates by taking advantage of the steps taken by a server when responding to UDP packets transmitted to one of its ports. When a server receives a UDP packet at a specific port, it goes through two steps in response to normal circumstances: First, the server looks to determine if any programs are currently listening for requests on the specified port. If no programs are receiving packets on that port, the server sends an ICMP (ping) message to the sender to alert them that the destination is unavailable. When the server receives a new UDP packet, it goes through a series of steps to process the request, consuming server resources in the process. When a huge flood of UDP packets is received from different sources with spoof IP addresses, the target's resources can quickly become exhausted as a result of the targeted server using resources to check and then respond to each single UDP packet.
The UDP-Lag attack [4] is an attempt to break the connection between the client and the server. This attack is most commonly used in online gaming to outsmart other players slowing down/interrupting their movement. This attack can be carried out in two ways: using a hardware switch known as a lag switch, or with a software program that runs on the network and consumes other users' bandwidth.
According to research findings on DDoS attacks, due of their distributed nature, fast detection, less computation, and accuracy in detection is three key challenges in DDoS attack detection. DDoS attacks have caused significant damage in all aspects of business; hence, early detection is essential. As computation is so expensive these days, reducing the number of features is essential to make the computation process more cost-effective. To avoid inconvenience to legitimate users, accurate detection is essential. This research proposes a method for select the un-correlated feature subset using three correlation techniques. It builds a fast and high-accuracy DDoS attack detection approach with very few features.
This section introduces the TCP/UDP based Exploitation DDoS attacks and the research motivation and objective of detecting DDoS attacks. In section II of this paper, the methodology is explained, including proposed framework, algorithm, preprocessing, and machine learning classification algorithms. The results and discussion are explained with experimental results in section III of this paper. The study's conclusion is found in Section IV of this paper.
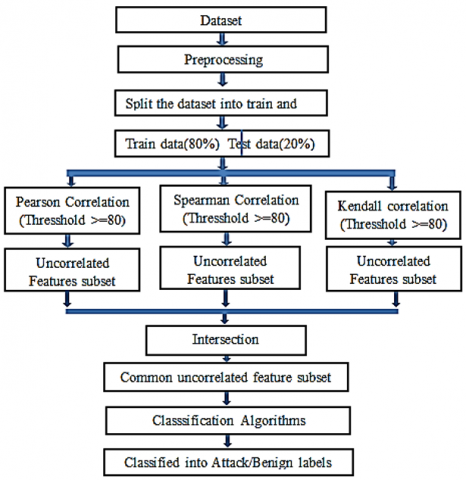
Proposed model framework depicted in Figure 1.
Proposed Algorithm
Figure 1. Proposed model framework
Data set
This study uses the CICDDoS2019 data set which includes a wide variety of DDoS attacks and fills up the gaps in the previous data sets. Every DDoS attack dataset contains 87 features.
Data preprocessing
Data Preprocessing [5] is the first and most important step in building a classification model. It is a process of clean and formatted data suitable for the classification model. It increases the accuracy and efficiency of classification models. First, remove socket features that vary from network to network. Next to clean the data by removing missing and infinity values. Encoding the label string values for Benign and attack label to the binary value of 0 and 1 respectively. And finally, standardize the independent feature values. Initially each dataset contains 88 features, after removing uninfluential socket features each dataset contain 81 features. Pre-processing results are statistically shown in Figure 2 with a bar chart in order of the number of records processed.
Feature selection
Feature Selection [6] is a very critical component in Machine learning algorithms. Machine learning algorithms typically choke when provided with data with a large dimensionality because the number of features raises the training time exponentially and an increasing amount of features, models run the risk of overfitting. Feature Selection methods help in the resolution of these issues by reducing the dimensions while preserving the overall information. It also helps in identifying the features and their importance. Variance threshold and correlation feature selection methods are used in this study. A variance threshold is used to remove constant and quasi-constant features. Correlation methods are used to find uncorrelated features.
Figure 2. Pre-processing results bar-chart
Variance threshold
A simple baseline technique for feature selection is the variance threshold. This method eliminates features that vary below a specific threshold. It removes all zero-variance features by default, that is, features that have the same value throughout all samples. More useful information is contained in features with a higher variance. The variance threshold doesn’t consider the relationship of features with the target variable.
Correlation
Correlation [5] is a bivariate analysis that determines the level of association and the direction of the relationship between two variables. The value of the correlation coefficient varies between +1 and -1 in terms of the strength of the association. A value of ±1 shows that the two variables are perfectly associated. The value of 0 shows that the two variables are weakly associated. The sign of the coefficient specifies the relationship's direction; +sign indicates a positive relationship that means one variable goes up, then the second variable also goes up, while –sign indicates a negative relation that means one variable increase then another variable decrease.
We can predict one variable from the other using correlation. When two features are correlated, the model only needs one of them, as the other does not provide any extra information. This study uses three types of correlations: Pearson correlation, Spearman correlation, and Kendall rank correlation.
Pearson correlation
The Pearson correlation is the most generally used correlation statistic for determining the degree of association between linearly related variables. The Pearson correlation is based on information about the mean and standard deviation.
Pearson correlation coefficient calculated by:
$r=\frac{\sum\left(x_{i}-\bar{x}\right)\left(y_{i}-\bar{y}\right)}{\sqrt{\sum\left(x_{i}-\bar{x}\right)^{2} \sum\left(y_{i}-\bar{y}\right)}}$ (1)
Here,
r is the correlation coefficient;
xi - is the value of the x-feature in a sample;
$\bar{x}$– is the mean of the values of the x-feature;
yi - is the value of the y-feature in a sample;
$\bar{y}$– is the mean of the values of the y-feature.
Spearman correlation
Spearman rank correlation is a non-parametric measure of correlation used to determine the degree of relationship between two variables. Non-parametric correlations rely solely on ordinal data and pair scores. The Pearson correlation between the rank scores of two variables is equivalent to the Spearman correlation between those two variables. Spearman's correlation evaluates monotonic relationships, whereas Pearson's correlation evaluates linear relationships.
The strength of a monotonic relationship between two variables with the same scaling as the Pearson correlation is measured by the Spearman correlation.
Spearman correlation coefficient calculated by:
$\rho=1-\frac{6 \sum d_{i}^{2}}{n\left(n^{2}-1\right)}$ (2)
Here,
ρ is the Spearman’s rank correlation coefficient;
di is the difference between the two ranks of each observation;
n is the number of observations.
Kendall rank correlation
Kendall rank correlation is a non-parametric test that assesses the degree of association between two variables. Non-parametric correlations rely solely on ordinal data and pair scores. Kendall correlation outperforms Spearman correlation in terms of robustness and efficiency. When there are few samples or some outliers, Kendall correlation is preferred.
Kendall correlation coefficient calculated by:
$\tau=\frac{N_{c}-N_{d}}{\frac{n(n-1)}{2}}$ (3)
Here,
τ is the Kendall rank correlation coefficient;
Nc is the number of concordant;
Nd is the number of discordant.
Classification algorithms
Machine learning is becoming more widely used to detect and classify DDoS attacks [7]. One of the most important steps in machine learning algorithms is feature selection. Feature Selection is essential for reducing dimensionality and removing redundant and irrelevant features.
Logistic regression
Logistic regression [8] is a machine learning classification method borrowed from statistics to predict the target variable. It uses the logistic function also called as the Sigmoid function. Sigmoid function is:
$\varnothing(z)=\frac{1}{1+e^{-z}}$ (4)
Here z is the input which is the linear combination of weights and features.
$z=w^{T} x=w_{0}+w_{1} x+w_{2} x^{2}+\ldots \ldots+w_{n} x^{n}$ (5)
ϕ(z) values limits in the range [0,1]. It indicates that if z goes to infinity, the function becomes one, and if z goes minus infinity, the function reaches zero.
Decision tree
Decision Tree [9] is a supervised learning method that can be used to display a model's visual representation. A decision tree employs a hierarchical model resembling a flow chart with multiple connected nodes. These nodes indicate tests on the dataset's features, with a branch that leads to either another node or a classification result. The prediction data is passed through the nodes until it can be classified, with the training data used to form the tree.
K-Nearest neighbor
One of the most basic machine learning classification models is K-Nearest Neighbor (KNN) [10]. With KNN, there is no training; the training data is used to make predictions in order to classify the data. KNN works on the notion that comparable data points would group together, and it uses the K value, which can be any number, to locate the closest data points.
Naive bayes classifier
A typical NB classifier [11] also relies on Bayes’ theorem and applies probability density information to the training data. It is used to calculate the chance of an event occurring based on previous occurrences that have occurred.
Random forest
The random forest [12] is based on the principle of bagging, which is used to train a number of decision trees and enhance them based on their attributes. Random attribute selection is used in the random forest training process to improve the relative independence of the generated decision tree and hence improve performance. Assuming that there are n nodes, the standard decision tree selects the best attribute based on all of the n nodes' characteristics, but each node of the random forest's decision tree is based on k attributes that are randomly selected in advance. The magnitude of the k parameter, which is commonly set to log2 d, determines the degree of randomness. Furthermore, the k value can be 1 or d, which reflects a random selection of an attribute and a selection procedure utilizing a traditional decision tree, respectively.
Ada boost
AdaBoost, also known as Adaptive Boosting [13], is a Machine Learning ensemble classification model. It is an iterative ensemble classification algorithm that means weak learners grow sequentially and become strong ones. The classifier should be interactively trained using a variety of weighted training instances. It tries to provide an excellent fit for these instances in each iteration by minimizing training errors.
Gradient boost
Gradient Boost [14] is an ensemble boosting classification algorithm that combines several weak learners into strong learners. Gradient Boosting classification algorithm depends on the loss function. The gradient descent optimization procedure is used to determine the contribution of the weak learner to the ensemble.
Multilayer perceptron
A multilayer perceptron (MLP) [15] is the most standard form of feed-forward artificial neural network. MLP consists of an input layer to receive input data, output layers that make predictions about the input, and at least one hidden layer is capable of approximating any continuous function.
The objective of this study has been to reduce data computation and execution time in order to improve the accuracy of TCP/UDP-based exploitation DDoS attack detection. Data processing or computation is accomplished by reducing the number of features in the input data sets. Data computation is proportionate to the model's execution time. It means that as data computation time reduces, execution time significantly reduces as well. So, the main objectives of this paper is to reduce the number of features in data sets without decreasing the accuracy of exploitation-based DDoS attack detection. In this paper, we propose a model for reducing the number of features with improving DDoS attack detection accuracy. The proposed model depicted in Figure 1. TCP/UDP-based exploitation DDoS attack data sets are collected for this study from the CICDDoS2019 data set, which contains various TCP/UDP based DDoS attack data sets. Syn flood is TCP based exploitation DDoS attack data set while UDP flood and UDP-Lag are UDP based exploitation DDoS attack data sets. Experiments have also been conducted on a customized exploitation DDoS attack data set in this research. Concatenated 400000 records from each of the Syn-flood, UDP flood, and UDP-Lag datasets to create a customized exploitation DDoS attack data set.
In this section results are discussed in the order of removing constant and quasi-constant features by using variance threshold, finding un-correlated feature subsets with Pearson, Spearman and Kendall correlation methods, finding common un-correlated features from un-correlated feature subsets of Pearson, Spearman and Kendall correlation methods, discussed performance evaluation metrics of classification algorithms with common uncorrelated feature subsets on TCP/UDP based exploitation DDoS attack datasets of Syn-flood, UDP-flood, UDP-Lag and customized DDoS attack and finally discussed performance evaluation metrics of classification algorithms on customized dataset with common features that were common in all of the dataset’s common un-correlated feature sets.
After pre-processing, variance threshold filter-based feature selection is being used to remove constant and quasi-constant features from the data sets in order to reduce the number of features. The features that are almost constant are known as quasi-constant features. Constant features have a variance threshold value of 0, whereas quasi-constant features have a variance threshold value of 0.01. Constant features are those that have the same value across the entire dataset's rows. Remove these features because they provide no information to the classification algorithms. Table 1 shows the number of constant and quasi-constant feature counts for the Syn flood, UDP flood, UDP-Lag, and customized exploitation data sets.
Table 1. Number of constant and quasi-constant features of TCP/UDP Exploitation-based DDoS attack data sets
|
Data Set |
Number of Constant Features (Variance Threshold=0) |
Number of Quasi-constant Features (Variance Threshold=0.01) |
|
Syn Flood attack |
12 |
7 |
|
UDP flood attack |
12 |
8 |
|
UDP-Lag attack |
12 |
5 |
|
Customized Exploitation DDoS attack |
12 |
6 |
Table 2. Number of correlated features, which has a threshold value >= 80 by Pearson, Spearman, and Kendall correlation methods for TCP/UDP Exploitation-based DDoS attack data sets
|
Correlation Methods |
|||
|
Data Sets |
Pearson |
Spearman |
Kendall |
|
Syn Flood attack |
37 |
50 |
48 |
|
UDP flood attack |
34 |
46 |
46 |
|
UDP-Lag attack |
36 |
50 |
46 |
|
Customized Exploitation DDoS attack |
39 |
48 |
47 |
Table 3. Number of common un-correlated features count with a proposed feature selection method on TCP/UDP Exploitation-based DDoS attack data sets
|
Data Set |
Number of common un-correlated features |
|
Syn Flood attack |
9 |
|
UDP flood attack |
11 |
|
UDP-Lag attack |
10 |
|
Customized Exploitation DDoS attack |
12 |
Apply the Pearson, Spearman, and Kendall correlations individually on the exploitation-based DDoS attack data sets after deleting constant and quasi-constant features, then collect un-correlated features sub-sets of each correlation method. Table 2 shows the number of correlated feature counts for the Syn flood, UDP flood, UDP-Lag, and customized exploitation data sets. To find the common un-correlated feature subset, apply intersection to un-correlated feature subsets of the Pearson, Spearman, and Kendall correlation methods. Table 3 shows the number of common un-correlated feature counts for the Syn flood, UDP flood, UDP-Lag, and customized exploitation data sets. Table 4 shows the common un-correlated feature list for the Syn flood, UDP flood, UDP-Lag, and customized exploitation data sets. Unnamed: 0, Flow Duration, Flow IAT Min, Total Length of Bwd Packets, and Protocol are common in the lists of common un-correlated features of Syn flood, UDP flood, UDP-Lag, and customized exploitation DDoS attack data sets. Classification algorithms are applied to Syn flood, UDP flood, UDP-Lag, and customized exploitation DDoS attack data sets with their common un-correlated feature subsets and results evaluated. On customized exploitation DDoS attack data set with common features in the lists of common un-correlated features of Syn flood, UDP flood, UDP-Lag, and customized exploitation DDoS attack data sets, classification algorithms are applied and the results also evaluated.
Confusion matrix
The actual and predicted values of label classes are displayed in a confusion matrix. It shows the four key values that are True Positive, False Negative, False Positive, and True Negative. These values are used to calculate the evaluation metrics.
TRUE POSITIVE (TP): The amount of DDoS attacks properly identified by the classifier.
TRUE NEGATIVE (TN): The number of BENIGN class labels accurately detected by the classifier.
FALSE POSITIVE (FP): The number of BENIGN class labels, classified as DDoS attacks by the classifier.
FALSE NEGATIVE (FN): The number of DDoS attack labels, classified as BENIGN class labels by the classifier.
Accuracy
Accuracy is defined as the proportion of benign and attack data in the right classification to the total data.
$A C C U R A C Y=\frac{T P+T N}{T P+T N+F P+F N}$ (6)
Precision
Precision refers to the ratio of the number of attacks correctly classified into attacks to the entire proportion of attack data, which indicates the model's capability to detect attack data.
$A C C U R A C Y=\frac{T P+T N}{T P+T N+F P+F N}$ (7)
Recall/TPR
The recall or true positive rate (TPR) is the percentage of accurately detected attack data instances among all attack data.
$A C C U R A C Y=\frac{T P+T N}{T P+T N+F P+F N}$ (8)
F1-Score
The F1 score is the weighted average precision and recall. Logistic Regression, Gradient Boost, and Naive Bayes provide the best F-score value. Ada Boost and KNN almost provide the best F1-score value. Decision Tree also provides a poor F1-score value.
$F 1$ Score $=\frac{2 * \text { Precision } * \text { Recall }}{\text { Precision }+\text { Recall }}$ (9)
Specificity
Specificity is the ratio of the truly classified BENIGN class labels out of the total actual BENIGN class labels.
Specificity $=\frac{T N}{T N+F P}$ (10)
Table 5 shows performance evaluation metrics in terms of accuracy, precision, recall, F-score, and specificity for the different classification algorithms on Syn flood attack with common un-correlated features. The classification methods of multilayer perceptron and Ada boost produce the best accuracy results compared to others. For attack classification, all classification methods produce good results in terms of precision, recall, and F-score. Multilayer perceptron produces better precision and F-score values for benign classification, while KNN produces better recall values. For attack classification, logistic regression produces a better specificity value. All classification methods produce better specificity values for benign classification.
Table 6 shows performance evaluation metrics in terms of accuracy, precision, recall, F-score, and specificity for the different classification algorithms on UDP flood attacks with common un-correlated features. The classification methods of KNN, Ada boost, and multilayer perceptron produce the best accuracy results compared to others. In terms of precision, recall, and F-score, all classification algorithms produce good results for attack classification. Multilayer perceptron produces the best precision score, random forest produces the best recall score, and KNN produces the best F-score value for benign classification. Except for Naive Bayes, all classification methods produce good specificity scores for benign classification. For attack classification, logistic regression and Naive Bayes produce a high specificity score.
Table 7 shows performance evaluation metrics in terms of accuracy, precision, recall, F-score, and specificity for the different classification algorithms on UDP-Lag attacks with common un-correlated features. Random Forest and multilayer perceptron produce the best accuracy results compared to other classifiers. All classification algorithms produce good results for attack classification in terms of precision, recall, and F-score except Naive Bayes classifier. Ada Boost and Multilayer perceptron produce the best precision results, while Logistic regression produces the best recall value and KNN, Random forest, and Multilayer perceptron produce the best F-score values for benign classification. Logistic regression produces the best specificity score for attack classification. All classification algorithms produce good results for benign classification in terms of specificity except the Naive Bayes classifier.
Table 8 shows performance evaluation metrics in terms of accuracy, precision, recall, F-score, and specificity for the different classification algorithms on Customized Exploitation DDoS attacks with common un-correlated features. Multilayer perceptron produces the best accuracy results compared to other classifiers. All classification algorithms produce good results for attack classification in terms of precision, recall, and F-score. The random forest produces the best precision score, while Logistic regression produces the best recall value and KNN produces the best F score value for benign classification. All classification algorithms produce good results for benign classification in terms of specificity. Logistic regression produces the best specificity value for attack classification.
K-fold cross validation
Cross-fold validation is a statistical method for evaluating machine learning classification models. A test set should still be kept aside for final evaluation when employing Cross-validation, but the validation set is no longer required. The training set is partitioned into k smaller sets in a k-Cross-fold validation. The training data for a model is taken from k-1 folds. After that, the model is tested against the remaining data.
Table 4. Common un-correlated feature list with a proposed feature selection method on TCP/UDP Exploitation-based DDoS attack data sets
|
|
Syn Flood attack |
UDP flood attack |
UDP-Lag attack |
Customized Exploitation DDoS attack |
|
1 |
Unnamed: 0 |
Unnamed: 0 |
Unnamed: 0 |
Unnamed: 0 |
|
2 |
Flow Duration |
Flow Duration |
Flow Duration |
Flow Duration |
|
3 |
Flow IAT Min |
Flow IAT Min |
Flow IAT Min |
Flow IAT Min |
|
4 |
Total Length of Bwd Packets |
Total Length of Bwd Packets |
Total Length of Bwd Packets |
Total Length of Bwd Packets |
|
5 |
Protocol |
Protocol |
Protocol |
Protocol |
|
6 |
min_seg_size_forward |
min_seg_size_forward |
Inbound |
min_seg_size_forward |
|
7 |
Fwd Packet Length Std |
Fwd Packet Length Max |
Fwd Packet Length Std |
Fwd Packet Length Std |
|
8 |
Total Backward Packets |
Bwd Packet Length Min |
Total Backward Packets |
Total Backward Packets |
|
9 |
Total Fwd Packets |
Active Std |
Active Std |
Active Std |
|
10 |
|
Fwd Header Length |
Fwd Header Length |
Fwd Header Length |
|
11 |
|
Active Mean |
|
Active Mean |
|
12 |
|
|
|
Down/Up Ratio |
Table 5. Accuracy, Precision, Recall, F-score and Specificity score values of the classification algorithms with common un-correlated feature subset selected by the proposed model on Syn flood attack dataset
|
Classification algorithms |
Precision |
Recall |
F-Score |
Specificity |
Accuracy (%) |
||||
|
Attack |
Benign |
Attack |
Benign |
Attack |
Benign |
Attack |
Benign |
||
|
Logistic Regression |
1.00 |
0.01 |
0.97 |
0.84 |
0.99 |
0.02 |
0.84 |
0.97 |
97.06 |
|
Decision Tree |
1.00 |
0.21 |
1.00 |
0.72 |
1.00 |
0.32 |
0.72 |
1.00 |
99.89 |
|
KNN |
1.00 |
0.03 |
0.99 |
0.82 |
0.99 |
0.05 |
0.82 |
0.99 |
98.91 |
|
Naive Bayes |
1.00 |
0.33 |
1.00 |
0.80 |
1.00 |
0.47 |
0.80 |
1.00 |
99.93 |
|
Random Forest |
1.00 |
0.24 |
1.00 |
0.78 |
1.00 |
0.36 |
0.78 |
1.00 |
99.90 |
|
Ada Boost |
1.00 |
0.71 |
1.00 |
0.50 |
1.00 |
0.59 |
0.50 |
1.00 |
99.97 |
|
Gradient Boost |
1.00 |
0.22 |
1.00 |
0.79 |
1.00 |
0.35 |
0.79 |
1.00 |
99.89 |
|
Multilayer Perceptron |
1.00 |
1.00 |
1.00 |
0.48 |
1.00 |
0.64 |
0.48 |
1.00 |
99.98 |
Table 6. Accuracy, Precision, Recall, F-score and Specificity score values of the classification algorithms with common un-correlated feature subset selected by the proposed model for the UDP flood attack
|
Classification algorithms |
Precision |
Recall |
F-Score |
Specificity |
Accuracy (%) |
||||
|
Attack |
Benign |
Attack |
Benign |
Attack |
Benign |
Attack |
Benign |
||
|
Logistic Regression |
1.00 |
0.58 |
1.00 |
1.00 |
1.00 |
0.73 |
1.00 |
1.00 |
99.92 |
|
Decision Tree |
1.00 |
0.46 |
1.00 |
0.77 |
1.00 |
0.57 |
0.77 |
1.00 |
99.88 |
|
KNN |
1.00 |
0.93 |
1.00 |
0.83 |
1.00 |
0.88 |
0.83 |
1.00 |
99.98 |
|
Naive Bayes |
1.00 |
0.00 |
0.04 |
1.00 |
0.07 |
0.00 |
1.00 |
0.04 |
3.87 |
|
Random Forest |
1.00 |
0.64 |
1.00 |
0.94 |
1.00 |
0.76 |
0.94 |
1.00 |
99.94 |
|
Ada Boost |
1.00 |
0.90 |
1.00 |
0.79 |
1.00 |
0.84 |
0.79 |
1.00 |
99.97 |
|
Gradient Boost |
1.00 |
0.70 |
1.00 |
0.23 |
1.00 |
0.35 |
0.23 |
1.00 |
99.91 |
|
Multilayer Perceptron |
1.00 |
0.95 |
1.00 |
0.67 |
1.00 |
0.78 |
0.67 |
1.00 |
99.96 |
Table 7. Accuracy, Precision, Recall, F-score and Specificity score values of the classification algorithms with common un-correlated feature subset selected by the proposed model for the UDP - Lag attack
|
Classification algorithms |
Precision |
Recall |
F-Score |
Specificity |
Accuracy (%) |
||||
|
Attack |
Benign |
Attack |
Benign |
Attack |
Benign |
Attack |
Benign |
||
|
Logistic Regression |
1.00 |
0.17 |
0.95 |
0.93 |
0.97 |
0.28 |
0.93 |
0.95 |
94.77 |
|
Decision Tree |
1.00 |
0.28 |
0.97 |
0.86 |
0.99 |
0.42 |
0.86 |
0.97 |
97.37 |
|
KNN |
1.00 |
0.93 |
1.00 |
0.89 |
1.00 |
0.91 |
0.89 |
1.0 |
99.80 |
|
Naive Bayes |
1.00 |
0.01 |
0.01 |
1.00 |
0.01 |
0.02 |
1.00 |
0.01 |
01.63 |
|
Random Forest |
1.00 |
0.94 |
1.00 |
0.88 |
1.00 |
0.91 |
0.88 |
1.00 |
99.81 |
|
Ada Boost |
1.00 |
0.98 |
1.00 |
0.76 |
1.00 |
0.86 |
0.76 |
1.00 |
99.71 |
|
Gradient Boost |
1.00 |
0.90 |
1.00 |
0.87 |
1.00 |
0.89 |
0.87 |
1.00 |
99.75 |
|
Multilayer Perceptron |
1.00 |
0.98 |
1.00 |
0.85 |
1.00 |
0.91 |
0.85 |
1.00 |
99.81 |
Table 8. Accuracy, Precision, Recall, F-score and Specificity score values of the classification algorithms with common un- correlated feature subset selected by the proposed model for the Customized Exploitation DDoS attack
|
Classification algorithms |
Precision |
Recall |
F-Score |
Specificity |
Accuracy (%) |
||||
|
Attack |
Benign |
Attack |
Benign |
Attack |
Benign |
Attack |
Benign |
||
|
Logistic Regression |
1.00 |
0.15 |
0.98 |
0.92 |
0.99 |
0.25 |
0.92 |
0.98 |
97.55 |
|
Decision Tree |
1.00 |
0.07 |
0.96 |
0.71 |
0.98 |
0.13 |
0.71 |
0.96 |
95.81 |
|
KNN |
1.00 |
0.87 |
1.00 |
0.90 |
1.00 |
0.89 |
0.90 |
1.00 |
98.90 |
|
Naive Bayes |
1.00 |
0.35 |
1.00 |
0.55 |
1.00 |
0.43 |
0.55 |
1.00 |
99.35 |
|
Random Forest |
1.00 |
1.00 |
1.00 |
0.66 |
1.00 |
0.80 |
0.66 |
1.00 |
99.85 |
|
Ada Boost |
1.00 |
0.96 |
1.00 |
0.06 |
1.00 |
0.11 |
0.06 |
1.0 |
99.58 |
|
Gradient Boost |
1.00 |
0.86 |
1.00 |
0.74 |
1.00 |
0.79 |
0.74 |
1.00 |
99.83 |
|
Multilayer Perceptron |
1.00 |
0.99 |
1.00 |
0.75 |
1.00 |
0.85 |
0.75 |
1.00 |
99.88 |
Table 9. K-fold cross-validation accuracy scores (with a standard deviation) in % of the different classification algorithms with common un-correlated feature subset selected by the proposed model
|
Classification Algorithms |
Syn flood attack |
UDP flood attack |
UDP-Lag attack |
Customized Exploitation DDoS attack |
|
Logistic Regression |
92.4385(0.7917) |
99.9141(0.0111) |
95.4938(0.1625) |
97.0752(0.0245) |
|
Decision Tree |
99.9974 (0.0009) |
99.9831(0.0021) |
99.9723(0.0064) |
99.9558(0.0036) |
|
KNN |
99.9960 (0.0010) |
99.9774(0.0035) |
99.8371(0.0079) |
99.9342(0.0033) |
|
Naive Bayes |
99.9138 (0.0032) |
99.4898(0.0181) |
99.3405(0.0291) |
99.3236(0.0594) |
|
Random Forest |
99.9978 (0.0006) |
99.9630(0.0061) |
99.9835(0.0060) |
99.9316(0.0042) |
|
Ada Boost |
99.9868 (0.0022) |
99.9731(0.0041) |
99.7678(0.0190) |
99.8365(0.0112) |
|
Gradient Boost |
99.9925 (0.0024) |
99.9176(0.0360) |
99.9165(0.0169) |
99.8549(0.0309) |
|
Multilayer Perceptron |
99.9844(0.0130) |
99.9609(0.0059) |
99.7955(0.0082) |
99.9104(0.0138) |
Table 10. ROC-AUC Scores of the different classification algorithms with common un-correlated feature subset selected by the proposed model
|
Classification Algorithms |
Syn flood attack |
UDP flood attack |
UDP-Lag attack |
Customized Exploitation DDoS attack |
|
Logistic Regression |
0.9375 |
0.9998 |
0.9907 |
0.9892 |
|
Decision Tree |
0.8593 |
0.8821 |
0.9167 |
0.8364 |
|
KNN |
0.9070 |
0.9635 |
0.9529 |
0.9777 |
|
Naive Bayes |
0.9154 |
0.9997 |
0.8921 |
0.9369 |
|
Random Forest |
0.9566 |
0.9999 |
0.9950 |
0.8364 |
|
Ada Boost |
0.9037 |
0.9999 |
0.9949 |
0.9950 |
|
Gradient Boost |
0.9381 |
0.6153 |
0.9933 |
0.9204 |
|
Multilayer Perceptron |
0.9681 |
0.9999 |
0.9941 |
0.9948 |
Table 9 shows K-fold cross-validation accuracy scores (with a standard deviation) in % of the different classification algorithms with common un-correlated feature subset on Syn flood, UDP flood, UDP-Lag, and Customized Exploitation DDoS attacks. Random forest produces the best K-fold cross validation accuracy score with less standard deviation while logistic regression produces lowest value on Syn flood DDoS attack dataset. On the UDP flood DDoS attack dataset, decision tree produces the best K-fold cross validation accuracy score with less standard deviation, whereas Naive Bayes produces the lowest value. Random forest produces the best K-fold cross validation accuracy score with less standard deviation while logistic regression produces lowest value on UDP-Lag DDoS attack dataset. On the customized exploitation DDoS attack dataset, decision tree produces the best K-fold cross validation accuracy score with less standard deviation, whereas logistic regression produces the lowest value.
ROC-AUC score
The Receiver Operating Characteristic (ROC) curve is used to evaluate the model's accuracy. The ROC curve depicts the relationship between True and False classes. The area underneath the ROC Curve (AUC) measures separability between false positive and true positive rates. A ROC curve is a graph that shows a classification model's performance overall decision threshold. A decision threshold is a value used to translate a probabilistic prediction into a class label. Scores between 0 and 1 on the ROC-AUC. When the ROC-AUC value is 1, the classifier correctly classifies all labels. When the ROC-AUC value is zero, the classifier classifies all labels not accordingly, that is, it classifies TRUE labels as FALSE labels and FALSE labels as TRUE labels.
The ratio of benign data misclassification to the proportion of all attack data filled with abnormal data is known as the false-positive rate.
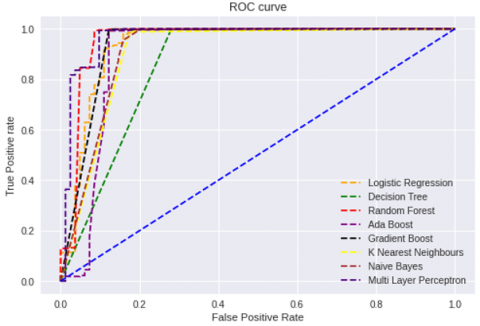
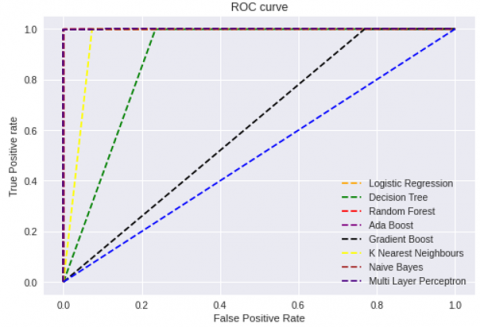
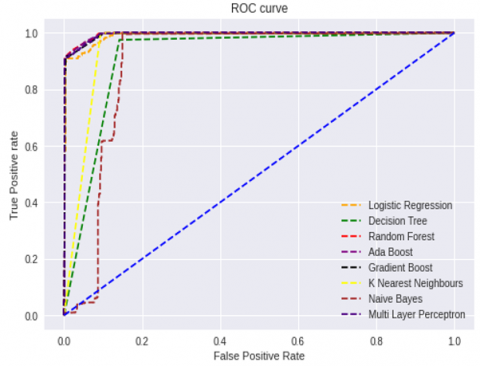
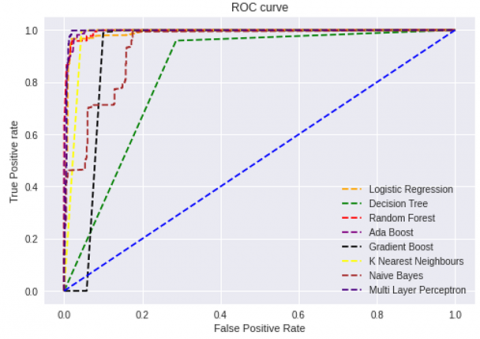
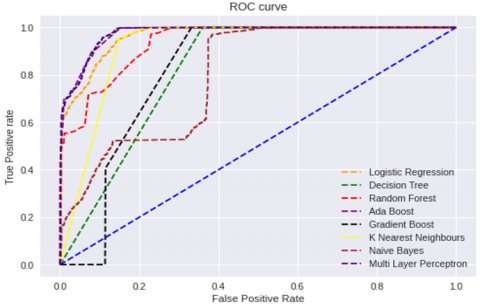
Table 10 shows ROC-AUC Scores of the different classification algorithms with common un-correlated feature subset on Syn flood, UDP flood, UDP-Lag, and Customized Exploitation DDoS attacks. On a Syn flood attack, Multilayer Perceptron produces the best ROC-AUC score, while Decision Tree produces a lesser ROC-AUC score. Figure 3 shows the Receiver Operating Curve (ROC) of the classification algorithms with common un-correlated feature subset selected by the proposed model for Syn flood attack. On UDP flood attacks, Random forest, Ada boost, and Multilayer perceptron produce the best ROC-AUC scores, whereas Gradient boost produces the lowest ROC-AUC scores. Figure 4 shows the Receiver Operating Curve (ROC) of the classification algorithms with common un-correlated feature subset selected by the proposed model for the UDP flood attack. Random forest and Ada boost produce the best ROC-AUC scores for UDP-Lag attacks, whereas Naïve Bayes classifier produces the lowest ROC-AUC score. Figure 5 shows the Receiver Operating Curve (ROC) of the classification algorithms with common un-correlated feature subset selected by the proposed model for the UDP-Lag attack. On customized exploitation DDoS attacks, Ada boost and Multilayer perceptron produce the best ROC-AUC scores, while Decision tree and Random forest produce the lowest ROC-AUC scores. Figure 6 shows the Receiver Operating Curve (ROC) of the classification algorithms with common un-correlated feature subset selected by the proposed model for the Customized Exploitation DDoS attack. Even if Ada boost does not produce the best ROC-AUC score on the Syn-flood attack data set, it does so on the UDP flood and UDP-Lag attack datasets, as well as the customized exploitation DDoS attack dataset. Multilayer perceptron produces the best scores on Syn flood and UDP flood DDoS attack datasets, good scores on UDP-Lag DDoS attack datasets, and better scores on customized exploitation DDoS attack datasets in terms of ROC AUC.
Figure 3. Receiver Operating Curve (ROC) of the classification algorithms with common un-correlated feature subset selected by the proposed model for Syn flood attack
Figure 4. Receiver Operating Curve (ROC) of the classification algorithms with common uncorrelated features subset selected by the proposed model on UDP flood attack
Figure 5. Receiver Operating Curve (ROC) of the classification algorithms with common un-correlated features subset selected by the proposed model on UDP-Lag attack
Figure 6. Receiver Operating Curve (ROC) of the classification algorithms with common un-correlated feature subset selected by the proposed model for the Customized Exploitation DDoS attack
Log loss
The most important probability-based classification metric is log loss. The lower the log-loss number, the better the predictions; the log loss value is 0 for a perfect model.
$\log -\operatorname{loss}=-\frac{1}{N} \sum_{i=1}^{N}\left[y_{i} \ln p_{i}+\left(1-y_{i}\right) \ln \left(1-p_{i}\right)\right]$ (11)
where, N is the number of observations, p is the prediction probability and y is the actual value.
Table 11 shows Log-loss values of the different classification algorithms with common un-correlated features subset on Syn flood, UDP flood, UDP-Lag, and Customized Exploitation DDoS attacks. On the Syn flood DDoS attack dataset, the multilayer perceptron classifier produces the best log value, whereas logistic regression produces the poorest log loss value. On a UDP flood DDoS attack dataset, the KNN classifier produces the best log value, whereas the Naive Bayes classifier produces the poorest log value. On the UDP-lag DDoS attack dataset, the multilayer perceptron classifier produces the best log value, whereas the Naive Bayes classifier produces the poorest log loss value. On a customized exploitation DDoS attack dataset, the KNN classifier produces the best log value, whereas the Decision tree classifier produces the poorest log value. On all exploitation-based DDoS attack datasets, boosting type classifiers perform well in terms of log-loss evaluation metrics.
Run time
Run time means the execution time of the model. Table 12 shows Execution times (in seconds) of the different classification algorithms with common un-correlated feature subset on Syn flood, UDP flood, UDP-Lag, and Customized Exploitation DDoS attacks. In terms of execution time, the Naive Bayes classifier takes less time while the Gradient boosting classifier takes more time on the Syn flood DDoS attack dataset. On the UDP flood DDoS attack dataset, the Naive Bayes classifier takes less time to run, whereas the Gradient boosting classifier takes longer. The Naive Bayes classifier takes less time to execute on the UDP-Lag DDoS attack data set, whereas the multilayer perceptron takes longer. The Naive Bayes classifier takes less time to execute on the customized exploitation DDoS attack data set, whereas the random forest classifier takes longer. Ada boost classifier takes less time for execution than Gradient boost classifier, random forest bagging classifier, and multilayer perceptron neural network classifier.
Results of classification algorithms on customized data set with common feature subset
Table 4 shows the common un-correlated feature list for the Syn flood, UDP flood, UDP-Lag, and customized exploitation data sets. Unnamed: 0, Flow Duration, Flow IAT Min, Total Length of Bwd Packets, and Protocol are common in the lists of common un-correlated features of Syn flood, UDP flood, UDP-Lag, and customized exploitation DDoS attack data sets. Now classification algorithms applied to a customized DDoS attack dataset with these common feature subsets and results are evaluated.
Table 11. Log-loss values of the different classification algorithms with common un-correlated feature subset selected by the proposed model
|
Classification Algorithms |
Syn flood attack |
UDP flood attack |
UDP-Lag attack |
Customized Exploitation DDoS attack |
|
Logistic Regression |
1.0144 |
0.0273 |
1.8063 |
0.8448 |
|
Decision Tree |
0.0375 |
0.0427 |
0.9096 |
1.4486 |
|
KNN |
0.3775 |
0.0085 |
0.0693 |
0.0359 |
|
Naive Bayes |
0.0228 |
33.2010 |
33.9747 |
0.2251 |
|
Random Forest |
0.0342 |
0.0221 |
0.0662 |
0.0523 |
|
Ada Boost |
0.0088 |
0.0109 |
0.0988 |
0.1466 |
|
Gradient Boost |
0.0372 |
0.0326 |
0.0864 |
0.0590 |
|
Multilayer Perceptron |
0.0065 |
0.0138 |
0.0642 |
0.0400 |
Table 12. Execution times (in seconds) of the different classification algorithms with common un-correlated feature subset selected by the proposed model
|
Classification Algorithms |
Syn flood attack |
UDP flood attack |
UDP-Lag attack |
Customized Exploitation DDoS attack |
|
Logistic Regression |
19.9021 |
15.6982 |
3.3212 |
13.9782 |
|
Decision Tree |
4.9124 |
1.6632 |
0.9543 |
3.7729 |
|
KNN |
2.3210 |
2.7505 |
0.6286 |
2.3074 |
|
Naive Bayes |
0.2645 |
0.2528 |
0.0674 |
0.2312 |
|
Random Forest |
113.9609 |
59.7390 |
22.2232 |
148.4150 |
|
Ada Boost |
34.0015 |
40.5446 |
9.8165 |
48.5320 |
|
Gradient Boost |
121.1507 |
143.1666 |
31.9532 |
125.2996 |
|
Multilayer Perceptron |
82.8440 |
78.7160 |
65.5630 |
138.0118 |
Table 13. Accuracy, Precision, Recall, F-score and Specificity score values of the classification algorithms with common feature subset selected for Customized Exploitation DDoS attack
|
Classification algorithms |
Precision |
Recall |
F-Score |
Specificity |
Accuracy (%) |
||||
|
Attack |
Benign |
Attack |
Benign |
Attack |
Benign |
Attack |
Benign |
||
|
Logistic Regression |
1.00 |
0.09 |
0.96 |
0.84 |
0.98 |
0.16 |
0.84 |
0.96 |
95.96 |
|
Decision Tree |
1.00 |
0.95 |
1.00 |
0.64 |
1.00 |
0.76 |
0.64 |
1.00 |
99.82 |
|
KNN |
1.00 |
0.85 |
1.00 |
0.72 |
1.00 |
0.78 |
0.72 |
1.00 |
99.82 |
|
Naive Bayes |
1.00 |
0.68 |
1.00 |
0.26 |
1.00 |
0.38 |
0.26 |
1.00 |
99.61 |
|
Random Forest |
1.00 |
0.96 |
1.00 |
0.66 |
1.00 |
0.78 |
0.66 |
1.00 |
99.83 |
|
Ada Boost |
1.00 |
0.82 |
1.00 |
0.13 |
1.00 |
0.23 |
0.13 |
1.00 |
99.60 |
|
Gradient Boost |
1.00 |
0.99 |
1.00 |
0.50 |
1.00 |
0.67 |
0.50 |
1.00 |
99.77 |
|
Multilayer Perceptron |
1.00 |
0.95 |
1.00 |
0.60 |
1.00 |
0.73 |
0.60 |
1.00 |
99.81 |
Table 14. K-fold cross-validation accuracy scores (with a standard deviation) in %, ROC-AUC Scores, Log- loss value and execution times of the different classification algorithms on Customized Exploitation DDoS attack with common feature subset
|
Classification Algorithms |
K-fold cross-validation accuracy |
AUC Score |
Log-loss value |
Execution-time |
|
Logistic Regression |
88.4218(0.1191) |
0.9640 |
1.3963 |
7.3079 |
|
Decision Tree |
99.8955(0.0025) |
0.8202 |
0.0612 |
4.5834 |
|
KNN |
99.8627(0.0039) |
0.9205 |
0.0633 |
1.3982 |
|
Naive Bayes |
99.5840(0.0143) |
0.7968 |
0.1338 |
0.1801 |
|
Random Forest |
99.8859(0.0144) |
0.9372 |
0.0571 |
105.7972 |
|
Ada Boost |
99.8089(0.0088) |
0.9762 |
0.1389 |
37.1230 |
|
Gradient Boost |
99.8200(0.0087) |
0.8213 |
0.0778 |
117.3310 |
|
Multilayer Perceptron |
99.8360(0.0040) |
0.9768 |
0.0673 |
133.2027 |
Figure 7. Receiver Operating Curve (ROC) of the classification algorithms with common feature subset on Customized Exploitation DDoS attack
Table 13 shows performance evaluation metrics in terms of accuracy, precision, recall, F-score, and specificity for the different classification algorithms on Customized Exploitation DDoS attacks with common features which are common in four common un-correlated feature subsets. Decision tree, KNN, and Multilayer perceptron provide better accuracy scores. In terms of precision, recall, and F-score, all classification methods produce good results for attack classification. The Gradient boost classifier has a higher accuracy score, while the Logistic regression classifier has a higher benign score, and the KNN and Random forest classifiers have a higher F-score for benign classification. Except for Logistic regression, all classification methods have a higher specificity score benign classification, while Logistic regression has a higher specificity score for attack classification.
Table 14 shows K-fold cross-validation accuracy scores (with a standard deviation) in %, ROC-AUC Scores, Log-loss, value and execution times of the different classification algorithms on Customized Exploitation DDoS attack with common feature subset. Multilayer perceptron gives the best ROC-AUC value while Naive Bayes provides the lowest ROC-AUC score values in customized exploitation DDoS attack dataset. Figure 7 shows the ROC curves of the classification algorithms with common feature subset on the Customized Exploitation DDoS attack. On a customized exploitation DDoS attack dataset with common features set, KNN provides the best log loss value, whereas logistic regression provides the lowest log loss values. On a customized exploitation DDoS attack dataset with common features set, Naive Bayes takes less time for execution, whereas multilayer perceptron takes more time for execution. On a customized exploitation DDoS attack dataset with common features set, the Decision tree provides the best K-fold cross-validation accuracy value, whereas logistic regression provides the lowest K-fold cross-validation accuracy score values.
This research evaluates the effectiveness of the classification algorithms for detecting exploitation DDoS attacks on three CIC-DDoS2019 datasets and customized exploitation DDoS attack dataset with common un-correlated feature subset selected by Pearson, Spearman and Kendall correlation methods. The classification methods of multilayer perceptron and Ada boost produce the best accuracy results compared to others on Syn flood DDoS attack dataset. Decision tree, KNN, and Multilayer perceptron provide better accuracy scores on UDP-flood attack dataset. Random Forest and multilayer perceptron produce the best accuracy results compared to other classifiers on UDP-lag attacks. Decision tree, KNN, and Multilayer perceptron provide better accuracy scores on customized exploitation DDoS attacks. Multilayer perceptron produces the best accuracy results compared to other classifiers on customized exploitation DDoS attacks dataset with common features which are common features of in un-correlated feature subsets. Overall, multilayer perceptron produces the best accuracy in all exploitation DDoS attacks datasets. It also provides good results in remaining evaluation metrics.
[1] Dasari, K.B., Nagaraju, D. (2018). Distributed denial of service attacks, tools and defense mechanisms. International Journal of Pure and Applied Mathematics, 120(6): 3423-3437.
[2] Ramkumar, B.N., Subbulakshmi, T. (2021). Tcp Syn flood attack detection and prevention system using adaptive thresholding method. ITM Web of Conferences, 37: 01016. https://doi.org/10.1051/itmconf/20213701016
[3] Amaizu, G.C., Nwakanma, C.I., Bhardwaj, S., Lee, J.M., Kim, D.S. (2021). Composite and efficient DDoS attack detection framework for B5G networks. Computer Networks, 188: 107871. https://doi.org/10.1016/j.comnet.2021.107871
[4] Moubayed, A., Aqeeli, E., Shami, A. (2020). Ensemble-based feature selection and classification model for DNS typo-squatting detection. IEEE Canadian Conference on Electrical and Computer Engineering (CCECE), pp. 1-6. https://doi.org/10.1109/CCECE47787.2020.9255697
[5] Li, Z.L., Hu, G.M., Yang, D. (2008). Global abnormal correlation analysis for DDoS attack detection. 2008 IEEE Symposium on Computers and Communications, pp. 310-315. http://dx.doi.org/10.1109/ISCC.2008.4625614
[6] Mekala, S., Rani, B.P. (2020). Kernel PCA based dimensionality reduction techniques for preprocessing of Telugu text documents for cluster analysis. International Journal of Advanced Research in Engineering and Technology, 8(12): 785-793.
[7] Dasari, K.B., Devarakonda, N. (2021). Detection of different DDoS attacks using machine learning classification algorithms. Ingénierie des Systèmes d’Information, 26(5): 461-468. http://dx.doi.org/10.18280/isi.260505
[8] Yan, Y.D., Tang, D., Zhan, S.J., Dai, R., Chen, J.W., Zhu, N.B. (2019). Low-rate DoS attack detection based on improved logistic regression. IEEE 21st International Conference on High-Performance Computing and Communications, pp. 468-476. http://dx.doi.org/10.1109/HPCC/SmartCity/DSS.2019.00076
[9] Lakshminarasimman, S., Ruswin, S., Sundarakandam, K. (2017). Detecting DDoS attacks using decision tree algorithm. Fourth International Conference on Signal Processing, Communication and Networking (ICSCN), pp. 1-6. http://dx.doi.org/10.1109/ICSCN.2017.8085703
[10] Dong, S., Sarem, M. (2019). DDoS attack detection method based on improved KNN with the degree of DDoS attack in software-defined networks. IEEE Access, 8: 5039-5048. http://dx.doi.org/10.1109/ACCESS.2019.2963077
[11] Singh, N.A., Singh, K.J., De, T. (2016). Distributed denial of service attack detection using Naive Bayes classifier through info gain feature selection. ICIA-16: Proceedings of the International Conference on Informatics and Analytics, pp. 1-9. https://doi.org/10.1145/2980258.2980379
[12] Chen, Y., Hou, J., Li, Q.M., Long, H.Q. (2020). DDoS attack detection based on random forest. 2020 IEEE International Conference on Progress in Informatics and Computing (PIC), pp. 328-334. https://doi.org/10.1109/PIC50277.2020.9350788
[13] Rachmadi, S., Mandala, S., Oktaria, D. (2021). Detection of DoS attack using AdaBoost algorithm on IoT system. 2021 International Conference on Data Science and Its Applications (ICoDSA), pp. 28-33. http://dx.doi.org/10.1109/ICoDSA53588.2021.9617545
[14] Chen, Z., Jiang, F., Cheng, Y., Gu, X., Liu, W., Peng, J. (2018). XGBoost classifier for DDoS attack detection and analysis in SDN-based cloud. In 2018 IEEE International Conference on Big Data and Smart Computing (BigComp), pp. 251-256. http://dx.doi.org/10.1109/BigComp.2018.00044
[15] Wang, M., Lu, Y., Qin, J. (2020). A dynamic MLP-based DDoS attack detection method using feature selection and feedback. Computers & Security, 88: 101645. http://dx.doi.org/10.1016/j.cose.2019.101645