Rana Quadri* | Anupama Deshpande
© 2022 IIETA. This article is published by IIETA and is licensed under the CC BY 4.0 license (http://creativecommons.org/licenses/by/4.0/).
OPEN ACCESS
Due to the emergence of coronavirus disease 2019 (COVID-19) around the globe, the detection and treatment of COVID-19 patients is an extremely essential process in healthcare systems. Among many imaging technologies, Computed Tomography (CT) analyses with deep learning frameworks offer better efficiency than the other imaging modalities. To segment the infected COVID-19 Region-Of-Interests (ROIs), an Enriched 2.5D U-Net (E2.5D U-Net)-based deep learner has been used. In contrast, it requires categorization of infection severity to identify the patients in the prior stage. Hence, in this article, feature extraction with a classification framework is proposed to learn deep features related to the infection disease severity. In this framework, each segment from the E2.5D U-Net is fed to a deep learner such as DenseNet201 to extract the deep features. These features are learned independently by different machine learning classifiers to categorize the infection severity levels. It aids physicians in diagnosing COVID-19 patients in advance. But it needs other infection-related features to enhance the efficiency. Therefore, a multi-modeling classification framework is proposed. This framework extracts the handcrafted features from CT scans and concatenates them with the deep features to get the unified feature vector. Moreover, these feature vectors are trained by using the multi-modeling classifier for predicting the infection severity levels with higher accuracy. At last, the testing outcomes exhibit that the multi-modal classifier establishes a higher efficiency than the standard classifier frameworks.
COVID-19, lung CT images, segmentation, E2.5D U-Net, deep learning, handcrafted features, multi-modeling classification
A new coronavirus known as COVID-19 has been recognized as of December 2019 in Wuhan, China. It was quickly identified as an infectious disorder with several confirmed cases around the nation. It belongs to the Severe Acute Respiratory Syndrome Corona Virus 2 (SARS-CoV-2) family, produced by particular proteins on the surface of these pathogens. The COVID-19 infection is caused by the coronavirus SARS-CoV-2, which is the 7th coronavirus harmful to humans. The COVID-19 epidemic is placed the country in a state of inhibition, intending to limit contamination and minimize deaths [1]. Until now, 80% of diseases have been minor, 15% have been chronic and require respiratory support, and 5% have been serious and require ventilatory help. Temperature, lethargy, persistent cough, and digestive problems are the most common SARS-CoV-2 symptoms. Severe infections, such as pneumonia and acute respiratory distress syndrome, affect one out of every six patients. People who are believed to cause COVID-19 disease ask to be quickly identified as infected or not, to be perfectly secluded, to have the right diagnosis, and to notify the people they have interacted with [2]. Reverse-Transcriptase Polymerase Chain Reaction (RT-PCR) assays [3] are commonly required in conjunction imaging to validate a treatment that is time and cost-intensive. Furthermore, the RT-PCR results in a higher prevalence of false negatives; thus, an automated effective tool is required to achieve earlier treatment and aid in the reduction of the infection's incidence.
A wide range of pulmonary abnormalities, analogous to SARS, have been identified on X-ray and CT scans to identify individuals with COVID-19 [4]. This imaging technique aids clinicians in detecting COVID-19's effects on various tissues at various phases of infection. As respiratory indications are one of the key symptoms of COVID-19, this is applied to the heart and lungs. This procedure needs a specified period of time to properly categorize pneumonia, COVID-19, and healthy people. So, different deep learning frameworks, particularly Deep Convolutional Neural Networks (DCNN), have been suggested to automatically analyze the COVID-19 epidemic.
By using the medicinal datasets comprising CT scans, such frameworks have revealed outcomes in the identification of COVID-19 [5, 6]. Also, CT images are more reliable compared to X-ray scans, so the primary treatment of COVID-19 is becoming simpler. But, many COVID-19 datasets are not available for researchers or hard to find. The severe signs of COVID-19 will lead to a misclassification of CT scans. This problem is resolved by analyzing the training images which threaten nearly similar pixels as COVID-19. For this reason, it is vital to separate COVID-19 and non-COVID-19 patients.
The recognition and treatment of COVID-19 with the help of common image analytics and machine learning frameworks is a tedious and time-consuming procedure owing to the practical challenges in image acquisition and performance of analytics tools. To combat this difficulty, 2D frameworks were designed recently, as well as the performance of 3D frameworks on a partition of the CT images was improved. Besides, a stack of 2D partition frameworks known as 2.5D frameworks was fused to enhance the 3D partition. Typical 3D partition frameworks like 3D U-Net request a massive quantity of images for training, and the learning speed was very slow for healthcare systems, especially during the COVID-19 epidemic. From this viewpoint, a quick, precise and machine-agnostic partition and quantification framework [7] was designed. First, a pre-processing step was employed to cast the pulmonary CT scan into a machine-agnostic typical embedding space. Then, a highly accurate partition framework like 2.5D U-Net was employed on the typical embedding space. As well, an enhanced analysis method was used for training that views the dynamic alteration of diseased ROIs for COVID-19. On the other hand, the time and storage use for learning was high. So, an E2.5D U-Net-based deep transfer learning framework [8] was developed which integrates weight transfer block after the convolutional block in the standard U-Net. This weight transfer block was used to adjust weight values to the feature maps and attain better partition precision. In this framework, different pre-trained deep learning structures (ResNet18, DenseNet121, InceptionV3, Xception and MobileNetV2) were built by dynamically fine-tuning their weights related to the input samples and obtain the optimal weights for E2.5D U-Net. Based on this E2.5D U-Net framework, the COVID-19 infected ROIs were partitioned from the CT images to recognize and diagnose the patients. But it needs to classify the severity of infection to diagnose patients at an earlier stage.
Therefore, this paper introduces a feature extraction with a classification unit for training deep features associated with disease severity. First, the E2.5D U-Net-based partition is applied to segment the COVID-19 infected ROIs from the lung CT images. After that, each segment is fed to DenseNet201 for extracting the deep features. These extracted features are used for training the linear Support Vector Machine (SVM), cubic SVM, K-Nearest Neighbor (KNN), Linear Discriminant Analysis (LDA) and AdaBoost decision tree for categorizing the infection severity levels into early, progressive, and severe. This helps us recognize patients with severe infections and diagnose them at a prior stage. However, it needs additional features related to the diseases to increase its accuracy. So, it applies a multi-modeling classification framework to extract the mixture of deep and handcrafted features from CT scans to distinguish COVID-19, pneumonia and healthy patients. In this framework, different handcrafted features are extracted for each CT segment and concatenated with the deep features to obtain the single feature vector. Then, the obtained feature vector is learned by the multi-modeling classifier called modified Inception to classify the severity level of particular COVID-19 infected patients. Thus, it can effectively increase the accuracy of recognizing and diagnosing the patients who have COVID-19 infections. The remaining sections of this article include: Section 2 studies the recent work related to the partition and categorization of COVID-19 patients from CT samples. Section 3 explains the methodology of proposed COVID-19 classification frameworks and Section 4 displays their efficiencies. Section 5 concludes the entire work and suggests the future scope.
Panwar et al. [9] designed a deep transfer learning framework that speeds up the identification of COVID-19 cases from X-ray and CT scans of the chest. It has been applied to mining the characteristics from the COVID-scans and learning them to differentiate pneumonia, other lung disorders and healthy cases. Also, a color visualization method was applied by the Grad-CAM method to provide the ROIs of diseased pulmonary lesions. However, it was not able to train a temporal dependence feature to avoid false positives.
Polsinelli et al. [10] designed a light CNN model depending on the structure of the SqueezeNet for effectively distinguishing COVID-19 CT scans from other pneumonia and healthy CT scans. In this model, the hyper-parameters were optimized by the Bayesian optimization scheme to achieve better learning. But it needs efficient feature extraction and segmentation methods for improving the classification efficiency.
Gao et al. [11] designed a Dual-branch Combination Network (DCN) for concurrently executing the individual-level categorization and lesion partition. A new lesion attention unit was employed to combine the intermediate partition outcomes and focus the categorization branch more intensively on the lesion regions. Also, a slice chance mapping scheme was used for training the conversion from slice-level to individual-level categorization. But, the efficiency of the attention masks depends on the partition branch accurateness and also the inconsistencies between various images may create biases.
Hasni et al. [12] suggested an efficient method depending on the 3D restoration of CT images for enhancing the control and forecasting of COVID-19 patients. Initially, the raw CT scans were collected and the extracted 2D DICOM scans were anonymized. After, image partition and contour identification were automatically done to restore the 3D scans of COVID-19 patients. But it does not categorize the severity of COVID-19 infections for effective diagnosis.
Hassantabar et al. [13] utilized 3 different deep learners for identifying and diagnosing COVID-19 cases using lung X-rays. First, feature extraction was performed depending on the Deep Neural Network (DNN) and fractal schemes. After that, standard CNN was applied to categorize the extracted features. Moreover, a CNN structure was applied for segmenting and discovering the diseased tissue in the images. But it has a limited number of images for analysis.
Amyar et al. [14] suggested an automated partition and categorization method to forecast COVID-19 pneumonia using lung CT scans. In this method, a novel multitask deep learner was presented for mutually detecting COVID-19 patients and partitioning COVID-19 lesions from lung CT scans. This structure was comprised of a typical encoder to represent disentangled features and 2 decoders, including a multi-layer perceptron to restore, segment and categorize, accordingly. However, it needs additional features and a huge number of images to enhance its efficiency.
Liu et al. [15] designed a 2D sparse matrix profile method for identifying COVID-19 from lung CT scans. At the 1D stage, CT scans were flattened and converted to the 1D vector. At the 2D stage, a matrix profile was computed in a sliding window for each segment in the image. Then, an infection severity score was determined and the variance of such severities between the CT images was evaluated. After, the infection-weighted scans were fed to the DenseNet for training and differentiating the CT images. But its efficiency depends on the number of DenseNet layers and CT scans.
Hu et al. [16] developed a weakly supervised deep learner to automatically identify and categorize COVID-19 disease from CT scans. First, the CT lung scans were collected and a multi-view U-Net-based partition network was applied to segment the scans. For each segment, CNN was used to identify and categorize the infected CT scans and healthy scans. Then, multi-scale training was adopted to locate the lesions by computing the class score maps. But its performance was not highly effective.
Wang et al. [17] developed a new joint training model for executing perfect COVID-19 detection through efficient training with heterogeneous datasets with distribution variation. To improve training accuracy, an effective backbone was built by redeveloping the COVID-Net. Also, a contrastive learning objective was used for improving the domain-invariance of semantic embeddings and the categorization efficiency. But it needs to develop transfer.
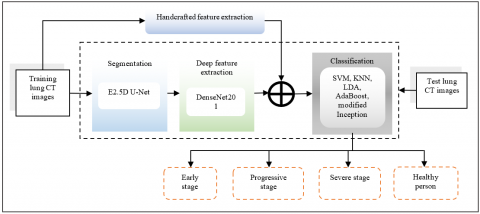
In this section, the proposed feature extraction and categorization of COVID-19 infection severity are described briefly. Figure 1 illustrates the schematic representation of proposed feature extraction and multi-modeling classification of COVID-19 severity levels from CT scans. First, the consecutive CT slices are processed to generate 3D volume pixels which characterize the image structure in 3D. This representation makes CT scan in 3 different planes, i.e. xy, yz and xz planes. Then, an E2.5D U-Net model (as illustrated in Figure 2) is performed to segment the ROIs from the lung CT scans [8]. Then, the DenseNet201 deep model is applied to extract the deep features from each segment. Also, the handcrafted features are extracted and concatenated with the extracted deep features to get a single feature vector. This feature vector is fed to the linear SVM, cubic SVM, KNN, LDA, AdaBoost and modified inception classifiers independently for categorizing the severity levels of COVID-19 patients effectively.
Figure 1. Schematic representation of feature extraction and multi-modeling classification framework
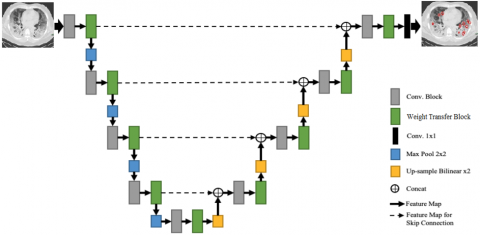
Figure 2. Structure of E2.5D U-Net model for CT scan segmentation
3.1 Deep feature extraction with different machine learning-based classification
In this phase, the pre-trained deep model called DenseNet201 is applied for feature extraction from the chest CT images. Table 1 shows the feature extraction methods that are carried out by passing the segmented CT image through the DenseNet201 structure's consecutive levels. The DenseNet-201 is a 201-layer CNN. ImageNet database is used to load a pre-learned variation of the structure which has been learned on over a million photos. This model is initially learned on ImageNet before being learned on lung CT pictures. It consists of the convolution layer (112×112) at the beginning and 4 dense blocks followed by the FC-1000 and SoftMax layers. The outcome of the single convolutional layer is defined by:
$h_{i, j}=f\left(\sum_{k}^{P} \sum_{l}^{Q} w_{k, l} x_{i+k, j+l}+b_{k, l}\right)$ (1)
In Eq. (1), h is the neuron output, x is the input, w is the weight, and b denotes the bias. Also, P, Q denote the range of weight variables, k, l denote variable indices and i, j denote input indices. Every convolutional unit performs ReLU, regularization, max-pooling functions and the ReLU is applied as an activation factor in the DenseNet201. During the training phase, this pre-trained DenseNet201 is considered to mine the related deep characteristics from COVID-19 CT scans.
The segmented entry scan of size 224×224×3 is passed to the initial convolutional unit that gives the scan of dimension 112×112×64 via convolving the entry scan using 64 kernels. The last FC unit contains a size of 1000. In this framework, FC-1000 unit characteristics are mined and passed to the linear SVM [18], cubic SVM, KNN [19], LDA and AdaBoost [20]. These classifiers are trained independently to categorize the severity levels of COVID-19 cases into three major stages: early, progressive and severe. But it needs additional features and multi-modeling classification for enhancing the precision of classifying the infection severity levels.
Table 1. DenseNet201 Structure
|
Layer |
Outcome dimension |
DenseNet-201 |
|
Convolution |
112×112×64 |
$7 \times 7 \operatorname{conv}$, stride 2, padding 3 |
|
Pooling |
55×55×64 |
$3 \times 3$ maxpool, stride 2 , padding 1 |
|
Dense unit – 1 |
55×55×32 |
$\left[\begin{array}{l}1 \times 1 \text { conv, stride } 1 \text {, padding } \\ 3 \times 3 \text { conv, stride } 1 \text {, padding } 1\end{array}\right] \times 6$ |
|
Transition layer – 1 |
55×55×128 26×26×128 |
$1 \times 1 \operatorname{conv}$, stride 1 , padding 0 $2 \times 2$ maxpool, stride 2 , padding 0 |
|
Dense unit – 2 |
26×26×32 |
$\left[\begin{array}{l}1 \times 1 \text { conv, stride } 1, \text { padding } 0 \\ 3 \times 3 \text { conv, stride } 1, \text { padding } 1\end{array}\right] \times 12$ |
|
Transition layer – 2 |
26×26×256 13×13×256 |
$1 \times 1 \operatorname{con} v$, stride 1 , padding 0 $2 \times 2$ maxpool, stride 2 , padding 0 |
|
Dense unit – 3 |
11×11×32 |
$\left[\begin{array}{l}1 \times 1 \text { conv, stride } 1, \text { padding } 0 \\ 3 \times 3 \text { conv, stride } 1, \text { padding } 1\end{array}\right] \times 48$ |
|
Transition layer – 3 |
11×11×896 5×5×896 |
$1 \times 1 \operatorname{con} v$, stride 1 , padding 0 $2 \times 2$ maxpool, stride 2 , padding 0 |
|
Dense unit – 4 |
5×5×32 |
$\left[\begin{array}{l}1 \times 1 \text { conv, stride } 1, \text { padding } 0 \\ 3 \times 3 \text { conv, stride } 1 \text {, padding } 1\end{array}\right] \times 32$ |
|
Classification |
|
$7 \times 7$ global mean pool $1000 \mathrm{D}$ FC (FC-1000), softmax |
3.2 Multi-modeling classification for COVID-19 infection severity prediction
In this framework, handcrafted features are also extracted from the CT images such as Local Binary Patterns (LBPs), Gray-Level Co-occurrence Matrix (GLCM), Local Ternary Patterns (LTPs), and Local Derivative Patterns (LDPs). These are the texture features in the lung CT images. The features extracted by the GLCM include contrast, correlation, divergence, power, entropy, homogeneity, average, variation and standard variance. The LTP analyzes the local gray-scale variance and the LDP determines the texture of an image in different directions of a pixel.
Once all the handcrafted features are extracted, these are concatenated with the deep features directly to get the final unified feature vector. The unified feature vector is defined as:
$fused feature vector_{1 \times q}=\sum_{i=1}^{5}\left\{\begin{array}{c}\text { f DenseNet } 201_{1 \times m}, f L B P_{1 \times p}, f G L C M_{1 \times g}, \\ f L T P_{1 \times l}, f L D P_{1 \times d}\end{array}\right\}$ (2)
In Eq. (2), f defines the fused vector and
f DenseNet $201_{1 \times m}=\left\{\begin{array}{c}\text { DenseNet } 201_{1 \times 1}, \text { DenseNet } 201_{1 \times 2}, \\ \ldots, \text { DenseNet } 201_{1 \times n}\end{array}\right\}$ (3)
$f L B P_{1 \times p}=\left\{L B P_{1 \times 1}, L B P_{1 \times 2}, \ldots, L B P_{1 \times n}\right\}$ (4)
$f G L C M_{1 \times g}=\left\{G L C M_{1 \times 1}, G L C M_{1 \times 2}, \ldots, G L C M_{1 \times n}\right\}$ (5)
$f L T P_{1 \times l}=\left\{L T P_{1 \times 1}, L T P_{1 \times 2}, \ldots, L T P_{1 \times n}\right\}$ (6)
$f L D P_{1 \times l}=\left\{L D P_{1 \times 1}, L D P_{1 \times 2}, \ldots, L D P_{1 \times n}\right\}$ (7)
Moreover, a modified Inception classifier is used for categorizing the infection severity levels using the fused severity feature vector. The modified Inception structure is presented in Table 2. The variation between Inception and modified Inception in the classifier lies in the final fully connected layer. The obtained severity feature vector is given as input to this network and learned with the help of one-hot encoding of output classes. The one-hot encoding is used to label chest CT scans to indicate the positive COVID-19 case or not (i.e., normal). Here, each encoded label comprises 2-elements array with one of the elements being “hot” (i.e., 1) and “not” (i.e., 0). Finally, the SoftMax is executed to categorize the severity levels into early, progressive, severe and healthy stages. Based on the infection severity levels, the physicians can successfully diagnose COVID-19 patients in prior stages of infection.
Table 2. Structure of modified inception classifier
|
Inception unit |
Units |
Patch dimension/Stride |
|
Convolutional layer (conv) |
3×3/2 |
|
|
conv |
3×3/1 |
|
|
conv padded |
3×3/1 |
|
|
Pooling layer (pool) |
3×3/2 |
|
|
conv |
3×3/1 |
|
|
conv |
3×3/2 |
|
|
conv |
3×3/1 |
|
|
Inception |
3x, 5x, 2x |
|
|
pool |
8×8 |
|
|
Linear |
Logits |
|
|
Modified unit |
Fully Connected Layer 1 |
$\left[\begin{array}{c}\text { bacthnorm } \\ \text { dropout }(0.5) \\ 512 \text { d linear }\end{array}\right]$ |
|
Fully Connected layer 2 |
$\left[\begin{array}{c}\text { bacthnorm } \\ \text { dropout }(0.5) \\ 2 d \text { linear }\end{array}\right]$ |
|
|
Softmax |
Classifier |
For classifying the severity level of COVID-19, the SoftMax loss function is defined as:
$L(x)=-\frac{1}{N} \sum_{i=1}^{N} Y_{i y_{i}} \log p_{i y_{i}}$ (8)
In Eq. (8), $N$ is the number of classes, $Y_{i y_{i}}$ is the one-hot encoding of severity level class and $p_{i y_{i}}$ is the $y_{i}$-th element of predicted probability vector for $x_{i}$.
Algorithm:
Input: Training lung CT images
Output: Classified infection severity levels: early, progressive or severe
Begin
Get the training lung CT images and pre-process them using resizing and regularization;
Augment the number of training images;
Fine-tune the deep learner structures and execute the E2.5D U-Net;
Obtain the segmented ROIs of COVID-19 infection;
Extract the deep from each segment using DenseNet201;
Extract the handcrafted features from each CT sample;
Fuse deep and handcrafted features to get a unified feature vector;
Train the SVM, KNN, LDA, AdaBoost and modified Inception classifiers independently using the fused feature vector;
Categorize the COVID-19 severity levels and diagnose the patients at an earlier stage;
End
Hence, this framework can simultaneously categorize multiple COVID-19 CT scans based on their severity levels for early diagnosis for early diagnosis.
This part analyzes the efficiency of these presented feature extraction and classification models by implementing them in MATLAB 2017b using the Radiopaedia-COVID-19 CT Cases-2020 dataset, accessible at www.radiopaedia.org. In this experiment, 349 COVID-19 CT scans and 397 non-COVID-19 CT scans are considered for augmentation, segmentation and severity level classification processes. Also, a comparative study between modified inception classifier and standard classifiers [18-20] (such as LDA, AdaBoost, linear SVM, KNN, Cubic SVM) is conducted regarding different evaluation metrics.
4.1 Accuracy
Accuracy defines the percentage of COVID-19 patients correctly categorized over the total number of images tested.
Accuracy = $\frac{ True Positive (TP)+True Negative (TN)}{TP+TN+False Positive (F P)+False Negative (F N)}$ (9)
TP is a result where the classifier properly categorizes the COVID-19 patients like themselves. FP is a result where the classifier improperly categorizes the COVID-19 patients as healthy people. FN is a result where the TP is a result where the classifier properly categorizes the COVID-19 patients like themselves. FP is a result where the classifier improperly categorizes the COVID-19 patients as healthy people. FN is a result where the classifier improperly categorizes healthy people as COVID-19 patients. Similarly, TN is a result where the classifier properly categorizes healthy people like themselves.
Figure 3. Comparison of accuracy
Figure 3 illustrates the accuracy of different frameworks for categorizing the COVID-19 infection severity levels. It indicates that the modified Inception classifier using the fused feature vector can precisely categorize the COVID-19 patients and their severity levels compared to all other classifiers such that the accuracy of the modified Inception classifier with fused feature vector is 98.3% which is greater than all other classifications and feature extractions model.
4.2 Precision
It is the quantity of categorized COVID-19 patients at TP and FP rates.
Precision $=\frac{T P}{T P+F P}$ (10)
Figure 4. Comparison of precision
Figure 4 shows the precision of different frameworks for categorizing the COVID-19 infection severity levels. It is observed that the modified Inception classifier using the fused feature vector increases the precision of predicting the COVID-19 patients and their severity levels compared to all other classifiers, such that the precision of the modified Inception classifier with the fused feature vector is 0.972, which is higher than all other classifications and feature extraction models.
4.3 Recall
It is the quantity of perfectly categorized COVID-19 patients at TP and FN rates.
Recall $=\frac{T P}{T P+F N}$ (11)
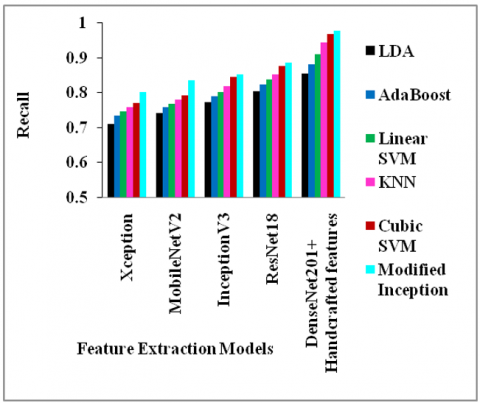
Figure 5. Comparison of recall
Figure 5 depicts the recall of different frameworks for categorizing the COVID-19 infection severity levels. It is analyzed that the modified Inception classifier using the fused feature vector can enhance the recall for classifying the COVID-19 patients and their severity levels compared to all other classifiers, such that the recall of the modified Inception classifier with the fused feature vector is 0.978, which is greater than all other classifications and feature extraction models.
4.4 F-measure
Precision and recall are summed up to form the harmonic mean, i.e., the f-measure.
$F-$ measure $=2 \times \frac{\text { Precision } \cdot \text { Recall }}{\text { Precision }+\text { Recall }}$ (12)
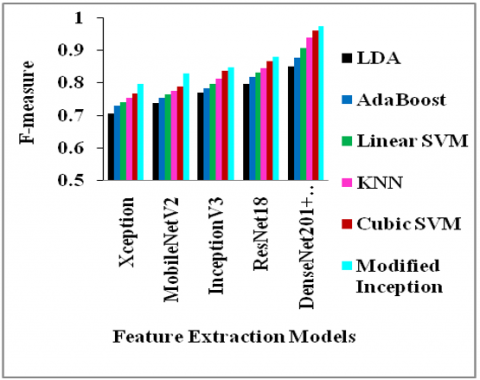
Figure 6. Comparison of F-measure
Figure 6 depicts the f-measure of different frameworks for categorizing the COVID-19 infection severity levels. It is noticed that the modified Inception classifier using the fused feature vector improves the f-measure to predict the COVID-19 patients and their severity levels compared to all other classifiers, such that the f-measure of the modified Inception classifier with the fused feature vector is 0.975, which is greater than all other classifications and feature extraction models.
4.5 Computation time
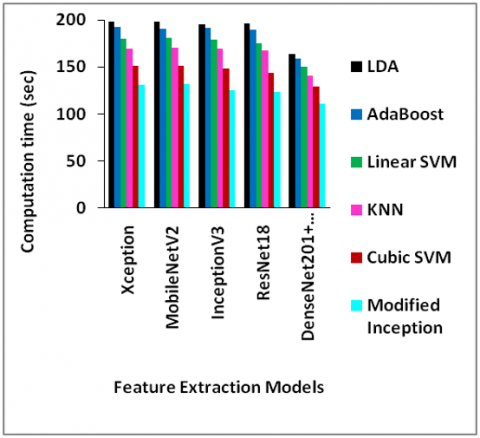
Figure 7. Comparison of computation time
Figure 7 depicts the computation time (in sec) of different frameworks for categorizing the COVID-19 infection severity levels. It is analyzed that the modified Inception classifier using the fused feature vector can reduce the computation time for classifying the COVID-19 patients and their severity levels compared to all other classifiers, such that the computation time of the modified Inception classifier with the fused feature vector is 110.7 sec, which is less than all other classifications and feature extraction models.
4.6 Mean Average Precision (mAP)
It is the average of average precision.
Figure 8. Comparison of mAP
Figure 8 depicts the mAP of different frameworks for categorizing the COVID-19 infection severity levels. It is indicated that the modified Inception classifier using the fused feature vector can increase the mAP for classifying the COVID-19 patients and their severity levels compared to all other classifiers, such that the mAP of the modified Inception classifier with the fused feature vector is 97.2%, which is higher than all other classifications and feature extraction models.
In this paper, the DenseNet201 was initially integrated with the E2.5D U-Net model to extract the deep features related to disease severity from the CT scan segments. Then, SVM, KNN, LDA and AdaBoost classifiers were independently trained to categorize the severity levels of COVID-19 patients. But it needs other features to increase the efficiency of simultaneous classification of different classes. So, different handcrafted features were extracted and fused with the deep features to obtain the final feature vector. This feature vector was learned by the modified Inception for classifying the COVID-19 severity levels effectively. To end, the findings proved that the modified Inception classifier with the fused features achieves 98.3% accuracy compared to the other feature extractor and classifier frameworks.
[1] Borghesi, A., Zigliani, A., Masciullo, R., Golemi, S., Maculotti, P., Farina, D., Maroldi, R. (2020). Radiographic severity index in COVID-19 pneumonia: Relationship to age and sex in 783 Italian patients. La Radiologia Medica, 125(5): 461-464. https://doi.org/10.1007/s11547-020-01202-1
[2] Salehi, S., Abedi, A., Balakrishnan, S., Gholamrezanezhad, A. (2020). Coronavirus disease 2019 (COVID-19) imaging reporting and data system (COVID-RADS) and common lexicon: A proposal based on the imaging data of 37 studies. European Radiology, 30(9): 4930-4942. https://doi.org/10.1007/s00330-020-06863-0
[3] Xie, X., Zhong, Z., Zhao, W., Zheng, C., Wang, F., Liu, J. (2020). Chest CT for typical coronavirus disease 2019 (COVID-19) pneumonia: Relationship to negative RT-PCR testing. Radiology, 296(2): 41-45. https://doi.org/10.1148/radiol.2020200343
[4] Benmalek, E., Elmhamdi, J., Jilbab, A. (2021). Comparing CT scan and chest X-ray imaging for COVID-19 diagnosis. Biomedical Engineering Advances, 1: 1-6. https://doi.org/10.1016/j.bea.2021.100003
[5] Yener, F.M., Oktay, A.B. (2020). Diagnosis of COVID-19 with a deep learning approach on chest CT slices. In IEEE Medical Technologies Congress, pp. 1-4. https://doi.org/10.1109/TIPTEKNO50054.2020.9299266
[6] Serte, S., Demirel, H. (2021). Deep learning for diagnosis of COVID-19 using 3D CT scans. Computers in Biology and Medicine, 132: 1-8. https://doi.org/10.1016/j.compbiomed.2021.104306
[7] Zhou, L., Li, Z., Zhou, J., Li, H., Chen, Y., Huang, Y., Gao, X. (2020). A rapid, accurate and machine-agnostic segmentation and quantification method for CT-based COVID-19 diagnosis. IEEE Transactions on Medical Imaging, 39(8): 2638-2652. https://doi.org/10.1109/TMI.2020.3001810
[8] Quadri, R., Deshpande, A. (2021). Enriched 2.5D U-net model for lung CT image segmentation during COVID-19 diagnosis. International Journal of Research and Analytical Reviews, 8(2): 249-255. Available at: http://www.ijrar.org/IJRAR21B2140.pdf.
[9] Panwar, H., Gupta, P.K., Siddiqui, M.K., Morales-Menendez, R., Bhardwaj, P., Singh, V. (2020). A deep learning and grad-CAM based color visualization approach for fast detection of COVID-19 cases using chest X-ray and CT-Scan images. Chaos, Solitons & Fractals, 140: 1-12. https://doi.org/10.1016/j.chaos.2020.110190
[10] Polsinelli, M., Cinque, L., Placidi, G. (2020). A light CNN for detecting COVID-19 from CT scans of the chest. Pattern Recognition Letters, 140: 95-100. https://doi.org/10.1016/j.patrec.2020.10.001
[11] Gao, K., Su, J., Jiang, Z., Zeng, L.L., Feng, Z., Shen, H., Hu, D. (2021). Dual-branch combination network (DCN): Towards accurate diagnosis and lesion segmentation of COVID-19 using CT images. Medical Image Analysis, 67: 1-37. https://doi.org/10.1016/j.media.2020.101836
[12] Hasni, M., Farahat, Z., Abdeljelil, A., Marzouki, K., Aoudad, M., Tlemsani, Z., Ngote, N. (2020). An efficient approach based on 3D reconstruction of CT scan to improve the management and monitoring of COVID-19 patients. Heliyon, 6(11): 1-17. https://doi.org/10.1016/j.heliyon.2020.e05453
[13] Hassantabar, S., Ahmadi, M., Sharifi, A. (2020). Diagnosis and detection of infected tissue of COVID-19 patients based on lung X-ray image using convolutional neural network approaches. Chaos, Solitons & Fractals, 140: 1-11. https://doi.org/10.1016/j.chaos.2020.110170
[14] Amyar, A., Modzelewski, R., Li, H., Ruan, S. (2020). Multi-task deep learning based CT imaging analysis for COVID-19 pneumonia: Classification and segmentation. Computers in Biology and Medicine, 126: 1-10. https://doi.org/10.1016/j.compbiomed.2020.104037
[15] Liu, Q., Leung, C.K., Hu, P. (2020). A two-dimensional sparse matrix profile DenseNet for COVID-19 diagnosis using chest CT images. IEEE Access, 8: 213718-213728. https://doi.org/10.1109/ACCESS.2020.3040245
[16] Hu, S., Gao, Y., Niu, Z., Jiang, Y., Li, L., Xiao, X., Yang, G. (2020). Weakly supervised deep learning for Covid-19 infection detection and classification from CT images. IEEE Access, 8: 118869-118883. https://doi.org/10.1109/ACCESS.2020.3005510
[17] Wang, Z., Liu, Q., Dou, Q. (2020). Contrastive cross-site learning with redesigned net for Covid-19 CT classification. IEEE Journal of Biomedical and Health Informatics, 24(10): 2806-2813. https://doi.org/10.1109/JBHI.2020.3023246
[18] Guhathakurata, S., Kundu, S., Chakraborty, A., Banerjee, J.S. (2021). A novel approach to predict COVID-19 using support vector machine. In Data Science for COVID-19, pp. 351-364. https://doi.org/10.1016/B978-0-12-824536-1.00014-9
[19] Brinati, D., Campagner, A., Ferrari, D., Locatelli, M., Banfi, G., Cabitza, F. (2020). Detection of COVID-19 infection from routine blood exams with machine learning: A feasibility study. Journal of Medical Systems, 44(8): 1-12. https://doi.org/10.1007/s10916-020-01597-4
[20] Yu, Z., Li, X., Sun, H., Wang, J., Zhao, T., Chen, H., Xie, Z. (2020). Rapid identification of COVID-19 severity in CT scans through classification of deep features. BioMedical Engineering OnLine, 19(1): 1-13. https://doi.org/10.1186/s12938-020-00807-x