Mohammed Zaheer Ahmed* | Chitraivel Mahesh
© 2021 IIETA. This article is published by IIETA and is licensed under the CC BY 4.0 license (http://creativecommons.org/licenses/by/4.0/).
OPEN ACCESS
Medical Data is commonly seen as heterogeneous, unbalanced, high-dimensional, noise-related and anomaly-related. It covers scientific knowledge and genetic data, as well as the principle of biomedical computation. Data observations across the world have been spread in the past several years. The effect of this development is felt everywhere from business, science, medical data and technologies. A significant number of deaths each year in India are caused by errors in the health care system, and many thousands experience ill-effects for similar reasons. Electronic Health Records (EHR) collection is one of the most significant advances as it facilitates the improvement of new technologies for error prevention, cost reduction and health advancement. The proposed research addresses the usage of EHR in the study of related data using Machine Learning (ML) techniques. The usage of machine intelligence techniques enhances efficiency and reduces the error rate which strengthens health treatment for patients. The EHR used in emergency clinics contains a variety of data, as shown by the doctor's arguments for accurate recognition. Information and data can be shared on the basis of these special needs. Such studies are used by doctors to examine the patient's history of clinical records and to track patient treatment. Each time a patient enters the emergency department, the doctor makes another case report and, during the diagnostic procedure, tries to explore the relationship between the patient and the family-related person in order to characterize the diagnosis and health status of the patient. The proposed work uses a Weight Based Labeled Classifier using a Machine Learning (WbLCML) model designed to improve diagnostic efficiency, accuracy and reliability. The proposed model is compared to traditional methods and the results suggest that the proposed model is better suited to the proper classification of medical data.
medical data classification, electronic health records, error prediction, machine learning technique, data classification
Machine learning techniques have been developed to speed up the method and identify instances that need imperative follow-up. Such methods, though, involve a significant volume of classified data to train accurate predictive models. Preparing such a broad data collection to be manually annotated by health experts is expensive and time-consuming [1]. This proposed work discusses the semi-supervised transfer learning system for the analysis of radiology files through several hospitals [2]. The key goal is to exploit both publicly accessible non-labeled clinical data and already acquired information to enhance the learning process where restricted identified data are usable.
Semi-Supervised Learning (SSL) and transfer learning are viable alternatives to traditional supervised machine learning methods to raising the expense of manual annotation. SSL strategies integrate knowledge from unmarked data into the learning cycle as a workaround for coping with the lack of labeled data [3]. Another approach to reduce the workload of the manual annotation and optimize the output of the classification is to move the information acquired from the accessible labeled data from one hospital (source) to a related role in another hospital (target). These methods have been widely extended to a variety of real-world implementations where manual tagging of data is an intensive and expensive activity [4]. Examples cover emotion analysis, pharmacogenomics and customized medicine, cancer case management, email classification, language translation, object recognition, clinical definition extraction and data stream classification [5].
The machine learning classification question is to classify F(x) as a feature that maps increase the attribute of vector Xi to its corresponding goal Yi symbol, i=1, 2, ..., n, where n represents the total number of samples in training [1]. For machine learning, traditional classification problems are associated with a single goal name for each example. This is a unique relationship with the target [6]. This classification type is referred to as a classification of a single label. On the opposite, a number of problems of real world labeling involve data samples for a subset of target labels [7]. This contributed to the development of a new classification in machine learning, the Multi-label Category. Due to the rapidly growing real world applications, the challenges facing multi-label labeling have gained considerable importance and attention in recent years. Health diagnosis [8], text categorization [9], genomics, bioinformations [10], visualization, sound, categorization of audio, stage and image [11], map labeling [12], and marketing are some of the real world applications. Such areas involve multi-label sorting [13]. Figure 1 illustrates the process of EHR data classification and scientific review.
The discrete differentiation is recognized where the amount of aim points available is two. Binary labeling is the key issue in classifying the input sample under one of the two goal class names. Binary scoring issues require patient safety, medical treatment, etc. The problem of classification is called a multi-class classification where the amount of goal marks reachable is greater than double [14]. Multi-class manifestations are biometric identification, character recognition and similar classification issues [15].
Throughout the area of medical technology, machine learning plays an extremely significant role [16]. The through usage of Electronic Health Records (EHRs) allowed vast data from patients and healthcare facilities to be obtained. Clinical researchers who discovered secret trends from detailed EHR data and can use machine learning technologies to build prevision models to help in clinical decision-making [17]. The assessment of Diagnostics relevant to EHR is one significant use of multi-label learning in the medical field. Multi-label learning is a controlled recognition method where several goal marking in one case may be implemented [18]. Of example, one patient can have a variety of similar symptoms concurrently with different disorders, e.g. "fever," "cough" or" viral infections. Multi-label cognitive problems are modeling dependencies on labels by understanding the relation between labels. In this situation the probability of respiratory infection would rise similarly because of the incidence of {fever, cough, viral infections}, when a patient develops pregnancy and cough. Orthodox strategies to schooling, including one-on-one and one-on-one, assume products are completely separate. Multi-label research study focuses on the use of mark connections to enhance efficiency at classification. The logical solution is to use embedding models to assign labels in a limited space while collecting dependencies, thus growing the "effective" quantity of labels [19]. In fact, embedding-based methods can lead to poor performance due to loss of knowledge during the incorporation process.
Classification is a large and relevant area in machine learning and has been revived through productive implementations, including data mining, financial modeling, automated enterprise and bioinformatics [20]. There have previously been several grouping algorithms introduced including the nearest neighbor, decision tree, rules-based learning and predictive learning. Such ways of grouping are rapidly and enormously. There are developments in the area of medical visualization, namely: image segmentation, imaging methods assisted by machine, and content-based image recovery annotations. So the significance of the medical image description is clear to all. In fact, the vast volume of digital picture images accessible to the general public allows for modern technologies and processing systems for effective recognition, analysis and authentication of patient imagery [21].
Clinical decision-making, utilizing medical expert programs, is a difficult task as it requires greater accuracy. For this purpose, the architecture of such medical expert systems requires a suitable and most effective machine learning algorithm [22]. This proposed work examines the different approaches available for supervised machine learning classification along with their practical use in the medical field. A variety of classification algorithms are regarded and tested for their relative performance and practical usefulness in the different types of health care datasets. A vast amount of unstructured text containing valuable information is accessible through the internet. This text is evolving and proliferating, making it difficult for people to interpret, understand and recall. Data mining and knowledge retrieval algorithms are used to develop new programming technologies for the analysis of unstructured text. This publicly available text includes a large number of online medical articles which provide valuable information on diseases, symptoms, surgery, medications, medicines, etc. Automatic unstructured text classification offers practical information management that does not rely on the arbitrary classification criteria. It also provides useful information by collecting and correlating the relevant data. It also classifies, defines and addresses all sources of knowledge and reduces the time to retrieve information by simplifying access to content.
Figure 1. EHR data analysis and usage
The usage of EHR solutions has grown dramatically Hospital and clinical treatment settings. Usage with EHR Hospitals and clinics have the ability to enhance patient safety Minimizing mistakes, increasing performance and enhancing Treatment planning, while still offering a powerful data base for the researcher. The structures of the EHR can differ in terms of Functionality, which are usually known as simple EHR no clinical reports, simple EHR with clinical information, and Comprehensive schemes. Though lacking further mature Functionality and even simple EHR structures will provide wealth details on the patient's medical background, complications, and usage with medicines.
Arivazhagan et al. [1] suggested an in-depth taxonomy focused on the key characteristics described in them and carried out a systematic review of their effectiveness classification on a variety of datasets. Generally, self-labeled algorithms may be divided into two major groups: self-training and co-training. In the initial self-training, a single classifier is iteratively trained on an expanded labeled dataset with its most optimistic predictions on unmarked data, whereas in Co-training, two classifiers are independently trained using two separate views on a labeled dataset, and each classifier raises the labeled data of the other with its most optimistic predictions on unmarked data.
Within the literacy in this segment many self-labeled algorithms have been mentioned, several of which neglect methods and techniques of the ensemble. Co-learning draws on group philosophy, as it employs three distinct majority voting classifications and a method of confidence calculation to approximate unmarked instances. The tri-training algorithm uses a group of three classifiers which are trained on the data subsets generated by bootstrap collection and are taught by majority voting strategies to each other. Co-Forest utilizes bootstrap sample data for training random trees from the specified array. That random tree is repeated for each iteration using a pluralistic voting system by freshly chosen unknown instances for its concurrent ensemble.
Word Bag (BoW) is the most common method of classifying and retrieving text records. The BoW method presents the concept description as a function of the subject terms' frequency. The most important indicator of BoW is Term Frequency / Inverse File Frequency (TF / IFF). The terms used do not properly resemble them. To fix this drawback, topical simulation was created. This approach maps words in a latent space where potential objects are described. The Latent Dirichlet Assignment (LDA) is the well established field of design. For optimizing concepts iteratively, the LDA sampling method is used. The resultant approach generates a similar distribution of terms from a research handbook that contains the same selection of topics.
Throughout the text classification area, various classification methods have been introduced. Buch et al. [3] used a cross-entropic approach to document classification. This research is focused on the assumption that entropy is one of the better methods for analyzing knowledge quality in medical results. Battineni et al. [4] have established a medical data classification scheme for several data type levels. The "imbalance" dataset was used to evaluate their results.
Johnson et al. [5] suggested a tuberculosis CAD method for modern poster anterior chest radiographs. Originally, their suggested model uses a graph-cut segmentation approach to remove the lung area from the CXRs, and then a collection of texture and form characteristics in the pulmonary area is computed to identify the individual as regular or irregular. Their detailed computational tests on two real-world databases showed the feasibility of the experimental CAD tuberculosis screening program, achieving better efficiency relative to human readings.
Throughout the collection of such broad data, Chen et al. [6] offered an explanation as to how health care and management organizations gather data and safeguard problems. Big data helps identify the date of expiration of RFID-based drugs and surgical instruments. Enhance modes of diagnosis improve patient data consistency. Addressing key urban concerns including electricity, hygiene, rationing and gas connections, higher healthcare, unemployment reduction etc.
The lack of reliability and interoperability of health data from different places was a big obstacle for any patient to access more data. For each new prediction activities, a specific sequence is normally chosen, and the retrieval and standardization of data from various sources typically involves an extensive work cycle. Significant prior research focuses on the question of scalability through time-consuming standardization of data in traditional relational databases, such as the Observational Health Science and Informatics Consortium Medical Results Partnership Norm.
Zhou et al. [8] utilizes remote sensors in comprehensive health and activity monitoring schemes frameworks that have developed the possibility of tending to humans that needs in perceptive circumstances by real-time individual experiments. Though the concept of streams is in these structures Includes successful recognition methods, the same is true in exposure to alleged protection-based attacks. Battineni et al. [10] introduced a rapid advance in high throughput Innovations and pervasive use of technological EHRs prompted a short set of-genomics and data from the EHR. This voluminous, dynamic details contain abundant data for precise meds, and major cases. The investigation of knowledge can concentrate some learning on enhancements with the essence of government security benefits.
There are many real-world implementations where the goal brands are not mutually identical and need a multi-label distinction. Multi-label labeling includes associating each test variable with a series of goal labels. Multi-label grouping is thus a superset of the issues of binary and multi-class classification [16].
Firstly, the data analysis is performed to clean up the dataset. The preprocessing method involves the following steps:
•Document Pre Processing: in this stage, noise contents such as HTML tags are eliminated. We then define and strip out inappropriate material that does not include medical knowledge.
•Using the NLTK tokenizer, we remove relevant phrases from our data collection. = Sentence Tokenization:
•The NLTK word tokenizer for segmenting text into a sequence of token that fits the words loosely. Such words will also be used to derive the features of our platform.
•Removal of Stop Words: take away meaningless phrases. The words "the," "a," "an," "in," etc. are widely used for such pauses. We used the predefined stop word chart of the NLTK for this point.
The selection of the component classifiers is considered to be important for the efficiency of the ensemble and the main point for its effectiveness is focused on their variety and accuracy, whereas the integration of the individual classifiers' predictions takes place via a range of different philosophy techniques. The proposed model framework is depicted in Figure 2.
Figure 2. Proposed model framework
Through taking these into consideration, the suggested algorithm is based on the principle of choosing a collection of weight based N self-labeled classifiers WC = (WC1, WC2, ..... WCN) through applying proposed algorithm to a common dataset and integrating their individual predictions with a modern weighted classifier technique. It is worth remembering that weighted labeling is a widely employed method for integrating forecasts in pair wise grouping, in which classifiers are not considered fairly. Classifier is measured on the basis of the assessment weighted package WP and combined with the coefficient (weight), typically relative to its classification accuracy.
Based on the dataset parameters, multiple neurons are considered. Let $\beta_{i}$ is secret layer neurons count and the single layer network output 'Oj' is given as
$\sum_{i=1}^{N} \beta_{i} a f_{i}\left(x_{j}\right)=\sum_{i=1}^{N} \beta_{i} g\left(w_{i} \cdot x_{j}+\mathrm{hl}_{i}\right)$$+W(i)=O_{j}$ (1)
where, $w_{i}$ is the input weight, af(x) is the activation function, and $h l_{i}$ is the hidden layer bias and $\beta_{i}$ is the output weight.
Algorithm WbLCML
Input: DS={D1, D2, ..... DN}: Data set DS with data D.
Output: CS={WC1, WC2, ..... WCN}: Weighted Cluster set CS.
foreach ri ∈ DS
for each instance i,j ∈ ri
do
|WC(i)| ← W (I1, I2), I1 & I2 are instances of a record
where, W (S1, S2) is the weight of the instance parameters calculated as
$W C_{i, j}=\frac{2 T_{j}^{\left(C_{i}\right)}}{\left|I(W C)_{j}\right|+p_{i}^{\left(C_{i}\right)}+F_{j}^{\left(C_{i}\right)}}$ (2)
The classifier is trained such that the error difference between the actual output and the predicted output is 0 that represents the accurate classification of EHR Data that is represented as.
$\sum_{i=1}^{W}|| W C(i)_{j}-W C(j)_{i} \|=0+\beta_{i}$ (3)
where, each element weights $W C_{i, j}$ is defined by
$W C_{i, j}=\frac{2 T_{j}^{\left(C_{i}\right)}}{\left|I(W C)_{j}\right|+p_{j}^{\left(C_{i}\right)}+F_{j}^{\left(C_{i}\right)}}$ (4)
If WCi,j is a collection of dataset instances belonging to class T, Ci is the number of correct classifier predictions on WCi,j and $F_{j}^{\left(C_{i}\right)}$ is the number of incorrect WCi,j predictions that an instance belongs to class $I(W C)_{j}$. Clearly, every weight $W C_{i, j}$ is the F1-score of the classifier that should give priority for the instance for assigning weight for performing labeling and then classification. The reasoning to calculate the utility of each classifier in comparison to each class WCi,j of the test collection dataset DS. After allotting weights for the instance parameter values, labeling of data is done by
$L(W C(i)) \varepsilon D S=\arg _{j}^{\max } \sum_{i=1}^{M} w_{i, j} x_{A}\left(W C_{i}(T)\right)$$-a f_{i}\left(x_{j}\right)+\beta_{i}$ (5)
After completing the labeling of data, the data will be trained for performing classification of EHR data based on the weights assigned. In self-training iterations, the model may be predisposed to its class forecasts rather than to the majority of classes. Expected groups are under-sampled to obtain a consistent variant of weight W with the same amount of samples for both levels. In a binary environment, this implies having the same amount of samples in both groups. Classifier training for grouping relevant values used for normalization is performed using the equation
$\operatorname{CS}\left(W C\left(P\left(\frac{j}{i}\right)\right)\right)=\frac{\sum_{T} \exp [\mathrm{Fa}(i)-\mathrm{Fa}(j)]}{W C(i)+W C(j)}$ (6)
where, $C S\left(W C\left(P\left(\frac{j}{i}\right)\right)\right)$ is the normalization factor, and $F a(i)-F a(j)$ are two normalized activation functions used for labeling relevant data and then clusters are formed as
$C S\left(D S\left(W C_{N}\right)\right)=\sum_{i} \cdot \sum_{j} \exp [F a(i)-F a(j)]$$+\sum_{i=1}^{M} w_{i, j} x_{A}\left(W C_{i}(T)\right)-\beta_{i}$ (7)
The EHR data after calculating the normalization factors, the data based on the similarity of the weights is arranged based on threshold value ‘thr’.
$C S(W C(i))=\frac{\omega\left(I^{l}\right)}{\omega\left(W C_{i}(T)\right)}$, if $\frac{\sum_{i=1}^{M} \frac{i}{\bar{W}} \operatorname{CS}\left(\mathrm{DS}\left(W C_{N}\right)\right)}{F a(i)-F a(j)}>t h r$ (8)
Finally, Error Rate (ER) is calculated that is defined as the number of misplaced points over the total number of points in the dataset with uneven labeling and it is represented as
$E R(D S)$$=\sum_{i=1}^{n} \mathrm{~W}(\mathrm{i}, \mathrm{j} . . \mathrm{Wn})+\left(p_{n}+\operatorname{Max}(\mathrm{W}) * 100\right.$ (9)
The error rate of the proposed method is estimated to reflect the precision of the proposed method. The lower the error rate in supplying protection, the higher the security standard.
The proposed Weight Based Labeled Classifier using a Machine Learning (WbLCML) model is implemented using python and executed in ANACONDA SPYDER. The datasets are gathered from the link https://data.world/chhs/cfaaae24-55b9-417e-89bb-eaf5a5318023 and https:// dashboard.healthit.gov/ datadashboard / documentation/ cms-ehr-incentive-program-measures- documentation.php. The proposed model considers electronic records of the patients that are useful in giving proper medical suggestions. The proposed model is evaluated in terms of classification accuracy, specificity and sensitivity. Instead, of course, the key goal of the learning algorithm is to decrease the value of the loss function in relation to the parameters of the process by adjusting the value of the weight vector by various optimization techniques. The performance of the model is generally calculated after the model parameters have been defined and set and no testing has taken place. The test samples are then fed to the computer and the amount of errors the model produces is registered, relative to the specific goals. The proportion of misclassification is then determined for effective classification of medical data. Several data sets are analyzed and the testing and training samples are illustrated in Table 1. The dataset quality levels are depicted in Figure 3.
Sensitivity measure is done on the considered dataset using the equation
$Sensitivity=\frac{\text { True Positive }}{\text { True Positive+False Negative }}=\frac{A}{A+C} \times 100$ (10)
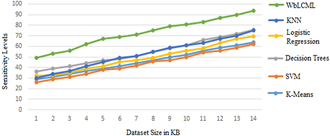
Table 2 illustrates the Sensitivity measures that are calculated. To calculate the sensitive measures by applying the proposed model on the dataset, the sensitivity leves are indicated. Numerous datasets are considered and applied on the traditional methods. The proposed model performance is better than the traditional models. Table 3 illustrates the sensitivity levels of the traditional and proposed models.
The proposed model is compared with the traditional models and the graphical representation of the Sensitivity values are depicted in Figure 4.
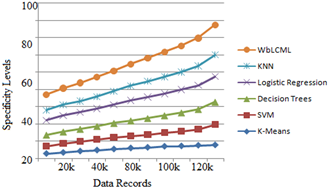
Specificity is calculated using following the following equation
$Specificity=\frac{\text { True Negativity }}{\text { True Negativity+False Positive }}=\frac{D}{D+B} \times 100$
Figure 3. Quality levels of the dataset
Table 1. Testing and training samples
|
Dataset links |
No.Of Features |
Training Samples |
Testing Samples |
|
http://archive.ics.uci.edu/ml/ |
48 |
24568 |
150 |
|
http://apps.himss.org/foundation/histdata.asp |
45 |
32561 |
180 |
|
http://dashboard.healthit.gov/datadashboard/data.php |
32 |
38665 |
172 |
|
https://mimic.physionet.org/ |
29 |
42250 |
200 |
|
https://openmrs.org/download/ |
24 |
43000 |
185 |
|
https://dashboard.healthit.gov/datadashboard/documentation/cms-ehr-incentive-program-measures-documentation.php. (Proposed Model) |
12 |
59893 |
3652 |
Table 2. Sensitivity measure in %
|
Input dataset |
Technique Used |
Input dataset |
Sensitivity Levels |
|
http://archive.ics.uci.edu/ml/ |
K-means |
28369 |
63.8 |
|
http://apps.himss.org/foundation/histdata.asp |
Support Vector Machine |
32968 |
61.9 |
|
http://dashboard.healthit.gov/datadashboard/data.php |
Decision trees |
45878 |
75.6 |
|
https://mimic.physionet.org/ |
Logistic regression |
55698 |
69.55 |
|
https://openmrs.org/download/ |
K-nearest neighbor. |
75658 |
74.9 |
|
https://dashboard.healthit.gov/datadashboard/documentation/cms-ehr-incentive-program-measures-documentation.php. (Proposed Model) |
Proposed WbLCML |
137568 |
93.85 |
Table 3. Specificity measure in %
|
Input dataset |
Technique Used |
Total |
Sensitivity |
|
http://archive.ics.uci.edu/ml/ |
K-means |
28369 |
39.8 |
|
http://apps.himss.org/foundation/histdata.asp |
Support Vector Machine |
32968 |
58.6 |
|
http://dashboard.healthit.gov/datadashboard/data.php |
Decision trees |
45878 |
64.5 |
|
https://mimic.physionet.org/ |
Logistic regression |
55698 |
72.6 |
|
https://openmrs.org/download/ |
K-nearest neighbor. |
75658 |
63.0 |
|
https://dashboard.healthit.gov/datadashboard/documentation/cms-ehr-incentive-program-measures-documentation.php. (Proposed Model) |
Proposed WbLCML |
137568 |
86.5 |
Table 4. Accuracy levels
|
Input dataset |
Technique Used |
Accuracy |
|
http://archive.ics.uci.edu/ml/ |
K-means |
72 |
|
http://apps.himss.org/foundation/histdata.asp |
Support Vector Machine |
74.6 |
|
http://dashboard.healthit.gov/datadashboard/data.php |
Decision trees |
62.8 |
|
https://mimic.physionet.org/ |
Logistic regression |
78.5 |
|
https://openmrs.org/download/ |
K-nearest neighbor. |
66.3 |
|
https://dashboard.healthit.gov/datadashboard/documentation/cms-ehr-incentive-program-measures-documentation.php. (Proposed Model) |
Proposed WbLCML |
94.3 |
Figure 4. Sensitivity levels
Figure 5. Specificity levels
Figure 6. Weighted cluster set
Figure 7. Labeling levels of EHR data
Figure 8. Accuracy levels
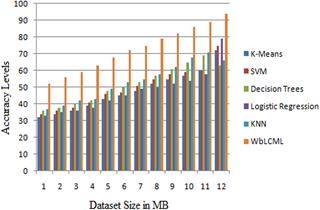
The specificity values calculated is depicted in Table 3 that are generated using the equation. The Table 4 indicates the accuracy levels of the proposed and traditional methods. The proposed model accuracy is more when compared to traditional models.
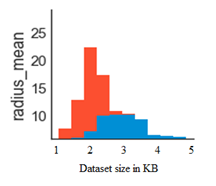
The proposed model is compared with the traditional models and the graphical representation of the Specificity values are depicted in Figure 5. The weighted cluster set is depicted in Figure 6. From the dataset considered, several features are considered and the establisged clusters are displayed in Figure 6. Each cluster set represents radius mean, texture mean and perimeter mean of the features considered. The relevant data is grouped as a cluster. The labelling of features is also performed for considering clustering of the data considering all the features for accurate classification. Based on the labelling data, the data is classified according to relevant data arrangement. The relavant weights instance data records forms as a cluster group for improving accuracy in the cluster of electronic health record data.
The Figure 7 illustrates the labeling levels of the EHR data. The proposed Weight Based Labeled Classifier using a Machine Learning (WbLCML) model is compared with the existing methods and the accuracy levels are depicted in Figure 8. The accuracy levels of the propose model is high when compared to traditional methods.
Unstructured text processing has attracted widespread popularity in the past few decades. It is an essential move in the NLP for further study of unstructured data. In the proposed Weight Based Labeled Classifier using a Machine Learning (WbLCML) model, the classification of online medical records utilizing machine learning analysis is done. Electronic Health Records offer a vast number of evidences for these models, however traditional epidemiological methods take a substantial number of study time to incorporate. Expert collection of variables, fine-tuning of variable transformations and relationships, and imputing missed values are time-consuming and can be subject to subsequent review, especially provided that the lack in EHR is both strong and may be significant. EHR analysis is an emerging field area that, if appropriately handled, will offer a tremendous opportunity to create predictive models for disease progression. There are several problems waiting for an answer and the scientific community's involvement in this important and exciting topic is validated by a growing number of publications linked to Deep EHRs. The large range of EHRs and the enormous volume of information gathered desperately need appropriate methods for translating evidence into insights, observations and behavior. The proposed model achieves better classification accuracy of the HER data for effective medical recommendations to the patients. In future the proposed model can be used with deep learning models for better outcomes and also the features need to be considered can be reduced.
[1] Arivazhagan, S., Shebiah, R.N., Ananthi, S., Varthini, S.V. (2013). Detection of unhealthy region of plant leaves and classification of plant leaf diseases using texture features. Agricultural Engineering International: CIGR Journal, 15(1): 211-217.
[2] Premebida, C., Faria, D.R., Nunes, U. (2017). Dynamic Bayesian network for semantic place classification in mobile robotics. Autonomous Robots, 41(5): 1161-1172. https://doi.org/10.1007/s10514-016-9600-2
[3] Buch, V.H., Ahmed, I., Maruthappu, M. (2018). Artificial intelligence in medicine: Current trends and future possibilities. British Journal of General Practice, 68(668): 143-144. https://doi.org/10.3399/bjgp18X695213
[4] Battineni, G., Sagaro, G.G., Nalini, C., Amenta, F., Tayebati, S.K. (2019). Comparative machine-learning approach: A follow-up study on type 2 diabetes predictions by cross-validation methods. Machines, 7(4): 74. https://doi.org/10.3390/machines7040074
[5] Johnson, K.W., Torres Soto, J., Glicksberg, B.S., Shameer, K., Miotto, R., Ali, M., Ashley, E., Dudley, J.T. (2018). Artificial intelligence in cardiology. Journal of the American College of Cardiology, 71(23): 2668-2679.
[6] Chen, Y., Luo, Y., Huang, W., et al. (2017). Machine-learning-based classification of real-time tissue elastography for hepatic fibrosis in patients with chronic hepatitis B. Computers in Biology and Medicine, 89: 18-23. https://doi.org/10.1016/j.compbiomed.2017.07.012
[7] Shousha, H.I., Awad, A.H., Omran, D.A., Elnegouly, M.M., Mabrouk, M. (2018). Data mining and machine learning algorithms using IL28B genotype and biochemical markers best predicted advanced liver fibrosis in chronic hepatitis C. Japanese Journal of Infectious Diseases, 71(1): 51-57. https://doi.org/10.7883/yoken.JJID.2017.089
[8] Zhou, W., Ma, Y., Zhang, J., et al. (2017). Predictive model for inflammation grades of chronic hepatitis B: Large‐scale analysis of clinical parameters and gene expressions. Liver International, 37(11): 1632-1641. https://doi.org/10.1111/liv.13427
[9] Liu, X., Li, N., Lv, L., Fu, Y., Cheng, C., Wang, C., Ye, Y., Li, S., Lou, T. (2017). Improving precision of glomerular filtration rate estimating model by ensemble learning. Journal of Translational Medicine, 15(1): 231. https://doi.org/10.1186/s12967-017-1337-y
[10] Battineni, G., Chintalapudi, N., Amenta, F. (2019). Machine learning in medicine: Performance calculation of dementia prediction by support vector machines (SVM). Informatics in Medicine Unlocked, 16: 100200. https://doi.org/10.1016/j.imu.2019.100200
[11] Keshani, M., Azimifar, Z., Tajeripour, F., Boostani, R. (2013). Lung nodule segmentation and recognition using SVM classifier and active contour modeling: A complete intelligent system. Computers in Biology and Medicine, 43(4): 287-300. https://doi.org/10.1016/j.compbiomed.2012.12.004
[12] Zeng, N., Qiu, H., Wang, Z., Liu, W., Zhang, H., Li, Y. (2018). A new switching-delayed-PSO-based optimized SVM algorithm for diagnosis of Alzheimer’s disease. Neurocomputing, 320: 195-202. https://doi.org/10.1016/j.neucom.2018.09.001
[13] Tuba, E., Mrkela, L., Tuba, M. (2017). Retinal blood vessel segmentation by support vector machine classification. 2017 27th International Conference Radioelektronika, Brno, pp. 1-6. https://doi.org/10.1109/RADIOELEK.2017.7936649
[14] Oakden-Rayner, L., Carneiro, G., Bessen, T., Nascimento, J.C., Bradley, A.P., Palmer, L.J. (2017). Precision radiology: Predicting longevity using feature engineering and deep learning methods in a radiomics framework. Scientific Reports, 7(1): 1648. https://doi.org/10.1038/s41598-017-01931-w
[15] Singh, S.M., Hanchate, D.B. (2018). Improving disease prediction by machine learning. International Research Journal of Engineering and Technology, 5(6): 1542-1548.
[16] Gawlitza, J., Sturm, T., Spohrer, K., Henzler, T., Akin, I., Schönberg, S., Borggrefe, M., Haubenreisser, H., Trinkmann, F. (2019). Predicting pulmonary function testing from quantified computed tomography using machine learning algorithms in patients with COPD. Diagnostics, 9(1): 33. https://doi.org/10.3390/diagnostics9010033
[17] Dolicanin, E., Fetahovic, I., Tuba, E., Capor-Hrosik, R., Tuba, M. (2018). Unmanned combat aerial vehicle path planning by brain storm optimization algorithm. Studies in Informatics and Control, 27(1): 15-24. https://doi.org/10.24846/v27i1y201802
[18] Sun, C., Duan, H., Shi, Y. (2013). Optimal satellite formation reconfiguration based on closed-loop brain storm optimization. IEEE Computational Intelligence Magazine, 8(4): 39-51. https://doi.org/10.1109/MCI.2013.2279560
[19] Tuba, E., Strumberger, I., Bacanin, N., Zivkovic, D., Tuba, M. (2018). Cooperative clustering algorithm based on brain storm optimization and k-means. 2018 28th International Conference Radioelektronika (RADIOELEKTRONIKA), Prague, Czech Republic, pp. 1-5. https://doi.org/10.1109/RADIOELEK.2018.8376369
[20] Arsuaga-Ríos, M., Vega-Rodríguez, M.A. (2015). Multi-objective energy optimization in grid systems from a brain storming strategy. Soft Computing, 19(11): 3159-3172. https://doi.org/10.1007/s00500-014-1474-7
[21] Tuba, E., Capor-Hrosik, R., Alihodzic, A., Tuba, M. (2017). Drone placement for optimal coverage by brain storm optimization algorithm. 17th International Conference on Hybrid Intelligent Systems (HIS 2017) held in Delhi, India, pp. 167-176. https://doi.org/10.1007/978-3-319-76351-4_17
[22] Liu, Y., Yieh, L., Yang, T., Drinkenburg, W., Peeters, P., Steckler, T., Narayan, V.A., Wittenberg, G., Ye, J. (2016). Metabolomic biosignature differentiates melancholic depressive patients from healthy controls. BMC Genomics, 17(1): 669. https://doi.org/10.1186/s12864-016-2953-2