
Khairul Anuar Shariff | Ishraq Abdalkareem Kalaf Alogaidi* | Ahmed Hafedh Mohammed Mohammed | Hasmaliza Mohamad | Muhamed Abdul Fatah Muhamed Mukhtar
© 2026 The authors. This article is published by IIETA and is licensed under the CC BY 4.0 license (http://creativecommons.org/licenses/by/4.0/).
OPEN ACCESS
The effect of firing temperature remains important to assess the modulus of rupture (MOR) performance of porcelain tiles containing 1 wt.% waste Iraqi porcelanite powder as a substitute for ball clay. The processed mixtures were milled for 24 h at 60 rpm, uniaxially compacted under 35 MPa, and sintered at 1100, 1200, or 1300 ℃ for 6 h at a heating rate of 5 ℃/min. X-ray fluorescence (XRF) and X-ray diffraction (XRD) characterisations were performed to study the compositional and phase evolution, and the mechanical behavior was evaluated by means of three-point flexural testing. Experimental results identified 1200 ℃ as the optimum firing temperature, giving the highest firing shrinkage, bulk density, and MOR. The maximum experimental MOR was 35.88 MPa in the Y-direction at 1200 ℃. Finite element evaluation was performed using ANSYS Workbench with an orthotropic material model based on experimentally determined specimen geometry, density, and breaking-load data. The X-direction experimental and finite element stresses were 27.58 and 26.46 MPa at 1100 ℃, 32.84 and 23.95 MPa at 1200 ℃, and 24.63 and 24.31 MPa at 1300 ℃, with errors of 4%, 27%, and 1%, respectively. The corresponding Y-direction errors were 92%, 39%, and 50%.
ANSYS simulation, Iraqi porcelanite, porcelain tile, three-point bending test, orthotropic analysis
In the porcelain tile industry, sintering temperature is critical and dictates final product performance, particularly with alternative additives like porcelanite, a silica-rich sedimentary rock with mineralogical and textural types well suited for ceramic formulations [1]. Thermal treatment causes deep structural transformations; crystalline phases (except quartz) decompose to form mullite and various glassy phases [2, 3]. The evolution of phases during firing is directly responsible for the obvious visual change in colour of ceramic bodies. This optical change is a consequence of the interaction of light with crystalline and vitrified phases. Besides the appearance, the firing temperature affects important physical parameters such as water absorption, apparent porosity, linear shrinkage, and flexural strength. Usually, high temperature promotes body densification and liquid phase generation, thereby decreasing open porosity and water absorption. Overfiring, however, causes pore expansion and bloating, ultimately weakening the ceramic matrix [4].
The physical outcomes are strongly influenced by process parameters like heating rate and sintering temperature. Gültekin [5] examined the effect of heating rates of 40, 50, and 60 ℃/min alongside sintering temperatures of 1210 ℃, 1220 ℃, and 1230 ℃ and reported that sintering temperature was the most significant factor for all physical measures. Strength was 51.2% dependent on temperature, shrinkage 86.7%, and bulk density 87.6%. Generally, physical measures reached their highest values at 1220 ℃, followed by overfiring, where closed pores expand due to internal gas pressure, leading to a decrease in bulk density and linear shrinkage [5]. Finite element analysis (FEA) has been employed alongside experimental three-point bending tests to investigate stress distributions and flexural behaviour in ceramic tiles and other brittle ceramic materials [6, 7]. Although extensively applied to metals and reinforced concrete, FEA is still underused in the mechanical analysis of ceramic tiles [8]. The finite element models validated by Defez et al. [9] have confirmed that the depth and location of the surface crack are the most important factors affecting the structural deflection, while the crack width and the sharpness of the crack tip are less important. However, such numerical simulations did not take into account waste-containing formulations and the impact of firing temperature on phase evolution, thermal conductivity, and strength.
Kalaf et al. [10] reported an enhancement in the mechanical properties of the ceramic tiles by adding Iraqi porcelanite at levels up to 3wt.%. Their finite element calculations, however, consistently produced lower flexural strength values than the experiments because the model represented an ideal body with perfect geometry, no pores, and an isotropic microstructure. A systematic assessment of numerical model reliability across different firing temperatures and loading orientations is therefore still required for waste-containing porcelain tiles. In particular, the relationship between firing temperature, phase evolution, pore morphology, thermal conductivity, flexural behaviour, and prediction accuracy has received limited attention. The present work addresses this gap using commercial porcelain tiles in which 1 wt.% waste Iraqi porcelanite replaces ball clay. Samples sintered at 1100, 1200, and 1300 ℃ were characterised by X-ray diffraction (XRD) and scanning electron microscopy (SEM) alongside physical evaluations of water absorption, apparent porosity, bulk density, and experimental modulus of rupture (MOR). The empirical MOR results were then compared with orthotropic FEA model results for loading orientations along the X, Y, and Z axes to evaluate the numerical accuracy, range of operation, and limitations of the modelling framework.
2.1 Preparation of porcelain tile specimens containing Iraqi porcelanite waste powder
Conventional ceramic materials, such as ball clay, china clay (Timex Kaolin Corp. Sdn. Bhd.), feldspar (Sibelco Malaysia Sdn. Bhd.), Bentonite and silica were all obtained from the School of Materials and Mineral Resources Engineering, Universiti Sains Malaysia. Iraqi porcelanite powder was supplied by the General Company for Geological Survey and Mining, Ministry of Industry and Minerals, Baghdad, Iraq. After preliminary trial tests, 1 wt.% of porcelanite was used as a partial replacement for ball clay. The Iraqi porcelanite waste powder was milled and sieved through a 75 μm sieve to obtain a suitable particle size fraction for addition to the porcelain tile formulation. X-ray fluorescence (XRF) analysis was used to determine the chemical composition of the powder prior to addition. The powder was mainly composed of SiO2 (82.8 wt.%) followed by Na2O (4.0 wt.%), SO3 (4.8 wt.%), CaO (4.607 wt.%) and P2O5 (2.7 wt.%), and minor amounts of Fe2O3 (0.8473 wt.%), K2O (0.121 wt.%), TiO2 (0.058 wt.%), Cr2O3 (0.022 wt.%) and MnO (0.018 wt.%). Table 1 shows the composition of the studied sample [11].
Table 1. The composition of the studied sample
|
Raw Material (wt.%) |
Control |
Sample |
|
China clay |
*Commercial porcelain tile formulation |
32 |
|
Ball clay |
21 |
|
|
Feldspar |
34 |
|
|
Bentonite |
6 |
|
|
Silica |
6 |
|
|
Iraqi porcelanite |
1 |
Note: * The commercial porcelain tile mixture was provided by an industrial partner who wished to remain anonymous regarding authorship and institutional details.
The raw materials underwent ball milling at 60 rpm for 24 h to obtain a homogeneous fine powder mixture to produce thirty-six porcelain tile specimens containing 1 wt.% waste Iraqi porcelanite powder. Subsequently, distilled water was lightly sprayed onto the powder mixture to improve its plasticity and compaction behaviour. Then, the conditioned mixture was loaded into a 100 mm × 40 mm × 5 mm rectangular steel die and compacted at 35 MPa for 5 min using a hydraulic press (Enerpac Tool Group, USA). Subsequently, the green compacts underwent thermal processing in a chamber furnace (Carbolite RHF 1600, UK) at 1100 ℃, 1200 ℃, and 1300 ℃. After thermal treatment, the fired specimens were characterised using XRF, XRD and SEM and tested for volumetric shrinkage, bulk density, water absorption, apparent porosity and MOR [12].
2.2 Visual inspection
The visual evaluation was carried out by examining the porcelain tiles after firing, visually checking for any modification that may have occurred during the sintering process. Colour changes on the surface can be seen, and physical deformations such as bending, curvature, or warping can occur. The aim of this assessment is to determine the main physical changes caused by changes in firing temperature. The specimens were examined visually under appropriate lighting conditions.
2.3 X-ray fluorescence spectrometry characterisation
Chemical characterisation of the sintered ceramic bodies was carried out via wavelength-dispersive XRF spectrometry using a Rigaku ZSX Primus II instrument (Japan) to quantify the primary elemental components. The specimens were first crushed using a Marcy Gy-Roll cone crusher (U.S.A.) and then ground in a ring mill for 3 min to obtain a homogeneous fine powder. Subsequently, a 25 g fraction of the homogeneous powder was isolated by passing it through a 75 μm sieve. For each firing temperature, a representative homogenised sample was analysed once by XRF. Therefore, the reported oxide concentrations represent individual measurements rather than averages of repeated measurements.
2.4 Compositional analysis using X-ray diffraction
Crystalline phase identification was conducted via powder XRD using a Bruker AXS D8 Advance system equipped with Cu-Kα radiation (operated at 40 kV and 40 mA). Angular scanning recorded 2θ values from 10° to 90°. Generated patterns were cross-matched against International Centre for Diffraction Data (ICDD) reference standards. Software processing of raw XRD spectra was completed via X'Pert HighScore Plus, whereas quantitative phase composition was determined using INEL-EQUINOX 3000 software [13].
2.5 Morphological analysis
For microscopic examination, the fired tiles were cut into approximately 10 mm × 10 mm pieces using a GEOCUT 302-S variable-speed diamond cutter (Metkon Instruments, Turkey). Each piece was mounted on carbon tape and sputter-coated with a gold-palladium layer for 5 min under vacuum using an MC1000 coating unit (Hitachi High-Tech, Tokyo, Japan) to provide a conductive surface. Microstructural observations of the sample cross-sections were performed with a desktop SEM (TM4000Plus, Hitachi High-Tech, Tokyo, Japan) operating at magnification levels of 500×, 1000×, and 2000× [14]. A simple image-based pore-counting analysis was performed on the SEM micrographs. The clearly identifiable pores marked in each representative micrograph were counted manually, and the resulting pore counts were compared among the three firing temperatures.
2.6 Fired shrinkage analysis
The factor that controls the final dimensions of ceramic products is the shrinkage due to the sintering process. To evaluate the sintering shrinkage, three rectangular specimens (100 mm × 40 mm × 5 mm) were prepared for each condition using 35 g of raw powder. Uniaxial pressing was used at 35 MPa with a dwell time of 5 min. Thermal processing was conducted at 1100 ℃, 1200 ℃, and 1300 ℃ with a constant heating rate of 5 ℃/min, followed by a 6 h isothermal holding period and subsequent in-furnace cooling down to ambient temperature (25 ℃). The dimensional change was evaluated with reference to ISO 10545-2 [15] and ASTM C326-09 [16], and the volumetric fired-shrinkage value was calculated using Eq. (1).
Fired shrinkage (%) = (V1-V2)/V1×100% (1)
where, V1 and V2 represent the dry (unfired) and fired volumes of the ceramic specimens (cm3), respectively.
2.7 Bulk density
The bulk density of the fired samples was determined by the water immersion technique, following Archimedes’ principle, in compliance with the ISO 10545-3 [17] testing methods. The calculation was performed using Eq. (2). Only the bulk density value was reported in this study to retain clarity and avoid ambiguity.
Bulk density = M1/V2 (2)
where, M1 corresponds to the dry specimen mass (g), and V2represents the volume of the sintered ceramic tile (cm3).
2.8 Water absorption
Water absorption is an indirect evaluation of open pores in the ceramic structures, which is obtained by the ratio between the saturated water mass and the dry specimen weight and is a reliable indicator of the percentage of interconnected pores in the ceramic microstructure [18]. The water absorption capacity of the samples fired at different temperatures was evaluated by using the distilled water immersion method for 24 h, according to the ISO 10545-3 standard [17], which requires test specimens to be dried to a constant mass and saturated with distilled water for 24 h [19]. The percentage of water absorption was calculated based on Eq. (3):
Water absorption (%) = (M2–M1)/M1 ×100% (3)
where, M1 denotes the initial dry mass (g), and M2 signifies the saturated mass (g) of the sintered tile.
2.9 Apparent porosity
The apparent porosity was calculated according to ISO 10545-3 [17] based on the ratio between the open pore volume and the bulk volume of the fired bodies. The data were collected simultaneously with the water absorption test, and the final values were obtained through Eq. (4):
Apparent porosity (%) = (M2 – M1)/V2ρwater × 100% (4)
where, M1 corresponds to the initial dry mass (g), M2 stands for the soaked specimen mass (g), V2 is the volume of the sintered ceramic tile (cm3), and ρwater is the density of water (g/cm3).
2.10 Modulus of rupture for sintered ceramic tiles
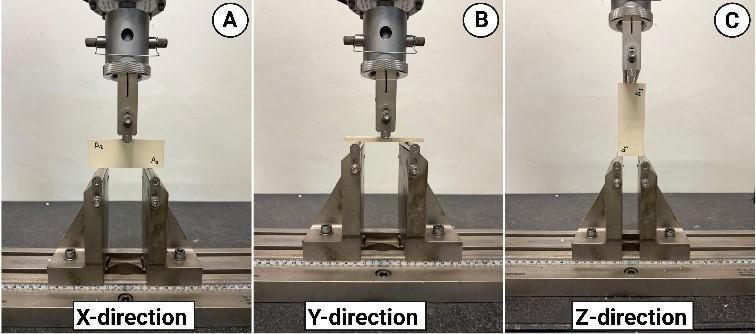
The MOR values of the ceramic specimens at different sintering temperatures were measured by three-point flexural testing according to ISO 10545-4 [20] guidelines using an MST433 model (Macklow-Smith Engineering Ltd., Surrey, UK) with a 5 kN capacity load cell at a constant loading speed of 5 mm/min. As shown in Figure 1, the loading was evaluated in three spatial directions (X, Y, and Z) to observe orientation effects. Physical dimensions were determined first, after which a normal force was exerted vertically at the midpoint of the tile. The data for each combination of firing temperature and loading orientation were measured in triplicate (n = 3) and expressed as mean values ± standard deviation. The flexural strength was calculated using Eq. (5):
MOR = 3FL/2bd2 (5)
where, F indicates the applied breaking force (N), L denotes the support span (mm), b and d correspond to the sample width and thickness (mm), respectively.
Figure 1. Experimental arrangement for three-point bend testing shown across distinct directional axes: (A) X-direction, (B) Y-direction and (C) Z-direction
The specimens were evaluated under three loading orientations because uniaxial pressing and firing may produce directional variations in particle alignment, density, pore distribution, and microcracking within the ceramic tile. Consequently, the fired tile may not exhibit identical mechanical behaviour along all three material axes. The in-plane flexural response was evaluated using configurations A and B corresponding to the X and Y-directions, respectively, and the C configuration corresponding to the Z-direction was included to examine the through-thickness response. The evaluation of these different directions made it possible to assess the directional dependence in the results of the MOR and therefore provide a benchmark to explore the applicability of an orthotropic finite element model. However, the applicability of Eq. (5) depends on the specimen geometry and span-to-thickness ratio. Therefore, the X and Y-direction results were considered the primary basis for quantitative MOR evaluation and numerical-model validation. The Z-direction results were used only to examine directional sensitivity and stress-distribution behaviour because this configuration did not fully satisfy the slender-beam assumption.
2.11 Finite element analysis
Together with the experimental flexural tests, a numerical assessment of the mechanical response of the fired ceramic tiles was achieved through FEA. Finite element simulation was performed to estimate the stress field, deformation patterns, and flexural behavior under three-point bending tests. To validate the model and to assess the accuracy of the assumed material properties, numerical results were benchmarked with experimental data. The FEA was carried out using the ANSYS Workbench 2022 R1 to construct a 3-dimensional model of the ceramic tile specimen. The flexural behavior of the ceramic tiles was simulated by using the Static Structural module. The boundary conditions were chosen to replicate the experimental three-point bending test. The sample was placed on two bottom supports, maintaining the identical span distance used in the empirical testing, with the force exerted at the center span via an upper loading anvil. This configuration assumed that the simulated flexural response was representative of the actual test configuration [7].
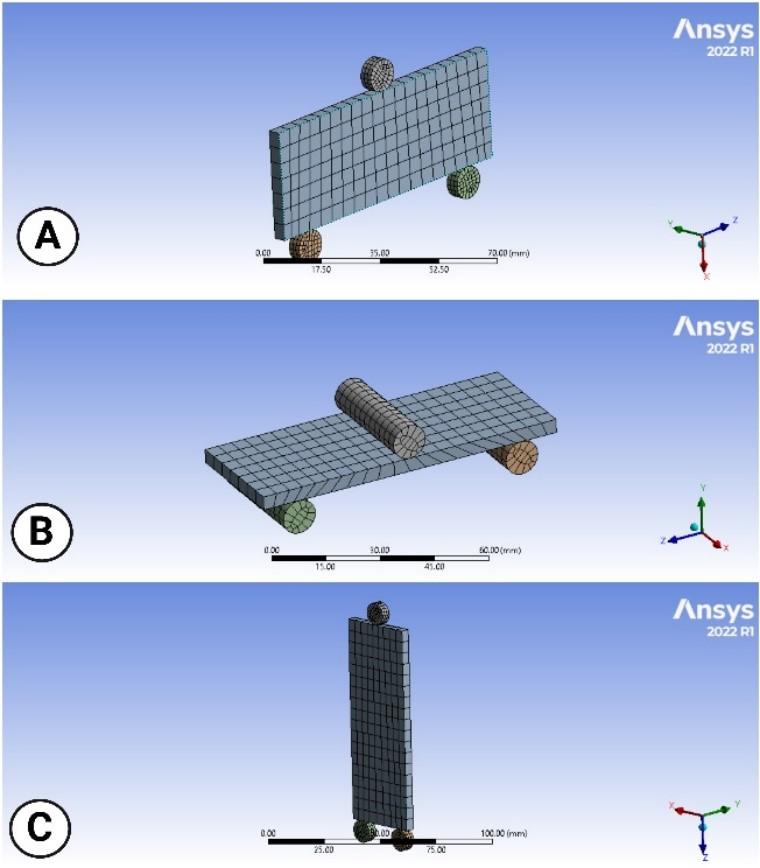
SpaceClaim was employed to construct the test-specimen geometry. Nine models were analysed in three loading orientations (X, Y and Z) at each of three firing temperatures. Material axes were defined as orthogonal to reflect heterogeneity and potential orthotropy of the ceramic. Table 2 summarizes the physical and mechanical characteristics assigned to the ceramic model, which were experimentally measured prior to simulation. The Young’s modulus values used in the orthotropic finite element model were obtained experimentally from three-point bending tests. The flexural test system recorded the load–deflection response of three specimens for each testing direction and reported the flexural modulus from the elastic portion of the load–deflection curve. For a rectangular specimen subjected to three-point bending, the flexural modulus can be expressed as Eq. (6), ASTM C674-13 [21]. The shear modulus (Gxy, Gyz, and Gxz) was estimated using Eq. (7) [22] based on the calculated Young’s modulus and the assumed Poisson’s ratio, while Poisson’s ratios (νxy, νyz, and νxz) were assumed [23].
Ef = mL3/4bd3 (6)
G = Ef/2(1+ⱱ) (7)
where, Ef refers to the flexural modulus (N/mm2), m indicates the slope along the linear elastic section of the load–displacement curve (N/mm), L is the span length (mm), b is the specimen width (mm), and d is the specimen thickness (mm). G refers to the shear modulus (N/mm2) and $$ represents the poisson's ratio. The simulations were then executed to obtain the flexural strength for each configuration.
The material parameters used in the finite element model were estimated based on a combination of experimental measurements, derived quantities, and assumptions based on literature. In particular, the Poisson’s ratios were taken from the literature and not measured experimentally. This assumption may affect the calculated shear moduli and thus the simulated stress distributions and structural deflections resulting from the FEA and should be considered when interpreting the numerical results.
Table 2. Input ceramic tiles’ properties for flexural simulation
|
Property |
1100 ℃ |
1200 ℃ |
1300 ℃ |
|
Flexural Modulus (Ex) (MPa) |
2776.21 |
2266.84 |
2288.98 |
|
Flexural Modulus (Ey) (MPa) |
19845.02 |
26168.27 |
27054.58 |
|
Flexural Modulus (Ez) (MPa) |
13.87 |
8.16 |
9.68 |
|
Poisson’s Ratio xy |
0.18 |
0.18 |
0.18 |
|
Poisson’s Ratio yz |
0.18 |
0.18 |
0.18 |
|
Poisson’s Ratio xz |
0.18 |
0.18 |
0.18 |
|
Shear Modulus (Gxy) (MPa) |
1176.36 |
960.53 |
969.06 |
|
Shear Modulus (Gyz) (MPa) |
8408.91 |
11088.25 |
11463.81 |
|
Shear Modulus (Gxz) (MPa) |
5.88 |
3.46 |
4.10 |
|
Specimen’s Density (g/cm3) |
2.53 |
2.61 |
2.59 |
Note: Flexural modulus Ex, Ey, and Ez were obtained experimentally from three-point bending tests. Poisson’s ratios were adopted from the literature as νxy, νyz, and νxz=0.18 [23]. The shear moduli were subsequently estimated using Gxy=Ex/[2(1+νxy)], Gyz=Ey/[2(1+νyz)], and Gxz=Ez/[2(1+νxz)] [22]. The specimen density was determined experimentally from the measured mass and volume.
Figure 2. Geometrical model of ceramic tiles in three-point bending (different viewing/loading orientations, A–C). (A) X-direction, (B) Y-direction, and (C) Z-direction
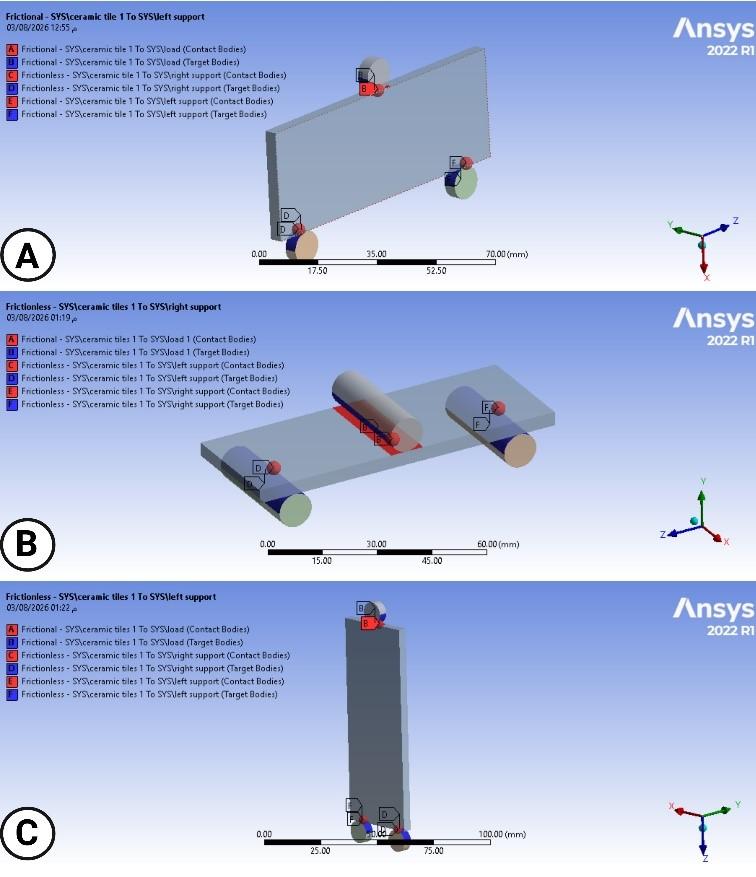
Both isotropic and orthotropic material models were compared to justify the constitutive assumption in the flexural FE analysis. The isotropic model was adopted as a baseline because it is straightforward when only an average Young’s modulus is available and is commonly used as a first approximation in ceramic tile simulations [10]. An orthotropic approach was then applied to account for spatial stiffness disparities (Ex, Ey, and Ez) and quantify directional dependencies on the modeled flexural response (Figure 2 and Figure 3). Figure 4 demonstrates the contact mechanics between the tile and the test fixtures. This comparison indicates whether anisotropy is required to match the experimental load–deflection and flexural strength trends. Figure 4 illustrates the contact definitions used in the three-point bending finite element model between the ceramic tile specimen, the upper loading roller, and the two lower support rollers. The mechanical load was introduced through a midpoint upper roller, while the tile was supported beneath by two rollers arranged with an identical test span. These contact regions were defined to reproduce the actual load-transfer mechanism during the flexural test. The definition of the contact is important because it avoids unrealistic penetration between the rollers and the ceramic tile and enables the applied load to be transferred gradually through the contact area rather than in a single point.
Figure 3. The meshing of the ceramic tiles in three-point bending (different viewing/loading orientations, A–C). (A) X-direction, (B) Y-direction and (C) Z-direction
Figure 4. Contact definition between ceramic tiles and load with support
2.12 Statistical analysis
Experimental data were statistically analyzed, and results are expressed as mean values ± standard deviations of three replicate samples per evaluation state (n = 3). Single-factor analysis of variance (ANOVA) with Tukey’s post-hoc test was applied to analyze the differences in sintering temperature. Further statistical analysis was carried out to analyze the variation in the loading directions of the MOR parameters. The degree of property modifications was determined by calculating probability values and relative percentage changes from the baseline of 1100 ℃. Statistical significance levels were *** p < 0.01, ** p < 0.05, * p < 0.1, and n.s. for non-significant variation.
3.1 Experimental results
3.1.1 Physical appearance for fired samples with 1 wt.% porcelanite
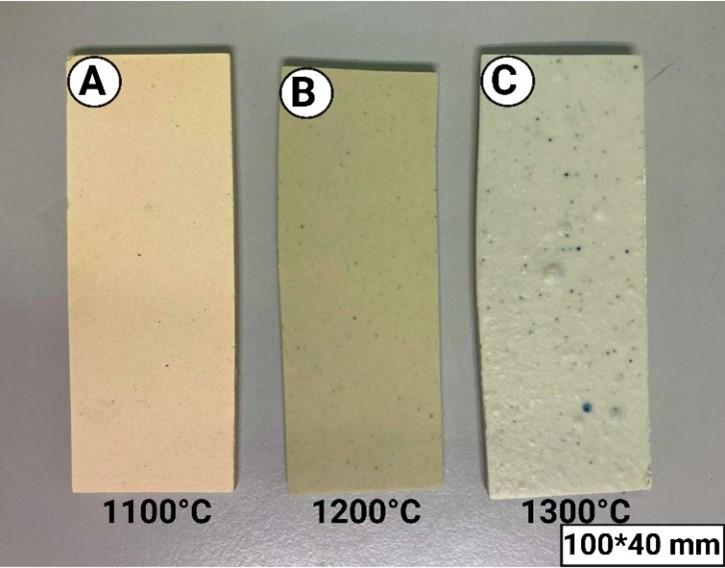
Tiles subjected to 1100 ℃ firing demonstrate a homogeneous, smooth texture characterised by scarce visible pores or glaze formation. The fired samples at 1200 ℃ have a still relatively smooth texture, but are glossier and denser than at 1100 ℃, indicating optimal vitrification. The texture of the fired samples at 1300 ℃ exhibits visible bloating, pinholes, and trapped gas pores; i.e., the texture is not smooth. Excessive vitrification and gas evolution at this high temperature result in surface roughness and defects [11]. Figure 5 demonstrates a visible coloration transition from white to a light grey tone. This phenomenon stems from the reactivity of trace impurities, specifically Fe2O3 and TiO2 contained within the clay precursors (ball clay, china clay, and bentonite). The change in porcelain coloration is mainly due to Fe2O3 acting as a major pigmenting agent, which reacts with SiO2 and Al2O3 to form red hematite phases [4, 24]. The image also shows progressive dimensional distortion (warpage) from sample A to C. This sintering-induced warpage is directly due to increased liquid-phase development, promoted by higher concentrations of fluxing oxides (K2O, MgO and CaO). Thus, higher flux content results in more extensive liquid formation and hence increased tile deformation [25].
Figure 5. The physical appearance of each tile with 1 wt.% porcelanite after firing at different firing temperatures
3.1.2 Elemental X-ray fluorescence analysis
XRF analysis of elemental compositions of 1 wt.% Iraqi porcelanite samples sintered at different temperatures is shown in Table 3. The percentage of SiO2 increased slightly from 59.8 wt.% to 61.7 wt.% while the percentage of Al2O3 decreased from 28.5 wt.% to 24.9 wt.% as the sintering temperature was elevated within the range of 1100 ℃- 1300 °C. This is due to the thermal decomposition of kaolinite and the formation of mullite (3Al2O3·2SiO2) as described in Eqs. (8)-(10) [26]. During this process, a part of the Al2O3 is consumed in forming the mullite crystalline phase, which leads to its apparent decrease in the total oxide composition, and SiO2 becomes relatively abundant at higher temperatures. Thus, the relative SiO2 detected by XRF increases and Al2O3 decreases due to its participation in mullite crystallization [27]. In addition, the chromophoric oxide contents are highest for the samples sintered at 1200 ℃ (2.76 wt.% Fe2O3 and 0.45 wt.% TiO2), which results in a deeper visual colour of the ceramic body. The relatively higher Fe2O3 content at 1200 °C is attributed to the concentration effect, as other major oxides (e.g., SiO2 and Al2O3) start to dissolve in the liquid phase. However, the Fe2O3 content decreases slightly at 1300 ℃, which could be related to the incorporation of iron into Fe-Al spinel phases (FeAl2O4) and its partial participation in mullite-associated reactions [7].
Al2O3.2SiO2.2H2O (Kaolinite) ── (400–500) ℃ → Al2O3.2SiO2 (metakaolinite) +2H2O (8)
2(Al2O3.2SiO2) (metakaolinite) ── (~950 ℃) → Si3Al4O12(spinel) + SiO2 (9)
3Si3Al4O12 (Al-Si-spinel) ── (>1050 ℃) → 2(3Al2O3.2SiO2) (mullite) + 5SiO2 (10)
The optimum molar ratio of Al2O3/SiO2 for mullite phase formation is 3:2 [28]. Specimens fired at 1100 ℃, 1200 ℃ and 1300 ℃ exhibited Al2O3/SiO2 mass ratios of 0.48, 0.46 and 0.40, signifying silica-dominant formulations, particularly within the 1100 ℃ - 1200 ℃ range. The excess SiO2 leads to an amorphous silica phase which favours the filling of the pores and a reduction of the pore size during sintering. Additionally, ceramic specimens sintered at 1300 ℃ exhibited an elevated alkali oxide concentration (10.44 wt.%) functioning as effective fluxing compounds. These fluxes reduce the viscosity of the molten phase and improve its flow properties, thus reducing the thermal threshold required for complete vitrification [27].
Table 3. X-ray fluorescence (XRF) analysis of all samples incorporating 1 wt.% Iraqi porcelanite after the firing process with different firing temperatures
|
Oxide composition (wt.%) |
Control |
Firing Temperature |
||
|
1100 ℃ |
1200 ℃ |
1300 ℃ |
||
|
SiO2 |
57.8 |
59.8 |
59.9 |
61.7 |
|
Al2O3 |
16.1 |
28.5 |
27.4 |
24.9 |
|
TiO2 |
3.17 |
0.49 |
0.45 |
0.38 |
|
Fe2O3 |
10.3 |
1.83 |
2.76 |
2.29 |
|
K2O |
5.60 |
7.06 |
7.02 |
8.11 |
|
CaO |
5.05 |
0.40 |
0.43 |
0.45 |
|
MgO |
0.00 |
0.47 |
0.50 |
0.42 |
|
MnO |
0.07 |
0.02 |
0.03 |
0.03 |
|
Na2O |
0.00 |
1.19 |
1.19 |
1.46 |
|
Al2O3/SiO2 ratio |
0.28 |
0.48 |
0.46 |
0.40 |
|
Total fluxing oxides |
10.65 |
9.12 |
9.14 |
10.44 |
3.1.3 Phase analysis
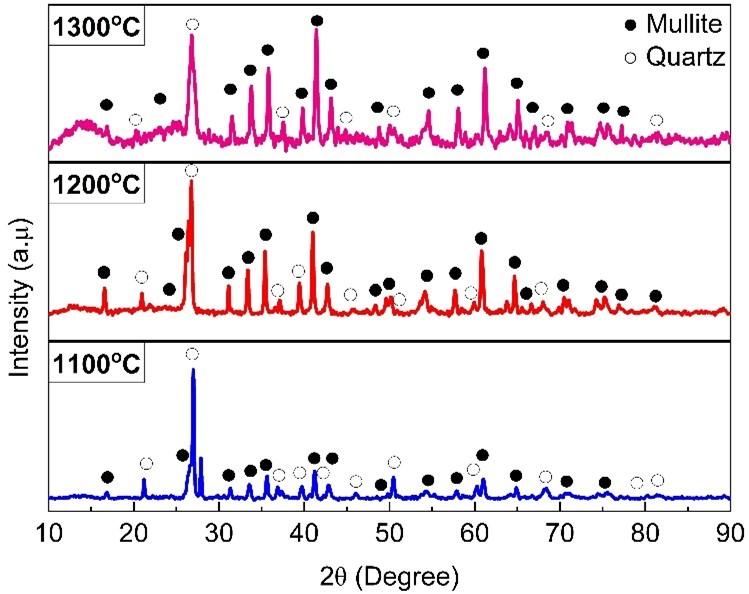
Figure 6 displays the XRD spectra recorded at sintering temperatures of 1100 ℃, 1200 ℃ and 1300 ℃ for the developed ceramic matrix. The unit cell dimensions of mullite and quartz at these thermal conditions are given in Table 4. Quartz (SiO2) and mullite (3Al2O3·2SiO2) were indexed as the principal crystalline phases in the diffraction patterns. The observed diffraction profiles show the evolution of phase transitions with increasing heat treatment, especially the formation of mullite. Such a transition illustrates the function of liquid phase development in controlling the reactivity between aluminosilicate components. These results are in satisfactory agreement with previous observations reported by Amigó et al. [29] and Chen et al. [30], reinforcing in this way both the evolution and thermal stability of the crystalline phases detected.
Figure 6. The X-ray diffraction (XRD) patterns for samples fired at 1100 ℃, 1200 ℃, and 1300 ℃
Table 4 further substantiates that the lattice dimensions of both quartz and mullite phases exhibited minimal thermal sensitivity across the tested temperature range. Therefore, indicating that the basic crystal structures of these phases remained relatively stable. This means that the temperature increase did not produce a major structural transformation in the identified crystalline phases. The variation in XRD peak intensity and sharpness indicated that the firing temperature mainly influenced the phase development and the crystallinity. The higher intensity of mullite peaks at higher temperatures shows a higher degree of formation of mullite and growth of the crystallites. Prominent quartz diffraction peaks establish quartz as one of the primary crystalline constituents. Hence, increasing the firing temperature predominantly drives phase refinement and improved degree of crystallization.
Table 4. Lattice parameters (a, b, and c) of the identified crystalline phases
|
Firing Temperature (℃) |
Phase |
a(Å) |
b(Å) |
c(Å) |
|
1100 |
Mullite |
7.5811 |
7.6865 |
2.8872 |
|
Quartz |
4.9404 |
4.9404 |
5.4213 |
|
|
1200 |
Mullite |
7.5539 |
7.6909 |
2.8839 |
|
Quartz |
4.9258 |
4.9258 |
5.4123 |
|
|
1300 |
Mullite |
7.5546 |
7.6930 |
2.8863 |
|
Quartz |
4.9130 |
4.9130 |
5.4050 |
Note: a, b, and c represent the crystallographic lattice parameters (unit-cell dimensions) of the identified phases, expressed in angstroms (Å).
3.1.4 Scanning electron microscopy microstructural analysis
Figures 7(a)–(c) depict the cross-sectional SEM micrographs of the ceramic tiles containing 1 wt.% waste Iraqi porcelanite powder fired at 1100, 1200, and 1300 ℃, respectively. Cross-sectional SEM micrographs were selected because they reveal the internal microstructure of the tile body, which is closely related to open porosity and water absorption [31]. For each firing temperature, one representative SEM micrograph was analyzed with a simple image-based pore counting analysis. The pore counts at 1100, 1200, and 1300 ℃ are presented in Table 5. These were manually counted from the visually identifiable pores within the selected field of view and are 23, 5, and 11, respectively. These numbers are the number of pores that can be seen and counted in the individual example micrographs and are not averages of several measurements. The significant reduction in pore number at 1200 ℃ implies an enhancement in densification and pore closure, whereas the increase at 1300 ℃ reflects the creation of microstructural defects due to over-firing. The decline in porosity is directly governed by liquid phase development during firing [4], where capillary action effectively fills and closes open pores within the ceramic matrix [32].
Fluxing agents promote pore filling by increasing the liquid phase during firing, while the viscosity of the resulting melt is expected to decrease with higher flux content, facilitating viscous flow into pores [33]. As can be seen from Figure 7, the cross-sectional morphology displays notable changes as firing increases from 1100 ℃ to 1300 ℃. At the lowest firing temperature, 1100 ℃, Figure 7(a), the sample shows an irregular surface, and there are still small particles that did not combine; neck formation between particles is minimal, and densification has not progressed significantly. Consequently, the sample exhibits high apparent porosity (4.47%) and water absorption (1.76%), as shown in Figure 8, due to insufficient densification, resulting in a high fraction of open pores and an open pore network. At 1100 °C, the relatively high porosity may be attributed to incomplete densification due to insufficient liquid-phase-assisted sintering and limited diffusion. Although partial liquid-phase formation may occur at this temperature, the extent of viscous flow and particle rearrangement may be insufficient to eliminate open pores effectively. Meanwhile, at 1200 ℃, there is a more advanced stage of sintering with improved particle bonding (neck growth), partial vitrification, and a marked reduction in open porosity as the pores become smaller and more isolated. Consequently, both apparent porosity and water absorption experienced a marked decline to 0.10% and 0.04%, respectively, reflecting a more homogeneous microstructure with substantial densification, as illustrated in Figure 8. However, at 1300 ℃, there is extensive vitrification accompanied by excessive shrinkage and development of microcracks due to thermal stress. Upon cooling, localized thermal stresses accumulate as a consequence of the thermal expansion coefficient mismatch between unreacted quartz grains and the encompassing glassy/mullite matrix, ultimately inducing microcrack propagation [34]. These microstructural flaws result in high apparent porosity (0.24%) and water absorption (0.09%), despite the dense surface morphology. Therefore, moderate firing (1200 ℃) leads to better densification and structural integrity, but over-firing (1300 ℃) can deteriorate the quality of ceramics due to generation of cracks, increasing the open porosity.
Figure 7. Cross-sectional samples at (a) 1100 ℃, (b) 1200 ℃ and (c) 1300 ℃ (yellow circles highlight internal pore distribution within the ceramic tiles)
Table 5. Image-based pore count obtained from the scanning electron microscopy (SEM) micrographs
|
Firing Temperature (℃) |
Number of Marked Pores |
|
1100 |
23 |
|
1200 |
5 |
|
1300 |
11 |
3.1.5 Fired shrinkage and bulk density
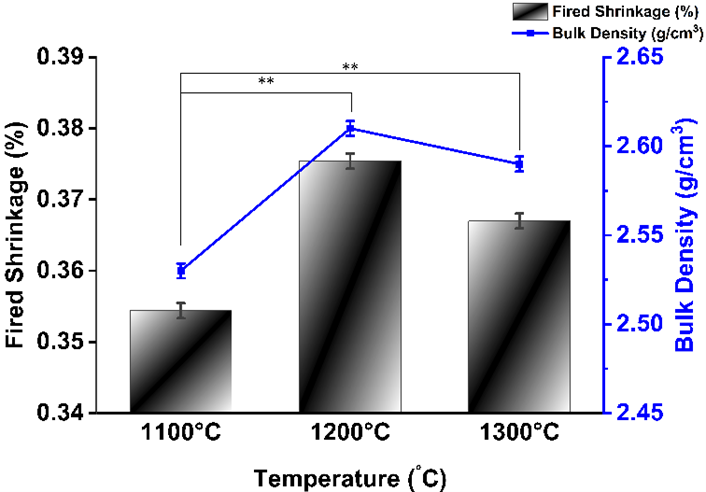
The firing shrinkage and bulk density for the ceramic tiles across various temperatures are illustrated in Figure 8. The general trend shows that firing shrinkage and bulk density progressively increased from 35.44% and 2.53 g/cm3 at 1100 ℃ to 37.54% and 2.61 g/cm3 at 1200 ℃, respectively. This behavior indicates an increased densification at 1200 ℃, mainly due to liquid-phase sintering, promoting a rearrangement of the particles and a closure of the pores. During firing, clay minerals decompose and form a reactive aluminosilicate matrix. Subsequently, the metastable Al–Si spinel phase interacts with non-crystalline silica, leading to mullite crystallization. The mullite formation process is associated with volumetric expansion, which can partially offset the normal firing shrinkage caused by liquid-phase sintering. Therefore, although densification promotes shrinkage, the formation and growth of mullite may counterbalance part of this shrinkage. A slight drop in bulk density occurred when the firing temperature was shifted from 1200 ℃ to 1300 ℃, confirming that further densification was hindered. At this higher temperature, too much liquid phase is formed, and mullite grows rapidly, leading to the development of closed pores and gas entrapment. Under such conditions, pore inflation or bloating may take place, which counteracts the normal sintering shrinkage to some extent and reduces the effectiveness of densification. Moreover, the closed pores hinder further densification by blocking the elimination of pores and restraining mass transport [25]. The decrease in open porosity, as evidenced by the microstructural analysis in Figure 7 (samples a–c), stems from liquid-phase formation throughout sintering, which promotes particle rearrangement and pore closing. In general, the best sintering was achieved at 1200 ℃, where shrinkage and densification were balanced without significant structural defects. At 1300 ℃, the microstructural integrity may be compromised due to over-firing effects and gas entrapment within closed pores [35]. Therefore, the following section deals with water absorption and apparent porosity to evaluate how porosity affects the bulk density and firing shrinkage. Statistical distinctions between 1100 ℃ and higher thermal conditions are designated by the brackets and notations in Figure 8.
3.1.6 Water absorption and apparent porosity
Therefore, the results about water absorption and apparent porosity are discussed in this section in an effort to better understand the relationship between porosity, bulk density, and firing shrinkage. Figure 9 shows the values of water absorption and the apparent porosity of the sintered ceramic samples. Both parameters exhibited a sharp decline when the firing temperature was raised from 1100 ℃ to 1200 ℃, followed by a slight increase upon reaching 1300 ℃. The relatively high water absorption (1.76%) and apparent porosity (4.47%) at 1100 ℃ show that the sintering is not complete and there are still open pores, which is in agreement with the loosely packed grains and visible porosity in the SEM micrograph in Figure 7(a). At the firing temperature of 1200 ℃, both values decreased sharply, and the water absorption was at its minimum value of about 0.04%. This reduction can be due to the enhanced liquid-phase sintering and partial vitrification, which resulted in particle rearrangement, grain coalescence, pore closing, and densification. This interpretation agrees with the denser microstructure observed in Figure 7(b) and the higher bulk density shown in Figure 8. Nevertheless, water absorption and apparent porosity experienced a minor uptick to 0.09% and 0.24%, respectively, at 1300 ℃. This behavior may be related to over-firing effects, where excessive liquid-phase formation and gas entrapment promote the development of enlarged or closed pores, pore inflation/bloating, and possible microcrack formation, which can limit further densification and partially reopen porosity [36]. Accordingly, the SEM image in Figure 7(c) supports this interpretation, as it shows more defined pores than the denser structure at 1200 ℃ [37]. Overall, the combined results of Figures 7–9 confirm that 1200 ℃ is the suitable firing temperature, where shrinkage, densification, and pore reduction are balanced, while further heating to 1300 ℃ may introduce microstructural defects that reduce the benefit of additional firing.
3.1.7 Modulus of rupture of specimens
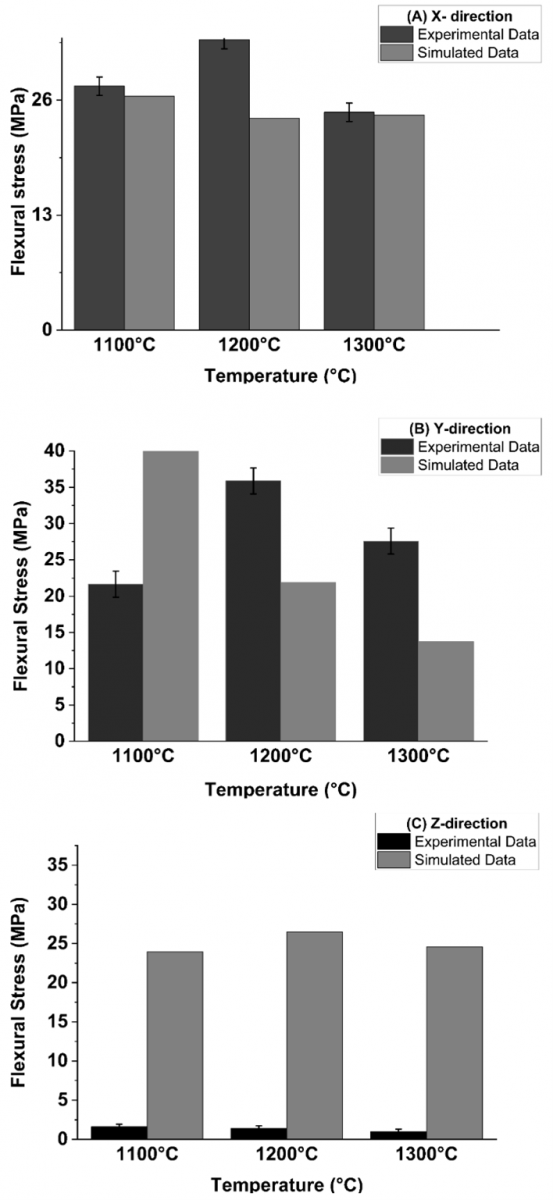
The MOR values of the sintered ceramic tiles at different temperatures are compared in Figure 10 for three different loading configurations (A–C). These three orientations were selected to assess the directional dependence of flexural strength and to check whether the pressing direction and microstructural arrangement influenced the mechanical behavior of the fired tiles. Testing in three orientations provides a more representative assessment of the mechanical performance than testing in a single direction. MOR was measured in these three orientations to evaluate whether the pressing direction induced directional differences in flexural strength. MOR values exhibit an upward trend from the sample at 1100 ℃ (21.65 MPa, 27.58 MPa, 1.61 MPa) to sample at 1200 ℃ (32.84 MPa, 35.88 MPa, 1.41 MPa), followed by a reduction to sample at 1300 ℃ (24.63 MPa, 27.58 MPa, 0.99 MPa) in directions A, B and C, respectively. As indicated by the statistical annotations in Figure 10, the differences among the three loading orientations were not always statistically significant. This confirms that the loading orientation influenced MOR in some cases, most likely due to pressing-induced anisotropy, pore distribution, and defect orientation within the ceramic body. An elevated presence of the mullite phase is associated with enhanced flexural resistance in ceramic bodies. Bending strength is primarily governed by (i) porosity acting as a stress concentrator, (ii) the developed phase assemblage (mainly mullite, residual quartz and the glassy phase), which defines the load-bearing capacity and (iii) the firing temperature, which controls the degree of densification and defect generation [38].
The formation of pores in the tiles during firing acts as stress focal points that compromise the structural integrity of the sintered specimens, promoting localized stress accumulation and crack propagation. The lower MOR values at 1100 ℃ are thus attributed to poor intergranular bonding and stress transfer, which is in agreement with the SEM micrographs (Figure 7(a)) showing a porous and loosely consolidated network with poorly formed grain boundaries and residual pores preventing densification. This microstructure is associated with a higher porosity (~4.47%) and water absorption (~1.76%) (Figure 9). Further, 1200 ℃ gives the best sintering conditions for the ceramic body leading to a more homogeneous packing of grains and a moderately low porosity (~0.10%). The improvement of grain bonding and reduction of flaws permit the transmission of stresses more effectively, thus enhancing the MOR. However, the excessive grain growth and coalescence at 1300 ℃ result in the generation of coarse open porosity and microstructural defects, as shown in the SEM images (Figure 7(c)). This excessive grain growth and coalescence increase both the apparent porosity (~0.24%) and water absorption (~0.09%). The reduction in MOR is largely attributed to these microstructural modifications, which promote stress accumulation near pore boundaries while compromising the overall strength of the ceramic body. As a result, the highest flexural strength was recorded at 1200 ℃, where an optimal equilibrium between matrix consolidation and residual porosity was successfully established [33].
3.2 Finite element analysis results
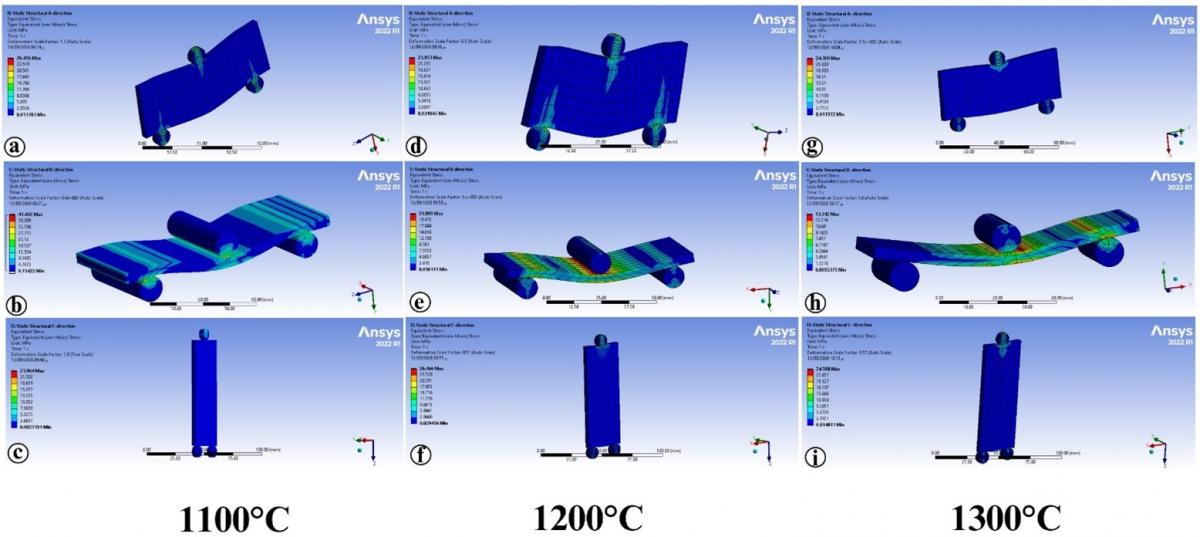
The mechanical response of the ceramic tile specimens under flexural loading was evaluated using FEA. Figure 11 presents the equivalent flexural stress and strain distributions for the X-, Y-, and Z-loading orientations using a mesh size of 2 mm, while Table 6 summarises the corresponding simulated flexural stress values. As shown in Figure 11, the stress and strain contours were not uniformly distributed over the specimen surface. Under three-point bending, the highest stress and strain concentrations developed around the central loading region and extended along the mid-span of the tile. The upper surface directly below the loading roller was predominantly under compression, while the opposite lower surface was under tensile bending stress, where crack initiation would be more likely in a brittle ceramic material. The magnitudes of the stress and strain decreased gradually from the central loading region towards the support points and the free ends of the specimen. The X- and Y-direction models showed relatively smooth and approximately symmetrical contour patterns, indicating a predominantly bending controlled response. In contrast, the Z-direction model showed a more localised distribution around the loading and support contact regions as the load acted through the tile thickness, where the stiffness was substantially lower. Therefore, the differences in the contour patterns among the three orientations demonstrate the directional dependence of the tile response and support the use of an orthotropic material model.
The experimental data of flexural stress and the results of the FEA are compared in Figure 12. The correlation between the measured values and numerical simulations is summarized in Table 7. The comparative analysis reveals acceptable alignment along the X-direction across all sintering temperatures, whereas more pronounced divergences emerged in the Y and Z-directions. Notably, the Y-axis displayed a substantial variance at 1100 ℃ (92%), which moderated to 39% at 1200 ℃ before rising again to 50% at 1300 ℃. The Z-direction differences were much higher (1388% to 2384%). These very large relative errors are partly amplified by the very low experimental flexural stress values (0.99–1.61 MPa), which appear in the denominator of the relative-error calculation. There are various reasons for the differences. First, the FEA model represents the ceramic tile as a homogeneous and continuous orthotropic material, whereas fired porcelain ceramics have a heterogeneous microstructure containing crystalline phases, glassy phases, residual pores, and local microstructural variations. Earlier research has established that the elastic and mechanical performance of porcelain stoneware is heavily governed by its microstructural features, void content, bulk density, as well as the proportion and morphology of mullite phases. Specifically, porosity directly governs Young’s modulus and flexural response, whereas an anisotropic pore distribution along the tile cross-section induces spatial gradients in elastic behavior that cannot be fully captured by a conventional homogeneous continuum framework [2, 31].
Table 6. Results of the flexural stress finite element analysis (FEA) simulation of ceramic tiles
|
Output (MPa) |
1100 ℃ |
1200 ℃ |
1300 ℃ |
|
Flexural stress (A) X-direction |
26.46 MPa |
23.95 MPa |
24.31 MPa |
|
Flexural stress (B) Y-direction |
41.49 MPa |
21.89 MPa |
13.74 MPa |
|
Flexural stress (C) Z-direction |
23.96 MPa |
26.47 MPa |
24.59 MPa |
Figure 11. Finite element analysis (FEA)-predicted flexural stress distributions of ceramic tiles fired at 1100, 1200, and 1300 ℃ under different loading orientations. Subfigures (a–c), (d–f), and (g–i) correspond to firing temperatures of 1100, 1200, and 1300°C, respectively; (a, d, g) represent the X-direction, (b, e, h) the Y-direction, and (c, f, i) the Z-direction
Table 7. Quantitative comparison between experimental results and finite element analysis (FEA) numerical predictions
|
Temperatures |
Flexural Stress- Direction (MPa) |
Experimental Data |
Simulated Data |
Absolute Relative Error (%) |
|
1100 ℃ |
Flexural stress (A) X- direction |
27.58 |
26.46 |
4% |
|
Flexural stress (B) Y- direction |
21.65 |
41.49 |
92% |
|
|
Flexural stress (C) Z- direction |
1.61 |
23.96 |
1388% |
|
|
1200 ℃ |
Flexural stress (A) X- direction |
32.84 |
23.95 |
27% |
|
Flexural stress (B) Y- direction |
35.88 |
21.89 |
39% |
|
|
Flexural stress (C) Z- direction |
1.41 |
26.47 |
1777% |
|
|
1300 ℃ |
Flexural stress (A) X- direction |
24.63 |
24.31 |
1% |
|
Flexural stress (B) Y- direction |
27.58 |
13.74 |
50% |
|
|
Flexural stress (C) Z- direction |
0.99 |
24.59 |
2384% |
Note: Absolute relative error was determined as ǀExperimental-Simulatedǀ /Experimental ˟ 100. Absolute values were employed to give uniform magnitudes of error and to prevent confusion associated with positive and negative signs.
Second, the experimental flexural response of brittle ceramic materials is highly sensitive to local defects and stress concentrations. Pores, inclusions, microstructural irregularities, surface damage, and machining defects may act as fracture-initiation sites and can reduce the experimentally measured flexural strength. Such defects are not explicitly represented in the present idealized FEA model, which assumes a defect-free continuum material with uniform properties. Fractographic investigations of porcelain materials have shown that pores, inclusions, microstructural flaws, and specimen-preparation damage can control the location and strength of fracture [39]. Third, differences between the experimental and numerical results may arise from the idealized boundary and loading conditions adopted in the FEA model. The numerical model assumes ideal support and loading conditions, whereas the experimental three-point bending test involves actual roller–specimen contact, local deformation, and possible small variations in specimen positioning. For three-point bending, the effect of shear and local deformation becomes more important when the span to depth ratio is relatively small and can influence the measured flexural response [40]. Fourth, the accurate representation of the direction dependent stiffness response by an orthotropic continuum model depends on the determination of the orientation dependent elastic constants, i.e., the Young’s moduli, the shear moduli and the Poisson’s ratios. In this investigation, Poisson’s ratio values were derived from published literature instead of direct experimental characterisation, whereas the shear moduli were computed using the assumed Poisson’s ratios alongside the respective Young’s moduli. Therefore, uncertainties in the assumed Poisson’s ratios and the resulting shear moduli may affect the predicted deformation and stress distribution, particularly for loading orientations involving significant shear deformation.
Finally, the particularly large discrepancies observed in the Z-direction may be associated with the through-thickness loading configuration, where the response is more sensitive to the lower through-thickness stiffness, local contact effects, shear deformation, and possible variations in pore distribution across the tile thickness. This interpretation is in agreement with previous results that porcelain stoneware can show an inhomogeneous distribution of the residual porosity along its thickness, with the consequent spatial variability of the elastic properties [31]. Therefore, the differences between the experimental and FEA results should not be attributed to a single factor but rather to the combined effects of microstructural heterogeneity, porosity and defects, experimental contact and boundary conditions, shear and local deformation, and uncertainties in the assumed orthotropic material parameters. The comparatively smaller discrepancies in the X-direction indicate that the present model provides a closer numerical representation of the experimental response for this loading orientation. However, the larger discrepancies in the Y- and particularly Z-directions indicate that additional microstructural and experimental parameters would be required for accurate quantitative prediction of flexural failure in these orientations.
Statistical analysis using one-way ANOVA was performed only on the experimental flexural stress data because these values were obtained from replicate specimens and are presented as mean ± standard deviation. In contrast, each FEA result represents a single deterministic numerical result for a specific firing temperature and material orientation. Therefore, statistical significance testing did not apply to the simulated values, which were included solely for numerical comparison and evaluation of the numerical model.
Experimental data confirm the importance of the sintering regime on the physical properties (bulk density, water absorption, and shrinkage) and the flexural modulus of elasticity in Iraqi porcelanite-modified ceramic bodies. Thermal processing at 1200 ℃ allowed the formation of liquid phase and structural compaction, resulting in improved mechanical properties over 1100 ℃. The highest mechanical integrity was observed at 1200 ℃ (MOR 35.88 MPa in the Y-direction). Conversely, an increase in temperature to 1300 ℃ resulted in microstructural deterioration by over-firing, internal pore expansion, and bloating effects, which reduced the overall mechanical response. Thus, the optimal sintering temperature for this composite formulation was 1200 ℃. The XRD spectra showed that the major crystalline phases are mullite and quartz. Microstructure analysis by SEM showed that the distribution of voids and the degree of densification are significant factors controlling the mechanical strength. FEA results exhibited reasonable agreement with the experimental results along the X-axis, with relative errors between 1% and 27%, but the difference was more significant along the Y-axis (39% to 92%). Considerably higher discrepancies were recorded in the Z-direction (1388% to 2384%), highlighting the constraints of the present numerical framework in predicting through-thickness flexural response. Therefore, the FEA model is considered useful for qualitative stress-distribution analysis and interpretation of flexural behaviour, but it should not be regarded as a fully validated predictive model for all loading orientations. Further refinement incorporating experimentally determined anisotropic properties, improved representation of microstructural features, realistic boundary and contact conditions, and an appropriate fracture-based failure criterion may improve the quantitative accuracy of the numerical model.
The authors are grateful for the laboratory facilities provided by the School of Materials and Mineral Resources Engineering, Universiti Sains Malaysia. Thanks to Dr. Fatah for his help in preparing the paper. We are also grateful to the Ministry of Industry and Minerals, Iraq (General Company for Geological Survey and Mining, Baghdad) for providing waste porcelanite powder. All the authors acknowledge the technical help of the National Center for Construction Laboratories (Baghdad Central Laboratory). Special thanks to Dr. Ahmed Hafedh Mohammed Mohammed (Department of Materials Engineering, Mustansiriyah University, Baghdad, Iraq) for his valuable comments on the application of waste porcelanite powder in sustainable construction.
[1] Kareem, E.T., Chafat, A.H., Al-Da’amy, M.A. (2023). Iraqi porcelanite rocks for efficient removal of safranin dye from aqueous solution. Baghdad Science Journal, 20(2): 15. http://doi.org/10.21123/bsj.2022.6921
[2] Martín-Márquez, J., Rincón, J.M., Romero, M. (2010). Effect of microstructure on mechanical properties of porcelain stoneware. Journal of the European Ceramic Society, 30(15): 3063-3069. http://doi.org/10.1016/j.jeurceramsoc.2010.07.015
[3] Lecomte-Nana, G.L., Bonnet, J.P., Blanchart, P. (2011). Investigation of the sintering mechanisms of kaolin-muscovite. Applied Clay Science, 51(4): 445-451. https://doi.org/10.1016/j.clay.2011.01.007
[4] Wiśniewska, K., Pichór, W., Kłosek-Wawrzyn, E. (2021). Influence of firing temperature on phase composition and colour properties of ceramic tile bodies. Materials, 14(21): 6380. https://doi.org/10.3390/ma14216380
[5] Gültekin, E.E. (2018). The effects of heating rate and sintering temperature on the strength, firing shrinkage, and bulk density of porcelain tiles. Journal of the Australian Ceramic Society, 54: 39-46. https://doi.org/10.1007/s41779-017-0124-9
[6] Kamonchaivanich, K., Kuboyama, K., Ougizawa, T. (2019). Effect of elastic modulus and position of polyurea coating on flexural strength of coated ceramic tiles by experiments and finite element analysis. Journal of Coatings Technology and Research, 16(4): 1201-1211. https://doi.org/10.1007/s11998-018-00170-6
[7] Ito, C., Osada, T., Ozaki, S. (2022). Finite element analysis of fracture behavior in ceramics: Competition between artificial notch and internal defects under three-point bending. Ceramics International, 48(24): 36460-36468. https://doi.org/10.1016/j.ceramint.2022.08.206
[8] Wang, Z.G., Li, Z.D., Xiong, W. (2019). Numerical study on three-point bending behavior of honeycomb sandwich with ceramic tile. Composites Part B: Engineering, 167: 63-70. https://doi.org/10.1016/j.compositesb.2018.11.108
[9] Defez, B., Moncho-Santonja, M., Aparisi-Navarro, S., Peris-Fajarnés, G. (2023). Parametric study of the correlation between location and size of superficial cracks in the deflection of traditional tiles based on finite element analysis. Boletín de la Sociedad Española de Cerámica y Vidrio, 62: 368-378. https://doi.org/10.1016/j.bsecv.2022.12.003
[10] Kalaf, I.A., Nalanakumar, P.R., Shariff, K.A., Mohammed, A.H.M. (2024). Effect of Iraqi porcelanite composition on the properties of ceramic tiles: Experimental and simulation works. Journal of Physics: Conference Series, 2907(1): 012023. https://doi.org/10.1088/1742-6596/2907/1/012023
[11] Alogaidi, I.A.K., Mohammed, A.H.M., Shariff, K.A., Mohamad, H., Mukhtar, M.A.F.M. (2025). Effects of sustainable Iraqi porcelanite waste powder on the properties of commercial porcelain tiles. Revue des Composites et des Matériaux Avancés-Journal of Composite and Advanced Materials, 35(6): 1189-1197. https://doi.org/10.18280/rcma.350618
[12] Contartesi, F., Melchiades, F.G., Boschi, A.O. (2019). Anticipated overfiring in porcelain tiles: Effects of the firing cycle and green bulk density. Boletín de la Sociedad Española de Cerámica y Vidrio, 58: 69-76. https://doi.org/10.1016/j.bsecv.2018.07.001
[13] Ibrahim, F.A., Kadhim, Z.D., Abdulrazzaq, M.A., Aydi, A. (2025). Effect of Al₂O₃ particle size on mechanical properties of Al-12%Si alloy via taguchi method. Revue des Composites et des Matériaux Avancés-Journal of Composite and Advanced Materials, 35(4): 601-608. https://doi.org/10.18280/rcma.350401
[14] Khalil, A.M.E., Egiza, M., Diab, M.R., Ali, E., Xie, D., Zhang, S.W. (2026). Recycling industrial waste into sustainable high-temperature ceramics: A review of materials, processing, and circular economy strategies. Results in Engineering, 30: 109933. https://doi.org/10.1016/j.rineng.2026.109933
[15] International Organization for Standardization (ISO). (2018). ISO 10545-2:2018, Ceramic tiles—Part 2: Determination of dimensions and surface quality (2nd ed.). Geneva, Switzerland: International Organization for Standardization. https://www.iso.org/standard/72246.html?utm_source=chatgpt.com.
[16] ASTM International. (2018). ASTM C326-09: Standard test method for drying and firing shrinkages of ceramic whiteware clays. ASTM International, West Conshohocken, PA.
[17] International Organization for Standardization (ISO). (2018). ISO 10545-3:2018, Ceramic tiles—Part 3: Determination of water absorption, apparent porosity, apparent relative density and bulk density (2nd ed.). Geneva, Switzerland: International Organization for Standardization. https://www.iso.org/standard/68006.html?utm_source=chatgpt.com.
[18] Chen, Y.L., Zhang, Y.M., Chen, T.J., Liu, T., Huang, J. (2013). Preparation and characterisation of red porcelain tiles with hematite tailings. Construction and Building Materials, 38: 1083-1088. https://doi.org/10.1016/j.conbuildmat.2012.06.056
[19] Tarhan, B. (2019). Usage of fired wall tile wastes into fireclay sanitaryware products. Journal of the Australian Ceramic Society, 55: 737-746. https://doi.org/10.1007/s41779-018-0285-1
[20] International Organization for Standardization (ISO). (2019). ISO 10545-4:2019, Ceramic tiles—Part 4: Determination of modulus of rupture and breaking strength (4th ed.). Geneva, Switzerland: International Organization for Standardization. https://www.iso.org/standard/69619.html?utm_source=chatgpt.com.
[21] ASTM International. (2023). ASTM C674-13: Standard test methods for flexural properties of ceramic whiteware materials. ASTM International, West Conshohocken, PA.
[22] Lamon, J. (2012). Properties and characteristics of SiC and SiC/SiC Composites. Comprehensive Nuclear Materials, 2: 323-338. https://doi.org/10.1016/B978-0-08-056033-5.00022-7
[23] Štubňa, I., Húlan, T., Ondruška, J., Trník, A. (2021). An influence of the firing temperature on elastic constants of alumina porcelain. AIP Conference Proceedings, 2429: 020039. https://doi.org/10.1063/5.0069597
[24] Marketou, A.K., Kouzeli, K., Facorellis, Y. (2019). Colourful earth: Iron-containing pigments from the Hellenistic pigment production site of the ancient agora of Kos (Greece). Journal of Archaeological Science: Reports, 26: 101843. https://doi.org/10.1016/j.jasrep.2019.05.008
[25] Dong, W.X., Bao, Q.F., Zhao, J., Zhao, T.G., Liu, K., Hu, Z.W. (2017). Preparation of porcelain building tiles using “K₂O-Na₂O” feldspar flux as a modifier agent of low-temperature firing. Journal of the Ceramic Society of Japan, 125(9): 690-694. https://doi.org/10.2109/jcersj2.16327
[26] Melhem, M. (2014). The effect of calcite additives on clay for ceramic tile manufactory. Proceedings of the Qualicer, Castellón, Spain.
[27] Hanapi, M.I., Ahmad, S., Taib, H., et al. (2017). Influence of alkali-resistant (AR) fibreglass in porcelain clay for manufacturing vitrified clay pipes. Journal of Physics: Conference Series, 914(1): 012020. https://doi.org/10.1088/1742-6596/914/1/012020
[28] Sánchez-Soto, P.J., Eliche-Quesada, D., Martínez-Martínez, S., Pérez-Villarejo, L., Garzón, E. (2022). Study of a waste kaolin as raw material for mullite ceramics and mullite refractories by reaction sintering. Materials, 15(2): 583. https://doi.org/10.3390/ma15020583
[29] Amigó, J.M., Serrano, F.J., Kojdecki, M.A., et al. (2005). X-ray diffraction microstructure analysis of mullite, quartz and corundum in porcelain insulators. Journal of the European Ceramic Society, 25(9): 1479-1486. https://doi.org/10.1016/j.jeurceramsoc.2004.05.019
[30] Chen, Y.F., Wang, M.C., Hon, M.H. (2004). Phase transformation and growth of mullite in kaolin ceramics. Journal of the European Ceramic Society, 24(8): 2389-2397. https://doi.org/10.1016/S0955-2219(03)00631-9
[31] Cannillo, V., Esposito, L., Rambaldi, E., Sola, A., Tucci, A. (2009). Effect of porosity on the elastic properties of porcelainized stoneware tiles by a multi-layered model. Ceramics International, 35(1): 205-211. https://doi.org/10.1016/j.ceramint.2007.10.015
[32] Salem, A., Jazayeri, S.H., Rastelli, E., Timellini, G. (2009). Dilatometric study of shrinkage during the sintering process for porcelain stoneware body in the presence of nepheline syenite. Journal of Materials Processing Technology, 209(3): 1240-1246. https://doi.org/10.1016/j.jmatprotec.2008.03.033
[33] Rahaman, M.N. (2017). Ceramic Processing and Sintering. CRC Press, Boca Raton. https://doi.org/10.1201/9781315274126
[34] Candeias, C., Santos, I., Rocha, F. (2025). Characterisation and suitability for ceramics production of clays from Bustos, Portugal. Minerals, 15(5): 503. https://doi.org/10.3390/min15050503
[35] Hsu, C.T., Chou, C.J., Huang, T.S., Hung, P.M., Chen, C.N. (2017). The effect of firing shrinkage ratio of ceramics on thickness. Journal of Interdisciplinary Mathematics, 20(3): 937-950. https://doi.org/10.1080/09720502.2017.1358892
[36] Orts, M.J., Escardino, A., Amorós, J.L., Negre, F. (1993). Microstructural changes during the firing of stoneware floor tiles. Applied Clay Science, 8(2-3): 193-205. https://doi.org/10.1016/0169-1317(93)90037-2
[37] Martínez-Martínez, S., Pérez-Villarejo, L., Garzón, E., Sánchez-Soto, P.J. (2023). Influence of firing temperature on the ceramic properties of illite-chlorite-calcitic clays. Ceramics International, 49(14): 24541-24557. https://doi.org/10.1016/j.ceramint.2022.11.077
[38] Durgun, R., Abalı, S. (2022). Effect of calcination and sintering temperature on porosity and microstructure of porcelain tiles. Materials Testing, 64(3): 391-400. https://doi.org/10.1515/mt-2021-2069
[39] Quinn, G.D., Hoffman, K., Quinn, J.B. (2012). Strength and fracture origins of a feldspathic porcelain. Dental Materials, 28(5): 502-511. https://doi.org/10.1016/j.dental.2011.12.005
[40] Mujika, F. (2007). On the effect of shear and local deformation in three-point bending tests. Polymer Testing, 26(7): 869-877. https://doi.org/10.1016/j.polymertesting.2007.06.002