
Kunyaphat Thanakunwutthirot | Ittipon Meepon | Siriphat Maneekeaw | Sirisak Kongsomsaksakul | Piyarat Paoleng*
© 2026 The authors. This article is published by IIETA and is licensed under the CC BY 4.0 license (http://creativecommons.org/licenses/by/4.0/).
OPEN ACCESS
Mangosteen peel accumulates in large volumes in Thai fruit-growing communities and is mostly landfilled or burned in the open. This work reports a first laboratory evaluation of that residue as a lignocellulosic feedstock for single-layer panels bonded with urea-formaldehyde (UF) resin. Sieved peel particles were separated into three fractions, G1 (2.36-4.75 mm), G2 (1.18-2.36 mm) and G3 (below 1.18 mm), and each fraction was bonded at UF loadings of 8%, 10% and 12% of the oven-dry particle mass, giving nine panel conditions of 300 × 300 × 10 mm at a target density of 610 kg/m³. Only one panel was produced per condition, so no replication was available and the values reported describe individual panels rather than statistically confirmed effects. Thickness swelling (TS), water absorption (WA), modulus of rupture (MOR) and modulus of elasticity (MOE) followed Japanese Industrial Standard (JIS) A 5908, and bonded interfaces were imaged by scanning electron microscopy (SEM). Raising the UF loading from 8% to 12% lowered TS in every fraction by roughly 39% for G1, 33% for G2 and 17% for G3, and lowered WA by about 7%, 26% and 13%, respectively. MOR responded far more strongly than MOE: between 8% and 12% UF, it rose by approximately 213% (G1), 301% (G2) and 317% (G3), reaching 4.67 MPa for G3 at 12% UF, whereas MOE gained only 34-58% and stayed below 430 MPa. All panels therefore remained well below the 8 MPa and 2000 MPa required for JIS A 5908 Type 8. SEM showed resin bridges together with unfilled voids consistent with that limited stiffness. Mangosteen peel alone is thus unsuitable for load-bearing panels, and fibrous reinforcement combined with a replicated experimental design is the necessary next step.
agricultural residue valorisation, dimensional stability, lignocellulosic biomass, mangosteen peel, non-structural particleboard, urea-formaldehyde resin
Thailand grows mangosteen on a commercial scale, and the fruit is widely known as the queen of tropical fruits, with production concentrated in the eastern and southern provinces. Output reported by the Department of Agricultural Extension for 2024 reached about 321,696 tons, of which the eastern region contributed 172,804 tons, the southern region 148,018 tons and the remaining regions 847 tons. Only about 25-30% of each fruit is edible pulp, and domestic consumption accounts for roughly 9% of the fresh crop, or some 28,952 tons. Once the pulp has been eaten, between 20,000 and 21,000 tons of pericarp are left each year and are usually sent to landfill. A fraction is converted into compressed charcoal briquettes, but burning agricultural residues in the open releases fine particulate matter smaller than 2.5 µm (PM2.5) [1], which adds to the seasonal air-quality problems experienced across the country. Diverting the pericarp into a durable panel product therefore addresses a disposal problem and an emission problem at the same time.
The pericarp is a lignocellulosic material with a comparatively stiff cell structure, which is expected to help particles retain their shape and to favour mechanical interlocking during mat formation. A reported composition of 26.22% cellulose, 15.39% hemicellulose and 48.52% lignin [2] places it within the range handled by conventional panel technology. Chemistry alone, however, does not decide whether a biomass is workable: particle geometry, surface texture, seasonal availability and the affinity of the surface for the resin all matter. Because the residue is abundant and geographically concentrated in Thailand, it is a reasonable candidate for value-added panel manufacture.
Particleboard remains one of the highest-volume wood-based panels, used mainly in furniture and non-load-bearing interior fittings. Food and Agriculture Organization of the United Nations (FAO) figures place global output above 116,000,000 m³ in 2023, with the European market close to 44,000,000 m³ in the same year [3, 4]. A panel consists essentially of particles and a binder, with additives introduced only when a particular property or process demands them. Density, thickness swelling (TS) and the two flexural indices, modulus of rupture (MOR) and modulus of elasticity (MOE), are the properties normally used to judge panel quality [5].
Although wood residues and chips remain the standard furnish, a wide range of agricultural by-products has been trialled, among them sawdust, rice straw, nipah palm, sunflower bark, sugarcane bagasse, coconut shell, bamboo, breadfruit leaves and nut shells such as peanut and macadamia [5-14]. Collectively, these studies confirm that lignocellulosic residues can substitute for wood, although the property level achieved varies widely with the species and the process.
Synthetic binders dominate industrial practice. Urea-formaldehyde (UF) and phenol-formaldehyde (PF) are the two most common, while polymeric methylene diphenyl diisocyanate (pMDI) is used where moisture resistance is critical [14, 15]. UF was selected here for its low cost, wide availability and straightforward processing, and is normally dosed at 7-13% of the dry furnish mass. Higher dosages are known to lower water uptake [5, 16, 17] and to improve strength [18], but resin is the most expensive input in panel production, so raising the dosage carries a direct cost penalty. A higher UF loading may also increase formaldehyde and other volatile organic emissions. The dosage therefore has to be judged against cost and emissions as well as against panel performance, rather than simply maximized.
The present study examines mangosteen pericarp across three particle grades combined with three UF dosages. Comminuted furnish is normally dried before blending; published practice suggests oven drying at 70-80 ℃ for about 12 h to bring moisture below 5% [19, 20] prior to UF blending. Reported blending conditions are of the order of 12 rev/min for 5 min [21], followed by cold pre-pressing at 0.5 MPa for 5 min at ambient temperature [21]. Hot pressing is then carried out between 160 and 180 ℃ at about 2.5 MPa, although pressures as high as 30 MPa have been used [7], depending on the furnish and the panel thickness.
Press factor, the pressing time per unit thickness in s/mm, governs resin cure, the density profile and the residual moisture of the panel; values between 20 and 90 s/mm appear in the literature [15, 22, 23]. Panel density is commonly between 600 and 800 kg/m³ [24], while 520 kg/m³ has been proposed as suitable for furniture applications [25]. Bending tests are usually run on a universal testing machine at crosshead rates of 1-10 mm/min, selected according to specimen thickness and the governing standard [26-29]. For Type 8 boards, Japanese Industrial Standard (JIS) A 5908 [28] sets minimum values of 8 MPa for MOR and 2000 MPa for MOE.
The gap addressed here becomes clearer when the two variables are separated in the existing literature. Work on rice husk [17], coffee husk [16], and tomato stalk [18] varied binder dosage while holding a single particle grade, and reported the expected reduction in water uptake without resolving how that effect depends on particle geometry. Conversely, studies on macadamia nutshell [14], coconut shell and husk [10] and palm prunings [24] compared furnish types or particle grades at a fixed resin dosage. Where both factors have been varied together, the furnish has been a fibrous residue such as sweet corn stalk [20] or bark [23], whose aspect ratio differs fundamentally from the brittle, granular particles obtained from mangosteen pericarp. No study located by the authors reports the two factors together for this residue, and it is precisely for a brittle furnish of this kind that the balance between specific surface area and resin coverage is expected to behave differently from fibrous furnishes. The objective of this study was therefore to evaluate how particle grade and UF dosage affect the physical and flexural behaviour of mangosteen peel particleboard, and to establish whether the residue merits further development as a non-structural panel furnish.
2.1 Particle preparation
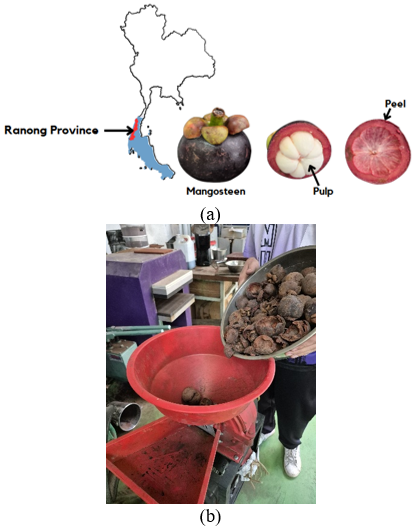
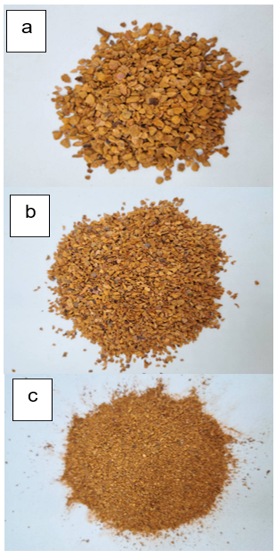
Pericarp waste was collected from mangosteen growers in Kra Buri District, Ranong Province, in southern Thailand (Figure 1). The moisture content of the incoming material, measured with a microwave moisture analyser, was 173.2% on a dry basis. Comminution was carried out in a knife-ring flaker. This differs from the hammer-type crushers usually applied to woody shell residues, and the choice was governed by the hardness of the feedstock: mangosteen pericarp is a comparatively soft tissue that a hammer mill tends to reduce to dust, whereas the cutting action of a ring flaker yields discrete particles in the size range required for panel production. The flaked material was screened on American Society for Testing and Materials (ASTM) sieves No. 4, No. 8 and No. 16, and three fractions were retained, as shown in Figure 2: coarse particles held on No. 8 (G1, 2.36-4.75 mm), medium particles held on No. 16 (G2, 1.18-2.36 mm) and fine particles passing No. 16 (G3, below 1.18 mm). Oversize material held on No. 4 was returned to the flaker for further comminution. Screening was continued until sufficient material of each fraction had been accumulated for the panel schedule. Shaking time, amplitude and the mass charged per screening batch were not treated as controlled variables and were not recorded, since the fraction boundaries are fixed by the sieve apertures rather than by the duration of screening, provided each charge is screened to completion. Particles produced by a knife-ring flaker are plate-like rather than fibrous; shape factor and aspect ratio were not measured in this study, and this is acknowledged as a limitation in Section 3.4. The screened fractions were not held in intermediate storage: once the required quantity of a fraction had been obtained, it passed directly to the drying and resination stages described in Section 2.2.
Figure 1. (a) Mangosteen from Ranong Province, (b) mangosteen peel was blended on a knife-ring flaker
Figure 2. Mangosteen peel particles of different size groups: (a) Group 1 (G1), 2.36–4.75 mm; (b) Group 2 (G2), 1.18–2.36 mm; and (c) Group 3 (G3), < 1.18 mm
2.2 Particleboard manufacturing
Screened particles were oven-dried a second time at 80 ± 2 ℃ until the moisture content fell below 5%, immediately before resination. Commercial UF resin for wood-based panels (UNICORP UP-H960, Thailand), whose properties are listed in Table 1, was applied at 8%, 10% and 12% of the oven-dry particle mass. The resin was used as supplied, with no hardener added to the furnish; the 2% ammonium chloride quoted in Table 1 relates solely to the gel-time determination carried out on the resin itself, and the accompanying note, that gel time exceeded 3 h without hardener, therefore describes the resin in the condition in which it was used here. For each panel, the weighed particles were charged into a rotating drum blender, and the resin was atomized onto the tumbling furnish with a paint spray gun while the drum was running. Spraying onto moving particles was adopted in preference to pouring because it distributes a low resin dosage more evenly over a large specific surface area. Blending continued until the resin was judged by visual inspection to be uniformly distributed; no fixed blending time or drum speed was imposed, and this is reported as carried out rather than as a controlled parameter. The resinated furnish was hand-formed into a 300 × 300 mm steel forming frame seated on a heat-distribution platen and lined with release fabric, with a second release fabric and platen placed above the mat before the caul plate was applied. A 10 mm steel spacer bar acted as a mechanical thickness stop, giving panels of 300 × 300 × 10 mm at a target density of 610 kg/m³. Hot pressing was carried out in a laboratory hydraulic press brought to working temperature over 3 h beforehand, at 160-165 ℃ under a specific pressure of 13 N/mm² with a press factor of 75 s/mm, in a single stage and without turning the panel. On removal, the panels were demoulded and left to cool in free air at ambient temperature, without any applied load, until set. Nine panels were produced in total, one for each combination of particle grade and UF dosage; no replicate panels were made. The study was therefore designed as an initial feasibility screening rather than as a replicated factorial experiment, and the consequences of that choice are set out in Section 3.4.
Table 1. The properties of urea formaldehyde resin [30]
|
Type |
Urea Formaldehyde |
|
pH |
9.02 |
|
Viscosity (centipoises) |
130.00 |
|
Non-volatile content (%) |
47.99 |
|
Gel time (min: sec) at 100 ℃ |
|
|
(mix with ammonium chloride 2% based on dry resin) |
39.00 |
|
Specific Gravity (at 31 ℃) |
1.182 |
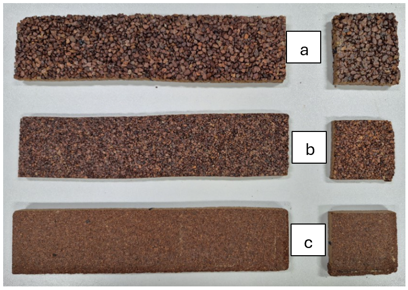
Pressed panels (Figure 3) were conditioned at 25 ± 2 ℃ and 65 ± 5% relative humidity for seven days before any specimen was cut. Specimens were then machined to the dimensions specified in JIS A 5908 [28] (Figure 4). Physical characterisation covered TS and water absorption (WA); flexural characterisation covered MOR and MOE, tested as shown in Figure 5. Specimens for each property were cut from the corresponding panel in accordance with that standard, and every value reported in Section 3 is the mean of the specimens taken from a single panel. The number of specimens cut per panel was not entered in the laboratory record and cannot now be reconstructed; this is stated openly here and is listed among the limitations in Section 3.4. It does not alter the identity of the experimental unit, which remains the panel, because only one panel was produced for each condition.
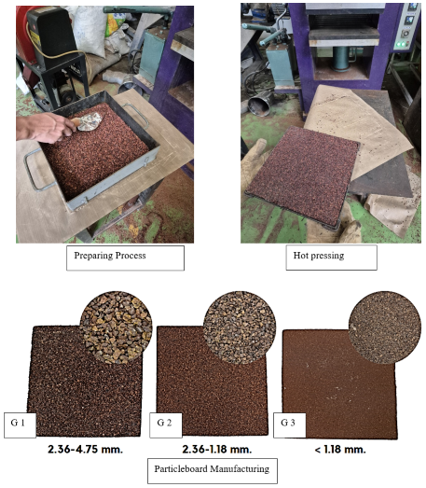
Figure 3. Preparation process for particleboard manufacturing with (a) Group 1 (G1) particle size, 2.36–4.75 mm, (b) Group 2 (G2) particle size, 1.18–2.36 mm, and (c) Group 3 (G3) particle size, D < 1.18 mm
Figure 4. Samples for bending test and TS test: (a) Group 1 (G1) particle size, 2.36–4.75 mm, (b) Group 2 (G2) particle size, 1.18–2.36 mm, and (c) Group 3 (G3) particle size, D < 1.18 mm
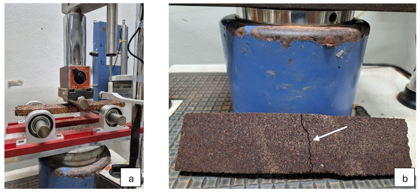
Figure 5. (a) Flexural test setup using third-point loading method (JIS-5908), (b) crack formation from third-point bending test
2.3 Properties of particleboard
Panel properties were determined following JIS A 5908:2022 [28], covering density, TS and WA for physical behaviour and MOR and MOE for flexural behaviour. All specimens were cut from the conditioned panels at the dimensions prescribed by that standard.
2.3.1 Physical properties
Specimen density was obtained as the ratio of mass to volume. Mass was recorded on a digital balance and volume was computed from the measured length, width, and thickness (Eq. (1)).
$\rho=\frac{m}{v}$ (1)
Specimens measuring 50 mm × 50 mm × 10 mm were immersed in water held at 24 ± 2 ℃ for 24 h. TS was derived from the change in thickness and WA from the change in mass, using Eqs. (2) and (3). TS is the standard indicator of moisture-induced dimensional instability in panel products.
$T S=\frac{\left(T_2-T_1\right)}{T_1} \times 100$ (2)
where, T1 denotes the average specimen thickness (mm) prior to immersion, and T2 the thickness (mm) after immersion.
$W A=\frac{\left(W_2-W_1\right)}{W_1} \times 100$ (3)
where, W1 is the weight before immersion, and W2 is the weight after immersion.
2.3.2 Mechanical properties
Flexural properties were measured in three point bending on specimens of 200 × 50 × 10 mm over a 150 mm span, at a crosshead rate of 10 mm/min [28]. Testing used a digitally controlled electromechanical frame (Digital Tritest, ELE International, UK) with a capacity of 50 kN. MOR and MOE were computed from Eqs. (4) and (5).
$M O R=\frac{3 P L}{2 b t^2}$ (4)
where, P is the maximum load (N), L is the span (mm), b is the average specimen width (mm), and t is the average specimen thickness (mm).
$\mathrm{MOE}=\frac{\mathrm{L}^3 \mathrm{~m}}{4 \mathrm{~b} \cdot \mathrm{t}^3}$ (5)
where, L is the span (mm), m is the slope of the load–deflection curve in the linear region, b is the specimen width (mm), and t is the specimen thickness (mm).
2.3.3 Scanning electron microscopy analysis
The panel microstructure was examined on a scanning electron microscope (FEI Quanta 450, Thermo Fisher Scientific, USA) at the Scientific Instrument and Technological Transfer Centre, Faculty of Applied Science, King Mongkut's University of Technology North Bangkok, Thailand. Micrographs were recorded at an accelerating voltage of 15 kV and a magnification of 1000×, with the scale bar displayed on each image, and were used to inspect particle surfaces, resin coverage, and the particle-resin interface.
3.1 Physical properties
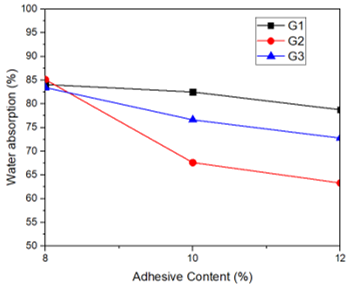
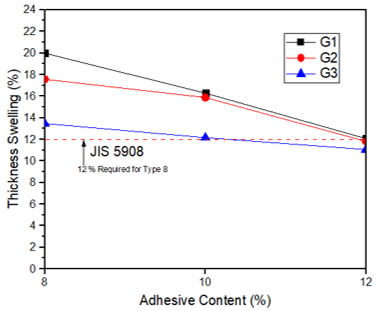
WA and TS for the nine panels are plotted in Figures 6 and 7; the fabricated panels had an average density of 610 kg/m³. Both properties improved as the UF dosage rose from 8% to 12%. WA fell from about 84.2% to 78.7% for G1, a reduction of roughly 7%; from 85.3% to 63.2% for G2, about 26%; and from 83.4% to 72.8% for G3, about 13%. TS moved in the same direction, decreasing from approximately 19.9% to 12.2% for G1, about 39%, from 17.5% to 11.8% for G2, about 33%, and from 13.4% to 11.1% for G3, about 17%. Comparable reductions with increasing binder dosage have been reported for tomato stalk [18], coffee husk [16] and rice husk [17] panels. The two size effects act in opposite directions. G2 absorbed less water than G3 consistently at the same dosage, which is consistent with the larger specific surface area of the finer fraction requiring more resin for equivalent coverage; where coverage is incomplete, exposed particle surfaces provide additional pathways for moisture. Dimensional stability, by contrast, was best for the finest fraction: G3 gave the lowest TS at every dosage, since smaller particles pack more closely and leave less void volume to accommodate swelling. At 12% UF, G2 and G3 satisfied the 12% thickness-swelling limit for JIS A 5908 Type 8 [28], whereas G1 remained marginally above it at approximately 12.2% and did not meet the requirement. Because a single panel was tested per condition, these differences are reported as observed trends and were not subjected to statistical testing.
Figure 6. Relationship between adhesive content and water absorption (WA) of G1, G2, and G3 specimens
Figure 7. Relationship between adhesive content and thickness swelling (TS) of G1, G2, and G3 specimens
3.2 Mechanical properties
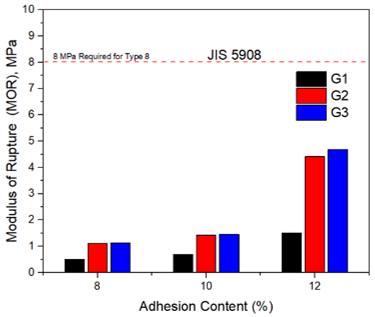
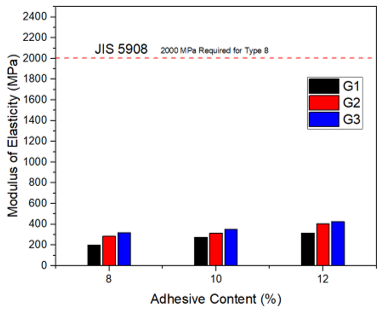
MOR and MOE at UF dosages of 8%, 10% and 12% are shown in Figures 8 and 9. Both indices rose with dosage, but the response of MOR was far stronger than that of MOE. Between 8% and 12% UF, MOR increased from about 0.48 to 1.50 MPa for G1, approximately 213%, from 1.10 to 4.41 MPa for G2, approximately 301%, and from 1.12 to 4.67 MPa for G3, approximately 317%. Most of that gain occurred between 10% and 12% UF, where MOR for G2 and G3 more than tripled, which suggests that resin coverage becomes adequate only towards the upper end of the dosage range examined. Particle size acted in the same direction: at 12% UF the finest fraction reached roughly three times the MOR of the coarsest one. MOE responded much less, rising from about 200 to 315 MPa for G1, approximately 58%, from 283 to 405 MPa for G2, approximately 43%, and from 318 to 425 MPa for G3, approximately 34%. No panel approached either Type 8 requirement of JIS A 5908 [28]: the highest MOR of 4.67 MPa reached 58% of the 8 MPa limit, and the highest MOE of 425 MPa only 21% of the 2000 MPa limit. The much smaller relative gain in stiffness indicates that additional resin improves the bonded contacts between particles without altering the compliance of the pericarp itself, so that increasing the binder alone cannot close the gap to the standard. Introducing a fibrous component such as wood chips, sawdust or rice straw is the more promising route to raising both strength and toughness. One factor that may have contributed to the low absolute values is the curing regime. The resin was used without a catalyst, and the gel-time determination on the same resin exceeded 3 h at 100 °C in the absence of ammonium chloride (Table 1). Pressing at 160-165 °C with a press factor of 75 s/mm in a single stage, without turning the panel, may therefore not have allowed the resin to cure fully through the thickness of the mat. This remains a hypothesis, since the degree of cure was not measured, but it is consistent with the residual voids and incompletely wetted particle surfaces observed in the micrographs, and it identifies catalysed curing and a longer press factor as the first process variables to examine in confirmatory work.
Figure 8. Modulus of rupture (MOR) of G1, G2, and G3 samples compared to JIS A 5908 standard [28]
Figure 9. Modulus of elasticity (MOE) of G1, G2, and G3 samples compared to JIS A 5908 standard [28]
3.3 Scanning electron microscopy analysis
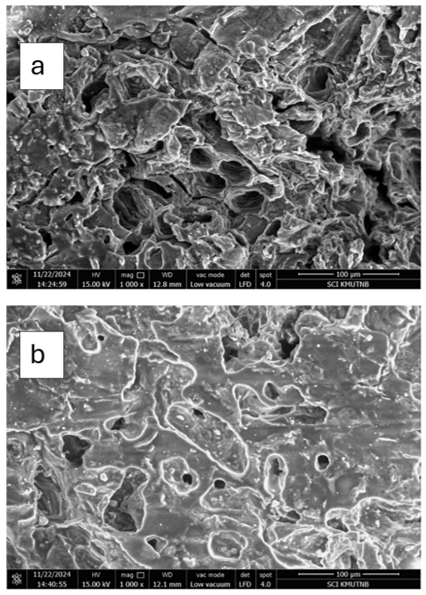
Micrographs of the raw furnish and the bonded panel are compared in Figure 10. Untreated pericarp particles present a rough, highly porous surface. After blending and pressing, resin is visible as continuous bridges spanning adjacent particles, which confirms that wetting and curing took place. Unfilled voids nevertheless remain between particles. These voids are consistent with the flexural results, since discontinuities of this kind interrupt stress transfer and reduce both load-bearing capacity and resistance to moisture ingress. More uniform resin distribution and more complete surface coverage would be expected to densify the bonded network and improve performance.
Figure 10. Scanning electron microscopy (SEM) images (1000×): (a) mangosteen peel and (b) particleboard after adhesive bonding
Taken together, these observations indicate that mangosteen pericarp can be consolidated into a coherent panel, but that the property level reached in this screening is limited. Further work should therefore target the formulation and the property set rather than the binder dosage alone.
3.4 Limitations of the study
Six limitations should be borne in mind when interpreting these results. First, one panel was manufactured for each combination of particle grade and UF dosage, so every reported value describes a single panel; the comparisons above are observed trends; they were not tested statistically, and no estimate of within-condition variability is available. Second, the property set was restricted to density, TS, WA, MOR and MOE under JIS A 5908 [28]. Internal bond strength and formaldehyde emission, both decisive for UF-bonded panels in service, fell outside the scope of this screening, as did durability under cyclic humidity. Third, the furnish was not characterised geometrically: particle shape distribution and aspect ratio were not measured, although both are known to influence mat formation and stress transfer. Fourth, the pericarp came from a single locality and a single harvest season, so variation between cultivars, maturity stages and drying histories was not assessed. Confirmatory work should adopt a replicated factorial design with at least three panels per condition, report means with standard deviations, apply analysis of variance, and include internal bond and emission testing before any application is proposed. A fifth constraint concerns the resin itself: the degree of cure was not determined, so the extent to which the uncatalysed resin had reacted at the press factor used cannot be quantified, and the curing regime remains a candidate explanation for the low flexural values rather than a demonstrated cause. Finally, the number of specimens cut from each panel was not recorded, so the reported means cannot be accompanied by a specimen count and the precision of each panel mean cannot be assessed. Taken together with the absence of replicate panels, this means that the present results establish direction and order of magnitude only. A confirmatory study should therefore record the specimen count for every property alongside the panel identifier from the outset, so that variability within a panel can be separated from variability between panels.
This study evaluated how mangosteen peel particle grade and UF dosage affect the physical and flexural behaviour of single-layer particleboard. The findings below rest on one panel per condition and should be read as observed trends rather than as statistically confirmed effects.
1. Water resistance was governed by particle grade as well as by dosage. The medium fraction G2 absorbed less water than the fine fraction G3 at every dosage, which is attributed to the greater specific surface area of the finer particles requiring more resin to achieve equivalent coverage.
2. Dimensional stability improved as the particles became finer and as the dosage increased. At 12% UF, G2 and G3 met the 12% thickness-swelling limit for JIS A 5908 Type 8 [28], whereas G1 remained marginally above it.
3. MOR increased with dosage in every fraction, by roughly 213% to 317% between 8% and 12% UF, yet the highest value of 4.67 MPa reached only 58% of the 8 MPa required for Type 8. MOE responded much less, gaining 34% to 58% and remaining below 430 MPa.
4. SEM confirmed continuous resin bridges between particles alongside residual voids, a microstructure consistent with the limited flexural performance measured.
5. Because strength rose with both dosage and fineness while stiffness did not, mangosteen pericarp alone is unlikely to reach Type 8 requirements. Blending in a fibrous component is the more promising direction for future formulation work.
6. Mangosteen peel is therefore suitable at this stage only for non-structural uses in which bending strength is not the governing requirement. No industrial application should be proposed until internal bond strength and formaldehyde emission have been measured, and until a replicated factorial study with statistical analysis has confirmed the trends reported here.
This research was funded by the Fundamental Fund (FF) under the National Research Council of Thailand (NRCT) with Contract no. 12700/2567.
|
MOR |
modulus of rupture, MPa |
|
MOE |
modulus of elasticity in bending, MPa |
|
TS |
thickness swelling, % |
|
WA |
water absorption, % |
|
UF |
urea-formaldehyde |
|
SEM |
scanning electron microscopy |
|
P |
maximum load, N |
|
L |
span length, mm |
|
b |
specimen width, mm |
|
t |
specimen thickness, mm |
|
m |
slope of the linear region of the load-deflection curve, N/mm |
|
T1 |
specimen thickness before immersion, mm |
|
T2 |
specimen thickness after immersion, mm |
|
W1 |
specimen weight before immersion, g |
|
W2 |
specimen weight after immersion, g |
|
G1 |
particle size group 1, 2.36–4.75 mm |
|
G2 |
particle size group 2, 1.18–2.36 mm |
|
G3 |
particle size group 3, below 1.18 mm |
[1] Soontornwat, A., Pongsuttiyakorn, T., Rakmae, S., et al. (2024). Mangosteen pericarp processing technology to create economic value and reduce biowaste. Foods, 13(14): 2286. https://doi.org/10.3390/foods13142286
[2] Techawinyutham, L., Techawinyutham, W., Rangappa, S.M., Siengchin, S. (2024). Lignocellulose based biofiller reinforced biopolymer composites from fruit peel wastes as natural pigment. International Journal of Biological Macromolecules, 257: 128767. https://doi.org/10.1016/j.ijbiomac.2023.128767
[3] Reh, R., Kristak, L., Antov, P. (2022). Advanced eco-friendly wood-based composites. Materials, 15(23): 8651. https://doi.org/10.3390/ma15238651
[4] Kristak, L., Reh, R., Barbu, M.C., Tudor, E.M. (2025). Advances in wood-based composites. Polymers, 17(8): 1104. https://doi.org/10.3390/polym17081104
[5] Baharuddin, M.N.M., Zain, N.M., Harun, W.S.W., Roslin, E.N., Ghazali, F.A., Md Som, S.N. (2023). Development and performance of particleboard from various types of organic waste and adhesives: A review. International Journal of Adhesion and Adhesives, 124: 103378. https://doi.org/10.1016/j.ijadhadh.2023.103378
[6] Lee, S.H., Lum, W.C., Boon, J.G., et al. (2022). Particleboard from agricultural biomass and recycled wood waste: A review. Journal of Materials Research and Technology, 20: 4630-4658. https://doi.org/10.1016/j.jmrt.2022.08.166
[7] Mohd Ghani, R.S., Osman, M.S., Abdul Rani, A.I. (2024). Exploring the potential of Nipah palm frond as sustainable raw material for eco-friendly particleboard production. Cleaner and Circular Bioeconomy, 8: 100092. https://doi.org/10.1016/j.clcb.2024.100092
[8] Mahieu, A., Vivet, A., Poilane, C., Leblanc, N. (2021). Performance of particleboards based on annual plant byproducts bound with bio-adhesives. International Journal of Adhesion and Adhesives, 107: 102847. https://doi.org/10.1016/j.ijadhadh.2021.102847
[9] Betene, A.D.O., Ndiwe, B., Krishnan, G.S., et al. (2023). Processing of tropical agro-industrial waste for particleboard manufacture: Dimensional stability and mechanical performance. Journal of Building Engineering, 76: 107369. https://doi.org/10.1016/j.jobe.2023.107369
[10] Atoyebi, O.D., Aladegboye, O.J., Fatoki, F.O. (2021). Physico-mechanical properties of particle board made from coconut shell, coconut husk and palm kernel shell. IOP Conference Series: Materials Science and Engineering, 1107(1): 012131. https://doi.org/10.1088/1757-899X/1107/1/012131
[11] Martijanti, M., Sutarno, S., Juwono, A.L. (2021). Polymer composite fabrication reinforced with bamboo fiber for particle board product raw material application. Polymers, 13(24): 4377. https://doi.org/10.3390/polym13244377
[12] Kamara, L.V., Gandawijaya, R.A. (2023). The usage of dried breadfruit leaves as particle board material. IOP Conference Series: Earth and Environmental Science, 1169(1): 012048. https://doi.org/10.1088/1755-1315/1169/1/012048
[13] Guler, C., Copur, Y., Tascioglu, C. (2008). The manufacture of particleboards using mixture of peanut hull (Arachis hypoqaea L.) and European Black pine (Pinus nigra Arnold) wood chips. Bioresource Technology, 99(8): 2893-2897. https://doi.org/10.1016/j.biortech.2007.06.013
[14] Mirindi, D., Onchiri, R.O., Thuo, J. (2021). Physico-mechanical properties of particleboards produced from macadamia nutshell and gum Arabic. Applied Sciences, 11(23): 11138. https://doi.org/10.3390/app112311138
[15] Kawalerczyk, J., Dziurka, D., Dukarska, D., Wozniak, M., Walkiewicz, J., Mirski, R. (2024). The effect of urea-formaldehyde adhesive modification with diisocyanate-functionalized nanocellulose on the properties of particleboard. International Journal of Adhesion and Adhesives, 135: 103850. https://doi.org/10.1016/j.ijadhadh.2024.103850
[16] Nuamsrinuan, N., Naemchanthara, P., Limsuwan, P., Naemchanthara, K. (2019). Fabrication and characterization of particle board from coffee husk waste. Applied Mechanics and Materials, 891: 111-116. https://doi.org/10.4028/www.scientific.net/AMM.891.111
[17] Ciannamea, E.M., Marin, D.C., Ruseckaite, R.A., Stefani, P.M. (2017). Particleboard based on rice husk: Effect of binder content and processing conditions. Journal of Renewable Materials, 5(5): 357-362. https://doi.org/10.7569/JRM.2017.634125
[18] Taha, I., Elkafafy, M.S., El Mously, H. (2018). Potential of utilizing tomato stalk as raw material for particleboards. Ain Shams Engineering Journal, 9(4): 1457-1464. https://doi.org/10.1016/j.asej.2016.10.003
[19] de Souza, M.V., da Silva, S.A.M., Cazella, P.H.S., et al. (2022). Particleboards manufactured from Tectona grandis wood waste with homogeneous and three-layer heterogeneous compositions for commercial purposes. BioResources, 17(3): 5011-5020. https://doi.org/10.15376/biores.17.3.5011-5020
[20] Astari, L., Belleville, B., Ozarska, B., et al. (2024). Performance of self-binding engineered panels made from sweet corn stalks (Zea mays L.) for furniture applications. Bioresource Technology Reports, 25: 101802. https://doi.org/10.1016/j.biteb.2024.101802
[21] Faria, D.L., Gonçalves, F.G., Maffioletti, F.D., et al. (2024). Particleboards based on agricultural and agroforestry wastes glued with vegetal polyurethane adhesive: An efficient and eco-friendly alternative. Industrial Crops and Products, 214: 118540. https://doi.org/10.1016/j.indcrop.2024.118540
[22] Todorovic, T., Demircan, D., Ekstrom, J., Hjelm, L., Malmstrom, E., Fogelstrom, L. (2024). Locust bean gum as an adhesive for wood particleboards. Industrial Crops and Products, 208: 117841. https://doi.org/10.1016/j.indcrop.2023.117841
[23] Maksymiuk, G., Jezo, A., Rizikovs, J. (2024). Selected physical and mechanical properties of particleboards manufactured with addition of Betula bark post-extraction residues. European Journal of Wood and Wood Products, 82: 1981-1992. https://doi.org/10.1007/s00107-024-02136-5
[24] Ferrandez-Garcia, C.E., Ferrandez-Garcia, A., Ferrandez-Villena, M., Hidalgo-Cordero, J.F., Garcia-Ortuno, T., Ferrandez-Garcia, M.T. (2018). Physical and mechanical properties of particleboard made from palm tree prunings. Forests, 9(12): 755. https://doi.org/10.3390/f9120755
[25] Boruszewski, P., Borysiuk, P., Jankowska, A., Pazik, J. (2022). Low-density particleboards modified with expanded and unexpanded fillers—Characteristics and properties. Materials, 15(13): 4430. https://doi.org/10.3390/ma15134430
[26] Zhang, L.Y., Chen, Y.Z., Geng, S.M., et al. (2024). Development of plant oil-based adhesives for formaldehyde-free bamboo particleboards. Industrial Crops and Products, 210: 118146. https://doi.org/10.1016/j.indcrop.2024.118146
[27] ASTM International. (2012). ASTM D1037-12(2020), Standard test methods for evaluating properties of wood-base fiber and particle panel materials. ASTM International, West Conshohocken, PA, USA. https://doi.org/10.1520/D1037-12R20
[28] Japanese Standards Association. (2022). JIS A 5908:2022, Particleboards. Japanese Industrial Standard, Tokyo, Japan. https://webstore.ansi.org/standards/jis/jis59082022.
[29] European Committee for Standardization. (1993). EN 310:1993, Wood-based panels. Determination of modulus of elasticity in bending and of bending strength. CEN, Brussels, Belgium. https://knowledge.bsigroup.com/products/wood-based-panels-determination-of-modulus-of-elasticity-in-bending-and-of-bending-strength-1.
[30] Oonjittichai, W., Chunarom, L. (2008). Technical possibility on particleboards manufacturing from bark of Eucalyptus camaldulensis. Research and Development Office, Royal Forest Department, Bangkok, Thailand.