
Dunya A. Hamdi
© 2026 The author. This article is published by IIETA and is licensed under the CC BY 4.0 license (http://creativecommons.org/licenses/by/4.0/).
OPEN ACCESS
This work, four nanoparticle samples: silver (Ag), zinc oxide (ZnO) and composites ZnO75 + Ag25 and ZnO50 + Ag50 was prepared using the green method with a plant extract from Laurus nobilis leaves. Four samples were analyzed by energy-dispersive X-ray spectroscopy (EDX), field emission scanning electron microscopy (FESEM), X-ray diffraction (XRD), Ultraviolet-visible (UV-Vis) spectroscopy, and Fourier transform infrared spectroscopy (FTIR). The presence of the materials was confirmed by EDX. XRD determined the phase of polycrystalline nanomaterials, and the crystal sizes for ZnO, Ag, composite ZnO75 + Ag25, and ZnO50 + Ag50 were 23.8, 52, 25, and 23 nm, respectively. The shape of the samples was observed by FESEM to be different spherical, circular structures and had a size of about 44.65 nm to 100.08 nm. The FTIR spectrum peaks in the range between 437 and 513 cm−1 were due to ZnO, and the range 500 cm−1 corresponds to Ag. Ultraviolet (UV) spectroscopy found the value of band gap energy (Eg) (2.85, 2.5, 2.6, and 2.9 eV) for ZnO, Ag, ZnO75 + Ag25, and ZnO50 + Ag50 samples, respectively. The nanoparticles (NPs) Ag, ZnO, and composite ZnO75 + Ag25 and ZnO50 + Ag50 samples showed bactericidal activity against Staphylococcus aureus-positive and Pseudomonas aeruginosa-negative bacteria and recorded the highest inhibition diameter at a high concentration of 100 mg/mL. The antibacterial activity results of Ag, ZnO, and the composite ZnO75 + Ag25 and ZnO50 + Ag50 samples were recorded, with the highest inhibition diameter at a high concentration of 100 mg/mL. The effective effect against Staphylococcus aureus bacteria was 22 mm for ZnO50 + Ag50, more than Ag 19 mm, ZnO 17 mm, and 17 mm for ZnO75 + Ag25. Pseudomonas aeruginosa, ZnO recorded the highest inhibition diameter of 24 mm at a concentration of 100 mg/mL, more than Ag 22 mm, 20 mm for ZnO50 + Ag50, and 19 mm for ZnO75 + Ag25, respectively. Ag can enhance antibacterial activity through the surface plasmon resonance (SPR) effect and its interaction with active bacterial components. The ZnO50 + Ag50 composite (Eg = 2. 60 eV) exhibited the highest activity against Staphylococcus aureus, producing an inhibition zone diameter of 22 mm. However, there was no direct linear relationship between antibacterial activity and factors such as the Ag/ZnO ratio, surface properties, surface area, or reactive oxygen species (ROS) generation. Consequently, no single factor emerged as the sole determinant of activity when comparing the effects on Staphylococcus aureus and Pseudomonas aeruginosa. The Ag, ZnO, and composite ZnO75 + Ag25, ZnO50 + Ag50 NPs prepared by green technology showed an effective effect against bacterial growth, and the material shows potential for future biomedical use.
Laurus nobilis leaves, silver nanoparticles, zinc oxide nanoparticles, green synthesis, composite
Recent years have witnessed a notable rise in the "green synthesis" of silver (Ag)/zinc oxide (ZnO) nanocomposites using plant-based products and biological organisms, a method valued for its eco-friendliness and the resulting potent antibacterial properties. Recent studies indicate that these nanocomposites exhibit superior performance compared to ZnO or Ag alone [1-3]. The interested in applying biological materials and their effects within the human body, preceded by many analyzes and tests that confirmed their effectiveness. Including metals (titanium alloys and others), ceramics (hydroxyapatite) and polymers of all kinds. Research has varied and varied in the manufacturing, coating, or mixing mechanism to arrive at materials with sound effectiveness, biocompatibility, and low risk within the human body [4-7]. Recently, materials have appeared that have proven their chemical and biological effectiveness in the body, and among these materials are Ag and ZnO. The methods for preparing these materials tend toward manufacturing nanomaterials by physical, chemical, and biological means, and each method has its own distinct characteristics in terms of shape and effects. To ensure environmental and in vivo safety, a biosynthetic approach, especially plant-derived synthesis, is the optimal strategy. Nano-sized Ag and ZnO particles are highly effective as antimicrobial, drug delivery, and anti-cancer cell systems [5]. Nanomaterials and their effective applications in many biomedical and healthcare applications, including ZnO nanoparticles (NPs), have emerged due to their high biocompatibility, low toxicity, cost and excellent biocompatibility, which has facilitated their use as a practical alternative to hazardous traditional raw materials. They are effective against a variety of respiratory viruses, including SARS-CoV-2, and have shown promising results in preventing, diagnosing, and treating COVID-19. They are also used in other applications such as supplements, food additives, and semiconductor materials due to its low toxicity. ZnO is an inert material. When exposed to light, it absorbs energy and turns into a semiconductor, which leads to the release of zinc ions. Molecular effects resulting from the semiconducting or electronic properties of ZnO NPs produce reactive oxygen species (ROS) as a result of the release of excess zinc ions. To reduce the toxicity of ZnO NPs, their surface is coated with silica, which prevents the release of zinc ions (Zn2+) and the generation of ROS. This reduces their toxicity and allows them to be used as a biological and bactericidal agent [4-8]. Ag, especially its NPs, is an effective antibacterial agent, and many methods have been developed to prepare it free of toxic chemical components. We prepared Ag NPs using a biological method, where plant extracts of Artocarpus heterophylus and Azadirachta indica were used as reducing and stabilizing agents in the process of synthesizing Ag NPs. Another study used an environmentally friendly method using plant extracts such as flowers, leaves, bark, roots, and stems as antimicrobials, antifungals, and anti-cancer agents, using whole plant parts [9-11]. Ag/ZnO NPs with a size of 30-50 nm were prepared using an environmentally friendly plant extract method, where Amla (Phyllanthus emblica) seed extract was used as a reducing agent, and this method showed antibacterial activity. The antibacterial activity against Salinivbrio proteolyticus, Bacillus subtilis, and Staphylococcus epidermidis, dl has been evaluated, and the compound can be used in medical applications such as wound healing and medical dressings [12]. Other research has also been conducted to develop Ag-ZnO NPs in an environmentally friendly manner. Eclipta prostrate (EP), Eclipta alba (EA). A multi-herbal extract was used to manufacture Ag-ZnO nanocomposites (Ag-ZnO NCs) via the sol-gel method at different concentrations; the Ag-ZnO NPs, at a concentration of 50 μg, achieved higher antimicrobial activity than the extract alone and high chemical stability for 90 days [13, 14]. In another study, four metal NPs (NPs) with propolis extract (Ext) with NPs including ZnO/Ext, ZnO/Ag/Ext, ZnO/CuO/Ext, ZnO/Ag/CuO/Ext, and ZnO/W, were prepared by microwave method; Fourier transform infrared (FTIR) spectroscopy, TGA, and Brunauer-Emmett-Teller analyses. The results have proven their importance in direct application to tissues (inside the body), accelerating wound healing [15, 16]. The literature supports principally three mechanisms that have been observed together or separately, by which AgNPs exert their antibacterial action [17-19]. The first one postulates that AgNPs act at a membrane level, as they can penetrate the outer membrane, accumulating in the inner membrane where the adhesion of the NPs to the cell generates their destabilization and damage, increasing membrane permeability and inducing leakage of cellular content and subsequently its death [20, 21].
3.1 Manufacturing of nano-silvar and ZnO by chemical method
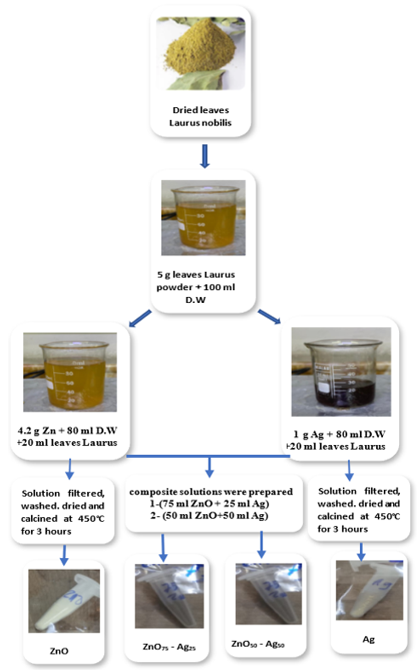
NPs were prepared using the green method with a plant extract from Laurus nobilis leaves.
Dried leaves of Laurus nobilis were collected, ground, and 5 g were dissolved in 100 mL of deionized water. The solution was then placed on a magnetic stirrer (IKA C-MAG HS 7, German) for 5 hours at 60 ℃. Afterward, it was filtered by centrifugation to remove all impurities. The phytochemicals present in Laurus nobilis leaf extract, such as polyphenols and flavonoids, act as natural reducing and capping agents by reducing metal ions, promoting nanoparticle nucleation and growth, and stabilizing the synthesized NPs.
Figure 1. Method of preparation of (Ag, ZnO, ZnO75-Ag25 and ZnO50-Ag50) nanopowder
•Zinc acetate concentration was approximately 0.24 M by dissolving 4.2 g of zinc acetate salt in 80 mL of deionized water, placed on a magnetic stirrer, and adding 20 mL of the plant extract at 60 ℃ for 3 hours. A colour change in the solution was observed, indicating the formation of a suspended nanomaterial. The solution was then filtered using filter paper and washed three times with deionized water and ethanol. Finally, it was dried and calcined at 450 ℃ for 3 hours to obtain ZnO NPs, with an alkaline medium (pH = 11).
•Ag is also prepared by dissolving approximately 0.074 M 1.0 g of Ag nitrate (AgNO₃) in 80 mL of deionized water and adding 20 mL of plant extract drop by drop at 60 ℃, stirring with a magnetic stirrer for 3 hours. Afterward, it is filtered using a centrifuge at 9000 rpm, washed with water and alcohol, dried at room temperature, and calcined at 450 ℃ for 3 hours to obtain nano-Ag in an alkaline medium (pH = 10).
•Two composite solutions were mixed with volume ratios of 75:25 and 50:50. were prepared (75 ZnO+ 25 Ag) and (50 ZnO + 50 Ag), each composite placed on a magnetic stirrer at 60 ℃ for 3 hours. The solution is separated by centrifugation, washed with water and alcohol, dried at room temperature, and calcined at 450 ℃ for 3 hours; pH = 10-11.
•Four samples were prepared (Ag, ZnO, ZnO75-Ag25, ZnO50-Ag50), as shown in Figure 1.
3.2 Bacterial preparation
Mueller Hinton broth and agar (HIMEDIA, India). After autoclaving for 15 minutes at 121 ℃ and 15 pounds per square inch of pressure, the medium cooled to 45 ℃ before being poured into Petri dishes. The disk diffusion technique was utilized to ascertain the aqueous extract's sensitivities in vitro. Using the direct colony suspension method, Petri plates containing Mueller-Hinton agar were inoculated to a density of 1 × 10⁸ bacterial cells/ml in Mueller-Hinton broth (MHB), or 0.5 McFarland standard. Following a wipe onto the plates, 100 µl of the activated microbe solution was allowed to sit at room temperature for ten minutes. Utilizing a sterile stainless steel cork borer, four wells with identical dimensions and depth (6 mm in diameter) were created in the agar. Different concentrations of the extract (20 mg/ml, 40 mg/ml, and 60 mg/ml) were added to each well, while chlorhexidine digluconate (CHX) (0.2%) was added to the fourth well as a positive control. The plates underwent an aerobic 18-24-hour incubation period at 37 ℃ [22].
Four samples were prepared (Ag, ZnO, ZnO75-Ag25, ZnO50-Ag50) NPs and tested as follows: X-ray diffraction (XRD) (XRD data were collected on a diffractometer Shimadzu 6000, Japan) with CuKα radiation to study crystalline structure and present materials with a scan range of 20-80 degrees, 0.03-degree step, and a count time of 0.24 sec. Field emission scanning electron microscopy (FESEM) and energy-dispersive X-ray spectroscopy (EDX) (JEOL-JSM-5600), 30 kV, Working distance 7.4 mm, pressure 1.07 × 10⁻² Pa, and spot 3.2. Used to investigate the topography, the surface, and elemental composition. FTIR (ALPHA II, Tensor II- Bruker Germany), ultraviolet (UV) (Evolution 220-Thermo Fisher Scientific, USA). Also, the NPs Ag, ZnO, and composite ZnO75-Ag25, ZnO50-Ag50 samples showed bactericidal activity against Staphylococcus aureus-positive and Pseudomonas aeruginosa-negative bacteria.
5.1 X-ray diffraction test
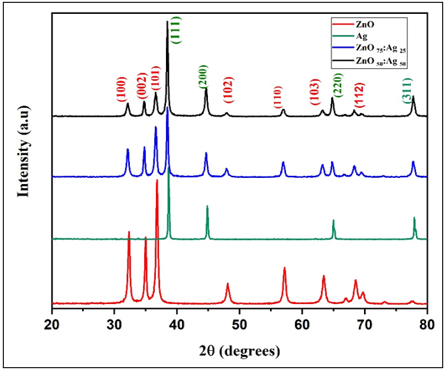
The structural properties of the samples were analysed using XRD. Figure 2 showed the formation of distinct Polycrystalline nanomaterial phases for both ZnO and Ag, ZnO75 + Ag25 and ZnO75 + Ag25. For the ZnO sample, the pattern showed distinctive diffraction peaks belonging to the hexagonal structure, for 2θ⸰ (32, 34, 36, 57, 63, 68, 77) corresponding to different crystallographic planes (100), (002), (101), 102), (110), (103), (112) with card Joint Committee on Powder Diffraction Standards (JCPDS) (01-075-1526) [23]. While as for the Ag 2θ⸰ (38, 44, 65, 77) respectively, corresponding miller indices (111), (200), (220), (311) which is consistent with the cubic structure of Ag [24], indicating the successful formation of Ag NPs is the known structure Which matches card JCPDS (00-004-0783). As for the sample prepared with different ratios of ZnO75 + Ag25, peaks of ZnO were observed, while Ag peaks appeared with less intensity, such as the peak at 2θ⸰ (38.1). This indicates the presence of Ag in the prepared sample without a change in the crystal structure. A slight shift was also observed due to interference or lattice stress. However, in the ZnO50 + Ag50 sample, the intensity of the Ag peaks increased significantly, especially at the2θ⸰ 38° and 44° angles, with the continued appearance of the ZnO peaks [25]. This indicates the simultaneous presence of two phases in the material. Furthermore, the widening of the peaks may indicate a small crystal size, which is consistent with [26]. The crystal size (D) and full width at half maximum (FWHM) were calculated using the Scherrer Eq. (1) [27]:
$D=\frac{0.9 \lambda}{\beta \cos \vartheta}$ (1)
where,
D: crystallite size measured in nanometers.
β: full Width at Half Maximum measured in radians.
λ: wavelength of X-ray measured (0. 15406 nm).
Figure 2. X-ray diffraction (XRD) pattern comparison for ZnO, Ag, ZnO50 + Ag50 and ZnO25 + Ag75
The results showed that the crystal diameter falls within the nanoscale range for ZnO and Ag; the composite ZnO75 + Ag25 and ZnO50 + Ag50 were 23.8, 52, 25, and 23 nm, respectively. A slight increase in crystal size was observed compared to ZnO. This is attributed to the interaction of Ag with ZnO, resulting in crystal growth due to the presence of Ag. The small particle size is also attributed to the presence of a plant extract, which acts as a reducing and coating agent, thus contributing to the small size of the materials prepared using the green method, as shown in Table 1. Regarding the XRD analysis results—specifically the peak broadening (increased FWHM) observed due to the green chemistry synthesis method—the widening of the peak indicates a reduction in particle size. This confirms the efficiency of the synthesis method for producing the nanomaterial, a finding consistent with the cited sources [28-31].
Table 1. The structural parameters of the ZnO, Ag, ZnO50 + Ag50, and ZnO25 + Ag75 samples
|
Samples |
2θ (Degree) |
FWHM β (Radian) |
D (nm) |
(hkl) |
Dave (nm) |
|
ZnO |
32.3 |
0.3743 |
22 |
100 |
23.8 |
|
|
34.9 |
0.3164 |
26.3 |
002 |
|
|
|
36.8 |
0.3624 |
23 |
101 |
|
|
|
47.1 |
0.4198 |
21.5 |
102 |
|
|
|
57.4 |
0.4653 |
20 |
110 |
|
|
|
63.5 |
0.5002 |
19.2 |
103 |
|
|
|
68.7 |
0.3397 |
30 |
112 |
|
|
|
77.2 |
0.2172 |
43.4 |
202 |
|
|
Ag |
38.6 |
0.1612 |
52.21 |
111 |
52 |
|
|
44.87 |
0.1735 |
49.51 |
200 |
|
|
|
65.01 |
0.1683 |
55.94 |
220 |
|
|
|
77.96 |
0.1734 |
58.91 |
311 |
|
|
ZnO75: Ag25 |
32.14 |
0.3849 |
21.47 |
100 |
25 |
|
|
34.79 |
0.2832 |
29.38 |
002 |
|
|
|
36.61 |
0.3478 |
24.05 |
101 |
|
|
|
38.47 |
0.2698 |
31.17 |
111 |
|
|
|
44.64 |
0.3641 |
23.57 |
200 |
|
|
|
56.95 |
0.4022 |
22.46 |
110 |
|
|
|
64.79 |
0.2791 |
33.69 |
220 |
|
|
|
68.29 |
0.4468 |
21.47 |
112 |
|
|
|
77.73 |
0.3191 |
21.47 |
311 |
|
|
ZnO50: Ag 50 |
32.14 |
0.4584 |
18.02 |
100 |
22 |
|
|
34.77 |
0.3012 |
27.62 |
002 |
|
|
|
36.61 |
0.4394 |
19.03 |
101 |
|
|
|
38.47 |
0.2631 |
31.96 |
111 |
|
|
|
44.65 |
0.3692 |
23.25 |
200 |
|
|
|
56.95 |
0.4900 |
18.43 |
110 |
|
|
|
64.79 |
0.2991 |
31.44 |
220 |
|
|
|
77.74 |
0.3379 |
30.02 |
311 |
|
Table 2 shows the lattice constants (a, c) for the ZnO (Hexagonal Wurtzite) crystal structure; the values were calculated using Eqs. (2) and (3) (for ZnO, there are two unknowns in the equation (a and c); therefore, we choose the vertices so that the equation contains only one unknown. While for Ag (Face-Centered Cubic) there is only one unknown, the lattice constant (a) was calculated by using Eqs. (3) and (4). The ZnO-Ag composite doesn’t have a new crystal structure. Rather, it is a biphasic nanocomposite, and the lattice constant was also calculated using Eqs. (2) and (3).
$d=\frac{y}{2 \sin \theta}$ (2)
$\frac{1}{d^2}=\frac{4}{3}\left(\frac{h^2+h k+k^2}{a^2}\right)+\frac{l^2}{c^2}$ (3)
$a=d \sqrt{h^2+k^2+l^2}$ (4)
where,
(hkl): Miller indices.
d: Interplanar spacing.
Based on the literature review the lattice constant for ZnO are (a = 3.249, c = 5.206) A⸰ and for Ag the value of lattice (a = 4.086) A⸰. Observing the results in Table 2, we note the proximity of the values for the first ZnO and second Ag samples individually [32, 33]. There is no single standard value for the lattice constant of the ZnO/Ag composite, due to variations in crystal structure and preparation method. We observe that the value of the lattice constant (c)for the composite samples ZnO75: Ag25 and ZnO50: Ag 50 is close to its value in the single sample ZnO, while the value of the lattice constant (a) is closer to that of Ag than to that of ZnO. This behavior indicates that the Ag did not form a new crystalline phase with the ZnO; instead, it exists as a separate phase on the ZnO surface or at its grain boundaries (forming a heterojunction). Given that ZnO possesses a hexagonal (wurtzite) structure, the c-axis remains relatively stable and less affected by the presence of Ag particles, thus remaining close to its standard value. The variation in the a-axis parameter is attributed to lattice strain and interactions at the ZnO/Ag interface, resulting in a slight shift in lattice constants-particularly along the basal directions-while both ZnO and Ag retain their respective crystalline phases [34].
Table 2. The lattice constants of the ZnO, Ag, ZnO50 + Ag50, and ZnO25 + Ag75 samples
|
Samples |
2θ (Degree) |
(hkl) |
D (A⸰) |
A (A⸰) |
c (A⸰) |
aave, (A⸰) |
cave (A⸰) |
|
ZnO |
32.3 |
100 |
2.768 |
3.196 |
|
3.201 |
5.135 |
|
|
34.9 |
002 |
2.567 |
|
5.135 |
|
|
|
|
36.8 |
101 |
2.439 |
|
|
|
|
|
|
47.1 |
102 |
1.927 |
|
|
|
|
|
|
57.4 |
110 |
1.603 |
3.206 |
|
|
|
|
|
63.5 |
103 |
1.463 |
|
|
|
|
|
|
68.7 |
112 |
1.364 |
|
|
|
|
|
|
77.2 |
202 |
1.234 |
|
|
|
|
|
Ag |
38.6 |
111 |
2.329 |
4.035 |
|
4.045 |
|
|
|
44.87 |
200 |
2.017 |
4.035 |
|
|
|
|
|
65.01 |
220 |
1.432 |
4.052 |
|
|
|
|
|
77.96 |
311 |
1.224 |
4.059 |
|
|
|
|
ZnO75: Ag25 |
32.14 |
100 |
2.781 |
3.211 |
|
4.218 |
5.151 |
|
|
34.79 |
002 |
2.575 |
|
5.151 |
|
|
|
|
36.61 |
101 |
2.451 |
|
|
|
|
|
|
38.47 |
111 |
2.337 |
|
|
|
|
|
|
44.64 |
200 |
2.027 |
4.682 |
|
|
|
|
|
56.95 |
110 |
1.6150 |
3.230 |
|
|
|
|
|
64.79 |
220 |
1.437 |
5.749 |
|
|
|
|
|
68.29 |
112 |
1.371 |
|
|
|
|
|
|
77.73 |
311 |
1.227 |
|
|
|
|
|
ZnO50: Ag 50 |
32.14 |
100 |
2.781 |
3.211 |
|
4.218 |
5.154 |
|
|
34.77 |
002 |
2.577 |
|
5.154 |
|
|
|
|
36.61 |
101 |
2.451 |
|
|
|
|
|
|
38.47 |
111 |
2.337 |
|
|
|
|
|
|
44.65 |
200 |
2.027 |
4.681 |
|
|
|
|
|
56.95 |
110 |
1.615 |
3.230 |
|
|
|
|
|
64.79 |
220 |
1.437 |
5.749 |
|
|
|
|
|
77.74 |
311 |
1.227 |
|
|
|
|
5.2 Energy-dispersive X-ray spectroscopy test
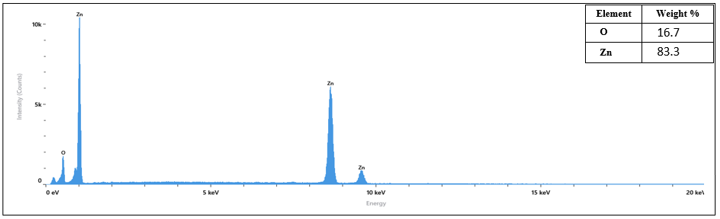
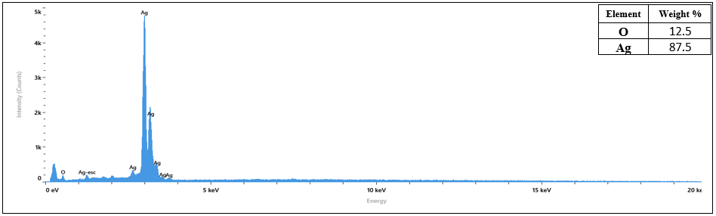
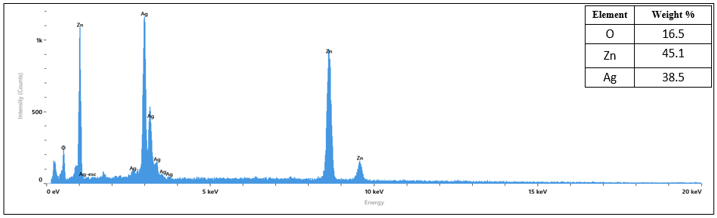
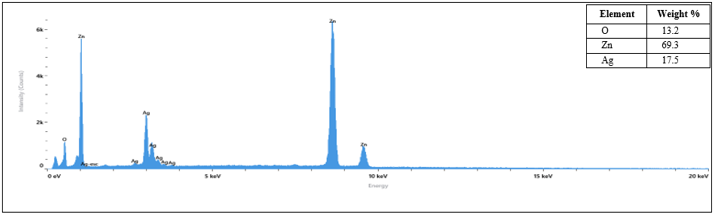
The EDX elemental analysis can be identified by peaks for ZnO, Ag, ZnO50 + Ag50, and ZnO25 + Ag75 NPs, as shown in Figures 3-6, close to the tables assisted with Figures 3-6. The energy transitions that represent Zn (Lα = 1.012, Kα = 8.046, and Kβ = 9.5 KeV), O (Kα = 0.5 KeV) and Ag (Mα = 0.30, Lα = 2.89, Lβ = 3.15 and Lγ = 3.35 KeV). The EDX elemental analysis show the major peaks for Zn at Lα = 1.012 and especially at Kα 8.046, the presence of peaks at high energies signifiesand increasing in intensity with increasing the concentration, a transition that is mean translation for K level. While the Ag peaks concentrate near L ≈ 3 the major peak Lβ = 3.15 and Lγ = 3.35 KeV, it is requires a higher excitation voltage [35, 36].
Figure 3. Energy-dispersive X-ray spectroscopy (EDX) elemental analysis for ZnO sample
Figure 4. Energy-dispersive X-ray spectroscopy (EDX) elemental analysis for Ag sample
Figure 5. Energy-dispersive X-ray spectroscopy (EDX) elemental analysis for ZnO50 + Ag50 sample
Figure 6. Energy-dispersive X-ray spectroscopy (EDX) elemental analysis for ZnO75 + Ag25 sample
5.3 Field emission scanning electron microscopy test
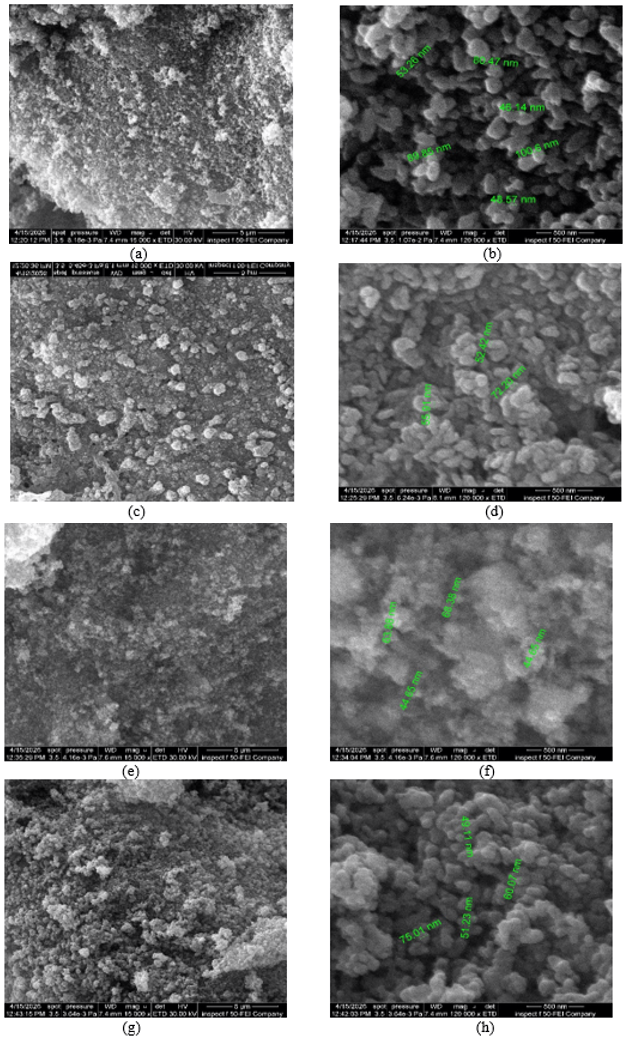
The FESEM test images with magnification (5 µm to 500 nm) for all samples in Figures 7(a-h) have a size of about 44.65 nm to 100.08 nm. At high magnification (500 nm), the bright Ag particle clustering shows non-uniform morphology of the particles, with spherical, circular structures and oval and some asymmetric shapes; ZnO has spherical, circular structures and self-assembled star-like structures. The agglomeration clear in composite samples ZnO50-Ag50 more compact structure with smaller particles. Increasing the ZnO concentration ZnO75-Ag25 resulted in High density with large clumps homogeneous particle distribution. The agglomeration is due to high surface energy NPs, specifically ZnO [37].
Figure 7. Field emission scanning electron microscopy (FESEM) image samples at different magnifications: a and b: ZnO sample; c and d: Ag sample; e and f: ZnO50 + Ag50 sample; and g-h: ZnO75 + Ag25 sample
5.4 Fourier transform infrared test
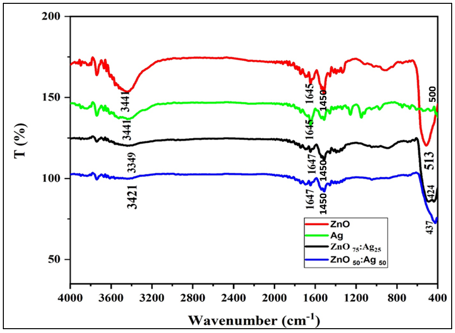
FTIR spectroscopy from 400 up to 4000 cm−1 Range in Figure 8 were use to investigated nanopowders pure ZnO, Ag, composite ZnO50 + Ag50 and ZnO75 + Ag25 samples shown in Figure 8. In the ZnO, composite ZnO50 + Ag50, and ZnO75 + Ag25 samples, the absorption bands in the range between 437 and 513 cm−1 correspond to the vibrations of Zn-O stretching, proving it is ZnO. The absorption bands at 1450 cm−1 correspond to the vibrations of C-O/Zn-OH Surface links. The absorption bands in the range between 1645 and1647 cm−1 correspond to the vibrations of H-O-H bending, production of ROS, and absorbed water bending. The absorption bands in the range between 3349 and 3441 cm−1 correspond to the vibrations of O-H stretching. In Ag, the absorption bands in the range 500 cm−1 correspond to the Ag-O bond vibration. The absorption bands in the range 1645 cm−1 correspond to Ag.
Figure 8. Fourier transform infrared (FTIR) analysis: ZnO, Ag, ZnO50 + Ag50 and ZnO75 + Ag25 samples
Shift occurs at vertices (composite ZnO50 + Ag50 and ZnO75 + Ag25 samples) this belong to change the chemical environment and interaction between Ag+ZnO lead to formation composite. The vibrations and ROS production are present in the four samples [38, 39].
5.5 Ultraviolet test
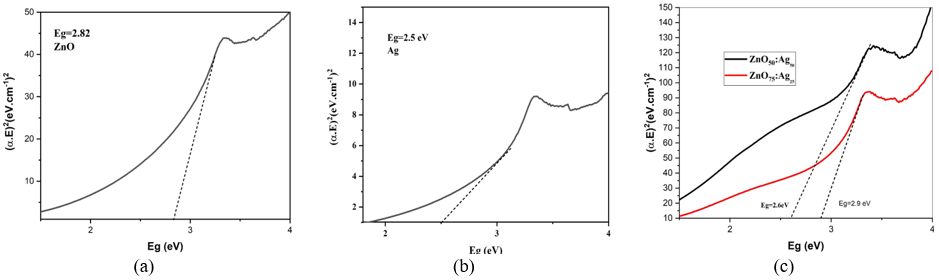
Figures 9(a)-(c), UV spectroscopy was used to calculate the band gap energy (Eg) for the nanopowders pure ZnO, Ag, composite ZnO50 + Ag50, and ZnO75 + Ag25 samples using Tauc Eq. (5) [40].
$(\alpha h v)^n=\mathrm{A}(h v-E g)$ (5)
where,
$\alpha$: Absorption coefficient (calculated from absorbance).
$h v$: Photon energy.
Eg: Band gap energy (in electron volts, eV).
A: Proportionality constant.
n: An exponent determining the nature of the electronic transition.
The values of Eg (2.85, 2.5, 2.6, and 2.9 eV) for ZnO, Ag, ZnO50 + Ag50, and ZnO75 + Ag25 samples, respectively. ZnO have large Eg value compared to value of Ag that’s due to stabilizer of ZnO [41]. After composite between ZnO50 + Ag50 sample the value of Eg decreasing, and ZnO75 + Ag25 sample the value of Eg returns to raise due to increasing the concentration of ZnO. A small Eg means that matter becomes more able to utilize energy from the surroundings and Increased production of ROS that lead to increased antibacterial activity rather than direct evidence of the mechanism, a cording to the reference [42] the antibacterial activity of ZnO is primarily linked to the generation of ROS. It is known that Ag element have surface plasmon resonance (SPR) phenomena and the ZnO work increased ROS production of (O2-, H2O2 and OH) that is clear in the result of FTIR analysis Figure 8 [43, 44]. A reduction in the ZnO band gap below the standard value of 3.2-3.3 eV can occur due to crystalline defects, the incorporation of Ag, or intra-gap energy states (defect states) [45].
Figure 9. Ultraviolet (UV) analysis: (a) ZnO, (b) Ag, (c) ZnO50 + Ag50 and ZnO75 + Ag25 samples
5.6 The disk-diffusion technique on agar
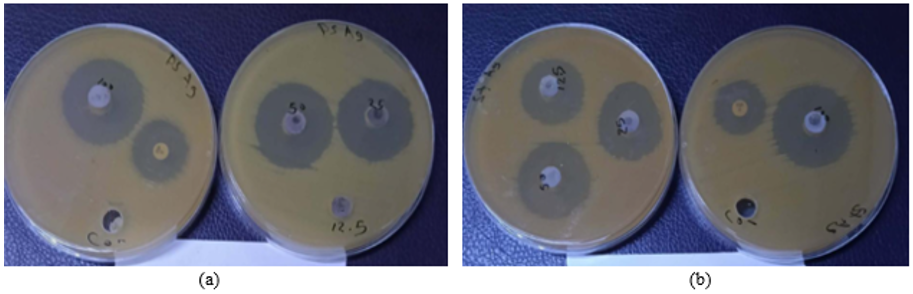
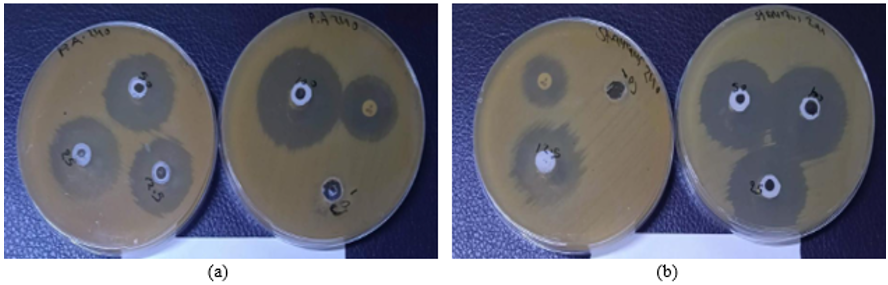
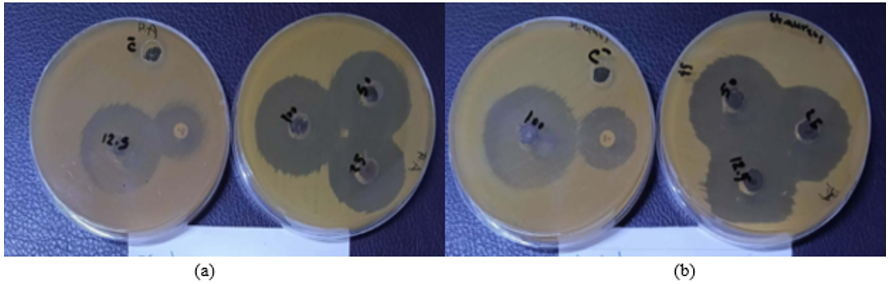
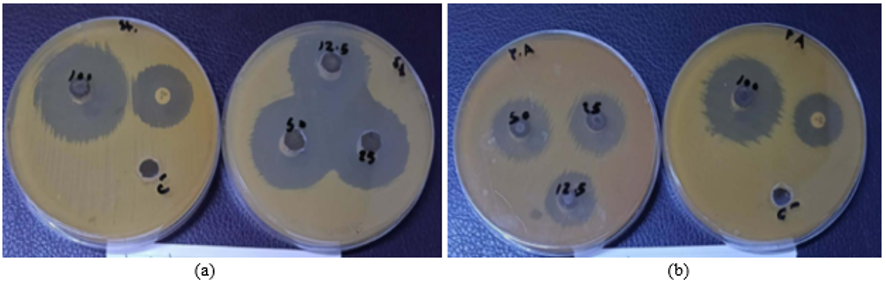
The antibacterial activity measured inhibition zone data are based on single measurements. The disk diffusion was employed to test Gram-negative and Gram-positive bacteria against Staphylococcus aureus-positive and Pseudomonas aeruginosa-negative bacteria, and the inhibition diameter was recorded at different concentrations (100%, 50%, 25%, and 12.5% mg/mL). Figures 10-13 and Table 3 show the results of antibacterial activity of Ag, ZnO, and composite ZnO75-Ag25 and ZnO50-Ag50 samples, respectively, and recorded the highest inhibition diameter at a high concentration of 100 mg/mL. The effective effect against Staphylococcus aureus bacteria showed 22 mm for ZnO50-Ag50, more than Ag 19 mm, ZnO 17 mm, and 17 mm for ZnO75-Ag25. Pseudomonas aeruginosa, ZnO recorded the highest inhibition diameter of 24 mm at a concentration of 100 mg/mL, more than Ag 22 mm, 20 mm for ZnO50-Ag50, and 19 for ZnO75-Ag25, respectively. The results regarding the bacterial impact revealed significant variations across the test conditions, depending on the type, composition, and concentration of the substance, as well as the specific bacterial strain used. Notably, the observed effects intensified with increasing substance concentration, with peak values recorded at 100 mg/mL, indicating that bacterial activity is dependent on the amount of substance available to interact with the bacterial cells. For Staphylococcus aureus, the ZnO50-Ag50 composite exhibited the largest inhibition zone 22 mm, compared to 19 mm for Ag and 17 mm for both ZnO and ZnO75-Ag25. This enhanced activity can be attributed to a synergistic effect between Ag and ZnO at the 50: 50 ratio; Ag contributes by interacting with bacterial cell components, while ZnO facilitates surface interactions and the generation of ROS. The reduced inhibition observed with ZnO75-Ag25 indicates that increasing the ZnO proportion does not necessarily enhance activity, demonstrating that the ratio of the composite's components influences the efficiency of the interaction with the cells. Regarding Pseudomonas aeruginosa, ZnO exhibited the highest inhibition (24 mm), whereas the values were 22 mm for Ag, 20 mm for ZnO50-Ag50, and 19 mm for ZnO75-Ag25. This indicates that the response to the nanocomposites varies depending on the bacterial species. Such variation may be linked to differences in cell envelope composition; Gram-negative bacteria possess an additional outer membrane that can influence the permeability of particles and active agents, as well as their interaction with the cell surface. Consequently, reduced inhibition observed with certain Ag/ZnO compositions does not imply lower overall antibacterial activity; rather, it reflects differences in the material's suitability and its interaction mechanism with the specific type of bacteria. The efficiency of bacterial inactivation depends on the composition and concentration of the hybrid (Ag/ZnO) composite and its Eg; incorporating Ag into ZnO modifies the composite's electronic properties. The ZnO component contributes to the generation of ROS—such as O₂⁻, H₂O₂, and OH—which can interact with bacterial cell walls and DNA, while the SPR effect of the Ag enhances the antibacterial activity [46, 47].
Figure 10. Antibacterial activity of Ag nanoparticles (NPs) using disk diffusion at concentrations (100%, 50%, 25%, 12.5%) against: (a) Staphylococcus aureus bacteria, (b) Pseudomonas aeruginosa bacteria
Figure 11. Antibacterial activity of ZnO nanoparticles (NPs) using disk diffusion at concentrations (100%, 50%, 25%, 12.5%) against: (a) Staphylococcus aureus bacteria, (b) Pseudomonas aeruginosa bacteria
Figure 12. Antibacterial activity of ZnO50 + Ag50 nanoparticles (NPs) using disk diffusion at concentrations (100%, 50%, 25%, 12.5%) against: (a) Staphylococcus aureus bacteria, (b) Pseudomonas aeruginosa bacteria
Figure 13. Antibacterial activity of ZnO75 + Ag25 nanoparticles (NPs) using disk diffusion at concentrations (100%, 50%, 25%, 12.5%) against: (a) Staphylococcus aureus bacteria, (b) Pseudomonas aeruginosa bacteria
Table 3. Antibacterial activity of Ag, ZnO, and composite ZnO75-Ag25, ZnO50-Ag50 samples using disk diffusion against Staphylococcus aureus bacteria and Pseudomonas aeruginosa bacteria
|
Sample NPs |
Antibacterial |
Type Bacteria |
Zone of Inhibition(mm) Conc Conc Conc Conc 100% 50% 25% 12.5% mg/mL mg/mL mg/mL mg/mL |
CIP (c.p) mm |
|||
|
Ag |
Staphylococcus aureus |
Positive control |
31 |
28 |
26 |
23 |
19 |
|
Pseudomonas aeruginosa |
Negative |
29 |
28 |
24 |
------- |
22 |
|
|
ZnO |
Staphylococcus aureus |
Positive control |
35 |
34 |
32 |
27 |
17 |
|
Pseudomonas aeruginosa |
Negative |
36 |
30 |
29 |
27 |
24 |
|
|
Ag50 + ZnO50 |
Staphylococcus aureus |
Positive control |
38 |
35 |
34 |
33 |
22 |
|
Pseudomonas aeruginosa |
Negative |
35 |
25 |
23 |
22 |
20 |
|
|
Ag25 + ZnO75 |
Staphylococcus aureus |
Positive control |
41 |
40 |
36 |
35 |
17 |
|
Pseudomonas aeruginosa |
Negative |
40 |
36 |
35 |
34 |
19 |
|
From previous results, we conclude that:
|
D |
crystallite size, nm |
|
a,c |
lattice parameters, A⸰ |
|
(hkl) |
miller indices |
|
d |
interplanar spacing, A⸰ |
|
P.C. |
positive control |
|
CIP |
ciprofloxacin |
|
nm |
nanometer |
|
mm |
millimeter |
|
M |
molarity |
|
g |
gram |
|
Greek symbols |
|
|
β |
full width at half maximum (FWHM), degrees |
|
λ |
wavelength of X-ray (1.5406 A˚) |
|
θ |
angle of diffraction, degree |
|
Subscripts |
|
|
f |
solid volume fraction |
|
Ɵ |
dimensionless temperature |
|
µ |
dynamic viscosity, kg.m-1.s-1 |
|
p |
nanoparticle |
|
f |
fluid (pure water) |
|
nf |
nanofluid |
[1] El-Khawaga, A.M., Elsayed, M.A., Gobara, M., et al. (2025). Green synthesized ZnO nanoparticles by Saccharomyces cerevisiae and their antibacterial activity and photocatalytic degradation. Biomass Conversion and Biorefinery, 15(2): 2673-2684. https://doi.org/10.1007/s13399-023-04827-0
[2] Barzinjy, A.A., Haji, B.S. (2024). Green synthesis and characterization of Ag nanoparticles using fresh and dry Portulaca oleracea leaf extracts: Enhancing light reflectivity properties of ITO glass. Micro & Nano Letters, 19(3): e12198. https://doi.org/10.1049/mna2.12198
[3] Tien, T.M., Chen, E.L. (2023). A novel ZnO/Co₃O₄ nanoparticle for enhanced photocatalytic hydrogen evolution under visible light irradiation. Catalysts, 13(5): 852. https://doi.org/10.3390/catal13050852
[4] Abdali, W., Hamdi, D.A., Kadhim, F.M. (2018). Reinforcement of poly (polymethylmethacrylate) with carbon fiber and alumina as a composite material for orthopedic implant. International Journal of Mechanical Engineering and Technology, 9(10): 388-398. https://iaeme.com/MasterAdmin/Journal_uploads/IJMET/VOLUME_9_ISSUE_10/IJMET_09_10_042.pdf.
[5] Hamdi, D.A. (2020). Investigating the mechanical properties of Ceramic-PMMA polymer composite. AIP Conference Proceedings, 2213: 020043. https://doi.org/10.1063/5.0000429
[6] Hamdi, D.A., Jiang, Z.-T., No, K., et al. (2019). Biocompatibility study of multi-layered hydroxyapatite coatings synthesized on Ti-6Al-4V alloys by RF magnetron sputtering for prosthetic-orthopaedic implant applications. Applied Surface Science, 463: 292-299. https://doi.org/10.1016/j.apsusc.2018.08.157
[7] Ehsan, M., Waheed, A., Ullah, A., et al. (2022). Plant-based bimetallic silver-zinc oxide nanoparticles: A comprehensive perspective of synthesis, biomedical applications, and future trends. Biomed Research International, 2022: 1215183. https://doi.org/10.1155/2022/1215183
[8] Mahmood, M.W., Abbas, N.K. (2025). Eco-friendly synthesis of cobalt oxide nanoparticles using Capparis spinosa fruit extract and their antibacterial application. International Journal of Design & Nature and Ecodynamics, 20(8): 1827-1831. https://doi.org/10.18280/ijdne.200813
[9] Fujihara, J., Nishimoto, N. (2024). Review of zinc oxide nanoparticles: Toxicokinetics, tissue distribution for various exposure routes, toxicological effects, toxicity mechanism in mammals, and an approach for toxicity reduction. Biological Trace Element Research, 202(1): 9-23. https://doi.org/10.1007/s12011-023-03644-w
[10] Annu, Chaudhry, S.A., Ikram, S. (2017). A review on biogenic synthesis of ZnO nanoparticles using plant extracts and microbes: A prospect towards green chemistry. Journal of Photochemistry and Photobiology B, 166: 272-284. https://doi.org/10.1016/j.jphotobiol.2016.12.011
[11] Islam, F., Shohag, S., Uddin, M.J., et al. (2022). Exploring the journey of zinc oxide nanoparticles (ZnO-NPs) toward biomedical applications. Materials, 15(6): 2160. https://doi.org/10.3390/ma15062160
[12] Manik, U.P., Nande, A., Raut, S., et al. (2020). Green synthesis of silver nanoparticles using plant leaf extraction of Artocarpus heterophyllus and Azadirachta indica. Results in Materials, 6: 100086. https://doi.org/10.1016/j.rinma.2020.100086
[13] Arshad, F., Naikoo, G.A., Hassan, I.U., et al. (2024). Bioinspired and green synthesis of silver nanoparticles for medical applications: A green perspective. Applied Biochemistry and Biotechnology, 196: 3636-3669. https://doi.org/10.1007/s12010-023-04719-z
[14] Thakkar, K.N., Mhatre, S.S., Parikh, R.Y. (2010). Biological synthesis of metallic nanoparticles. Nanomedicine, Nanotechnology, Biology and Medicine, 6: 257-262. https://doi.org/10.1016/j.nano.2009.07.002
[15] Vidhyadevi, G., Suseem, S.R. (2026). Green synthesis of Ag/ZnO nanocomposites from Phyllanthus emblica seed for multifunctional wound healing applications. Scientific Reports, 16: 8032. https://doi.org/10.1038/s41598-026-36568-1
[16] Zare, M., Namratha, K., Alghamdi, S., et al. (2019). Novel green biomimetic approach for synthesis of ZnO-Ag nanocomposite; antimicrobial activity against food-borne pathogen, biocompatibility and solar photocatalysis. Scientific Reports, 9(1): 8303. https://doi.org/10.1038/s41598-019-44309-w
[17] Shanmugam, K.S., Lakshmanan, R., Jagadeesan, R., et al. (2024). Green synthesis of bimetallic Ag-ZnO nanocomposite using polyherbal extract for antibacterial and anti-inflammatory activity. Chemical Physics Impact, 9: 100763. https://doi.org/10.1016/j.chphi.2024.100763
[18] Bayrami, M., Bayrami, A., Habibi-Yangjeh, A., et al. (2020). Biologically-synthesised ZnO/CuO/Ag nanocomposite using propolis extract and coated on the gauze for wound healing applications. IET Nanobiotechnology, 14(7): 548-554. https://doi.org/10.1049/iet-nbt.2020.0024
[19] Elango, B., Okram, G.S., Mathanmohun, M. (2023). Pharmacological applications of plant-mediated synthesized nanomaterials. Current Pharmacology Reports, 9(6): 511-522. https://doi.org/10.1007/s40495-023-00340-0
[20] Marambio-Jones, C., Hoek, E.M.V. (2010). A review of the antibacterial effects of silver nanomaterials and potential implications for human health and the environment. Journal of Nanoparticle Research, 12: 1531-1551. https://doi.org/10.1007/s11051-010-9900-y
[21] Qing, Y., Cheng, L., Li, R., et al. (2018). Potential antibacterial mechanism of silver nanoparticles and the optimization of orthopedic implants by advanced modification technologies. International Journal of Nanomedicine, 13: 3311-3327. https://doi.org/10.2147/IJN.S165125
[22] Dakal, T.C., Kumar, A., Majumdar, R.S., et al. (2016). Mechanistic basis of antimicrobial actions of silver nanoparticles. Frontiers in Microbiology, 7: 1831. https://doi.org/10.3389/fmicb.2016.01831
[23] Seong, M., Lee, D.G. (2017). Silver nanoparticles against Salmonella enterica serotype Typhimurium: Role of inner membrane dysfunction. Current Microbiology, 74: 661-670. https://doi.org/10.1007/s00284-017-1235-9
[24] Ivask, A., Elbadawy, A., Kaweeteerawat, C., et al. (2014). Toxicity mechanisms in Escherichia coli vary for silver nanoparticles and differ from ionic silver. ACS Nano, 8: 374-386. https://doi.org/10.1021/nn4044047
[25] Behera, B., Mathur, P., Das, A., et al. (2010). Evaluation of susceptibility testing methods for polymyxin. International Journal of Infectious Diseases, 14(7): e596-e601. https://doi.org/10.1016/j.ijid.2009.09.001
[26] Yogamalar, N.R., Srinivasan, R., Vinu, A., Ariga, K., Bose, A.C. (2009). X-ray peak broadening analysis in ZnO nanoparticles. Solid State Communications, 149(43-44): 1919-1923. https://doi.org/10.1016/j.ssc.2009.07.043
[27] Hassanzadeh-Tabrizi, S.A. (2023). Precise calculation of crystallite size of nanomaterials: A review. Journal of Alloys and Compounds, 947: 169410. https://doi.org/10.1016/j.jallcom.2023.169410
[28] Ranjithkumar, B., Kumar, E.R., Srinivas, M., et al. (2021). Evaluation of structural, surface morphological and thermal properties of Ag-doped ZnO nanoparticles for antimicrobial activities. Physica E: Low-dimensional Systems and Nanostructures, 133: 114801. https://doi.org/10.1016/j.physe.2021.114801
[29] Khorsand Zak, A., Hashim, A.M. (2026). Advanced XRD peak broadening analysis of gallium-doped ZnO nanoparticles for crystallite size evaluation. Scientific Reports, 16: 1717. https://doi.org/10.1038/s41598-025-31317-2
[30] Abbas, K.A. (2020). Histological and biochemical parameters follow-up in experimental rats administrated dexamethasone and treated with green synthesis titanium dioxide nanoparticles using Camellia sinensis extracts. Baghdad Science Journal, 17(2): 27. https://doi.org/10.21123/bsj.2020.17.2.0027
[31] Annu, Sahu, M., Singh, S., et al. (2024). From green chemistry to biomedicine: The sustainable symphony of cobalt oxide nanoparticles. RSC Advances, 14(45): 32733-32758. https://doi.org/10.1039/D4RA05872K
[32] Abdulelah, H. (2025). Simple method for calculation hexagonal lattice parameters (A and C) system of ZnO nanorod via X-ray analysis: Review. Journal for Technology and Science, 2(1): 27-32. https://doi.org/10.61796/ipteks.v2i1.390
[33] Song, J., Huang, Y., Fan, Y., et al. (2016). Detection of prohibited fish drugs using silver nanowires as substrate for surface-enhanced Raman scattering. Nanomaterials, 6: 175. https://doi.org/10.3390/nano6090175
[34] Cullity, B.D. (2001). Elements of X-Ray Diffraction. Pearson. ISBN: 9780131788183
[35] Ata, S., Tabassum, A., Ismat, I., et al. (2019). Synthesis and characterization of ZnO nanorods as an adsorbent for Cr(VI) sequestration. Journal of Physical Chemistry, 233(7): 995-1011. https://doi.org/10.1515/zpch-2018-1203
[36] Reyes, M., Maldonado-Luna, N.M., Rivera-Quiñones, C.M. (2020). Single step microwave assisted synthesis and antimicrobial activity of silver, copper and silver-copper nanoparticles. Journal of Materials Science and Chemical Engineering, 8(8): 13-29. https://doi.org/10.4236/msce.2020.88002
[37] Deslattes, R., Kessler, E.G., Indelicato, P., et al. (2003). X-ray transition energies: New approach to a comprehensive evaluation. Reviews of Modern Physics, 75: 35-99. https://doi.org/10.1103/RevModPhys.75.35
[38] Zgura, I., Enculescu, M., Istrate, C., et al. (2020). Performant composite materials based on oxide semiconductors and metallic nanoparticles generated from cloves and mandarin peel extracts. Nanomaterials, 10(11): 2146. https://doi.org/10.3390/nano10112146
[39] Al-Ariki, S., Yahya, N.A.A., Al-A’nsi, S.A., et al. (2021). Synthesis and comparative study on the structural and optical properties of ZnO doped with Ni and Ag nanopowders fabricated by sol gel technique. Scientific Reports, 11: 11948. https://doi.org/10.1038/s41598-021-91439-1
[40] Alyami, A.Y. (2026). Catalytic remediation of water pollutants using Ag/ZnO nanocomposites stabilized with carboxymethyl cellulose: A kinetic investigation. Journal of Analytical Science and Technology, 17: 6. https://doi.org/10.1186/s40543-026-00527-2
[41] Tauc, J., Grigorovici, R., Vancu, A. (1966). Optical properties and electronic structure of amorphous germanium. Physica Status Solidi (b), 15: 627-637. https://doi.org/10.1002/pssb.19660150224
[42] Sirelkhatim, A., Mahmud, S., Seeni, A., et al. (2015). Review on zinc oxide nanoparticles: Antibacterial activity and toxicity mechanism. Nano-Micro Letters, 7(3): 219-242. https://doi.org/10.1007/s40820-015-0040-x
[43] Li, Y., Zhang, W., Niu, J., Chen, Y. (2012). Mechanism of photogenerated reactive oxygen species and correlation with the antibacterial properties of engineered metal-oxide nanoparticles. ACS Nano, 6(6): 5164-5173. https://doi.org/10.1021/nn300934k
[44] Özgür, Ü., Alivov, Y.I., Liu, C., et al. (2005). A comprehensive review of ZnO materials and devices. Journal of Applied Physics, 98(4): 041301. https://doi.org/10.1063/1.1992666
[45] Lansdown, A.B.G. (2010). A pharmacological and toxicological profile of silver as an antimicrobial agent in medical devices. Advances in Pharmacological Sciences, 2010: 910686. https://doi.org/10.1155/2010/910686
[46] Cho, K.H., Park, J.E., Osaka, T., et al. (2005). The study of antimicrobial activity and preservative effects of nanosilver ingredient. Electrochimica Acta, 51(5): 956-960. https://doi.org/10.1016/j.electacta.2005.04.071
[47] Uysal, Y., Doğaroğlu, Z.G., Çaylali, Z., et al. (2024). Rosemary-mediated green synthesis of ZnO nanoparticles and their integration into hydrogel matrices: Evaluating effects on wheat growth and antibacterial properties. Global Challenges, 8(11): 2400120. https://doi.org/10.1002/gch2.202400120